Labour market statistics (Annual Population Survey): October 2021 to September 2022
Labour market data for UK countries and regions and also for local areas for October 2021 to September 2022.
In this page
Background
The Annual Population Survey (APS) combines the boosted samples of the Labour Force Survey (LFS). It provides rolling four-quarter labour market data for UK countries and regions as well as for local areas.
The LFS remains the main source for headline labour market indicators at a Wales level. The larger sample of the APS allows for estimates at a local authority level and for sub-groups of the population.
Welsh Government published a more detailed analysis of protected characteristics in the labour market in Wales on 16 December 2021. We welcome your feedback on this publication and priorities for future analyses, please see contact details at the end of this release.
Employment
The employment rate for people aged 16 to 64 in Wales was 73.4% in the year ending September 2022, up 0.7 percentage points on the previous year. The UK rate was 75.4%, up 0.8 percentage points over the year.
The largest increases in employment rates over the year were seen in Blaenau Gwent (up 7.7 percentage points to 74.6%), Rhondda Cynon Taf (up 6.3 percentage points to 74.9%) and Merthyr Tydfil (up 5.9 percentage points to 71.7%).

Economic regions
The employment rate in North Wales was 74.8%, an increase of 0.9 percentage points, in Mid & South West Wales the rate was 73.0%, an increase of 0.4 percentage points and in South East Wales the rate was 73.1% an increase of 0.7 percentage points. North Wales continued to have the highest employment rate of the three economic regions (Differences calculated using unrounded figures).
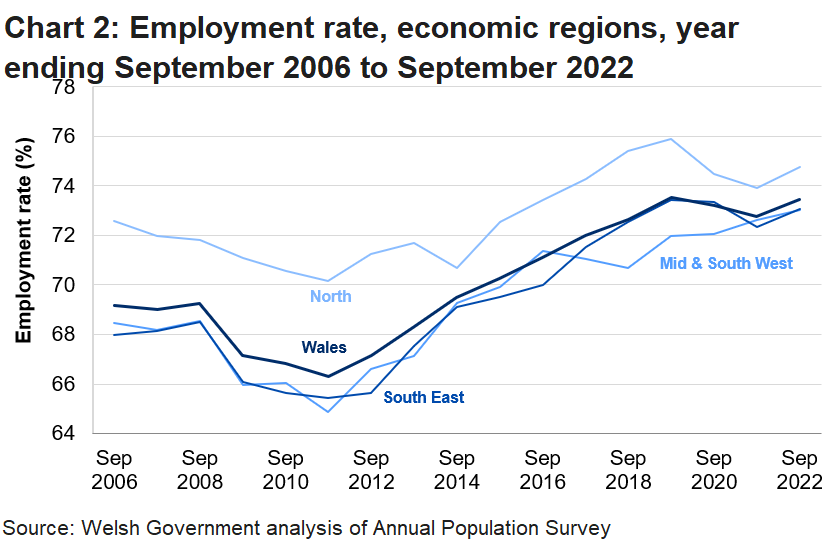
The overall trend for Wales and the three Welsh economic regions over the last four years saw a steady increase in employment until the coronavirus (COVID-19) pandemic, with North Wales remaining consistently higher than Wales and the other economic regions. Following on from a period of decreasing employment rates from the year ending June 2020, employment rates across each of the economic regions and Wales have generally increased since the year ending June 2021.
The Percentage of people in employment is one of the national wellbeing indicators. A national milestone has been set for this national indicator which is to eradicate the gap between the employment rate in Wales and the UK by 2050, with a focus on fair work and raising labour market participation of under-represented groups. Welsh employment has gradually increased since 2011 and the gap between the UK and Wales employment rate has gradually closed to 2.0 percentage points.
Further information on the national indicators, national milestones and the Well-being of Future Generations Act is provided towards the end of this release.
Unemployment
In the year ending September 2022, the unemployment rate for people aged 16 and over in Wales was 3.2%, down 0.9 percentage points compared with the previous year. The UK rate was 3.6%, down 1.1 percentage points over the year. The unemployment rates in both Wales and the UK for the year ending September 2022 was the lowest since APS records began in 1996.
Please note data for 11 of the 22 local authorities have been suppressed due to sample sizes being too small to provide sufficient data quality for the unemployment rate. These local authorities are: Blaenau Gwent, Bridgend, Ceredigion, Conwy, Flintshire, Gwynedd, Merthyr Tydfil, Monmouthshire, Powys, Rhondda Cynon Taf and the Vale of Glamorgan.
Of the local authorities with sufficient sample sizes, the largest decreases in unemployment rates over the year were seen in Torfaen (down 2.6 percentage points to 3.8%), Pembrokeshire (down 1.8 percentage points to 3.5%) and Cardiff (down 1.4 percentage points to 2.4%). Caerphilly saw the largest increase in the unemployment rate of 1.4 percentage points to 4.3%.

Unemployment data on StatsWales
Economic regions
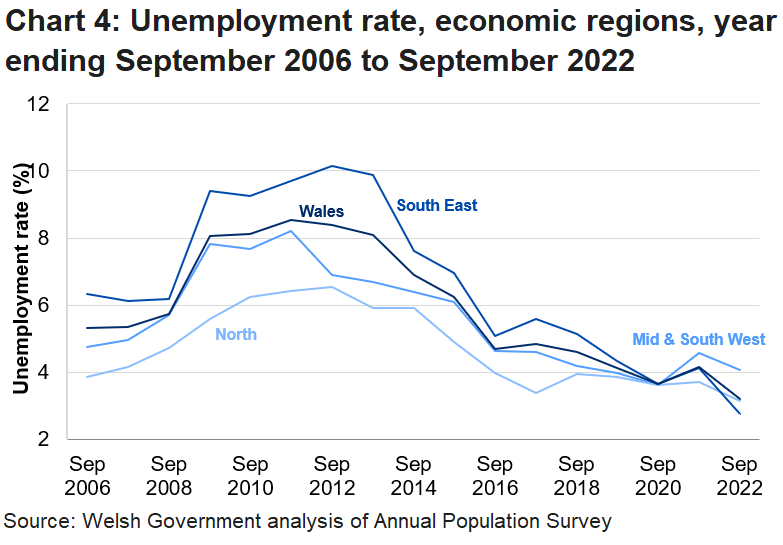
The unemployment rate in Mid & South West Wales was 4.1%, a decrease of 0.5 percentage points, in South East Wales the rate was 2.7%, a decrease of 1.4 percentage points and in North Wales the rate was 3.1% a decrease of 0.5 percentage points (Differences calculated using unrounded figures).
Unemployment data on StatsWales
The overall trend for Wales and the three economic regions across the previous four years saw decreasing unemployment rates before the coronavirus (COVID-19) pandemic, with the rate remaining consistently higher in South East Wales and consistently lower in North Wales compared to the other regions. Since 2020, the unemployment rate for Wales and the three economic regions has diverged, with Mid & South West Wales having the highest rate from 2021 onwards.
Economic inactivity (excluding students)
Economically inactive people are those without a job who have not actively sought work in the last four weeks, and/or are not available to start work in the next two weeks. In this section we have excluded students from the economic inactivity rate, as students are not available for work while studying and will most likely become economically active when their studies are completed.
The economic inactivity rate for people aged 16 to 64 in Wales was 20.2%, this is unchanged compared with the previous year. The UK was 17.8%, up 0.4 percentage points over the year.
The lowest estimated economic inactivity rates were in the Vale of Glamorgan (14.0%), Powys (15.2%) and Flintshire (16.4%).

Economic inactivity data on StatsWales
Economic regions
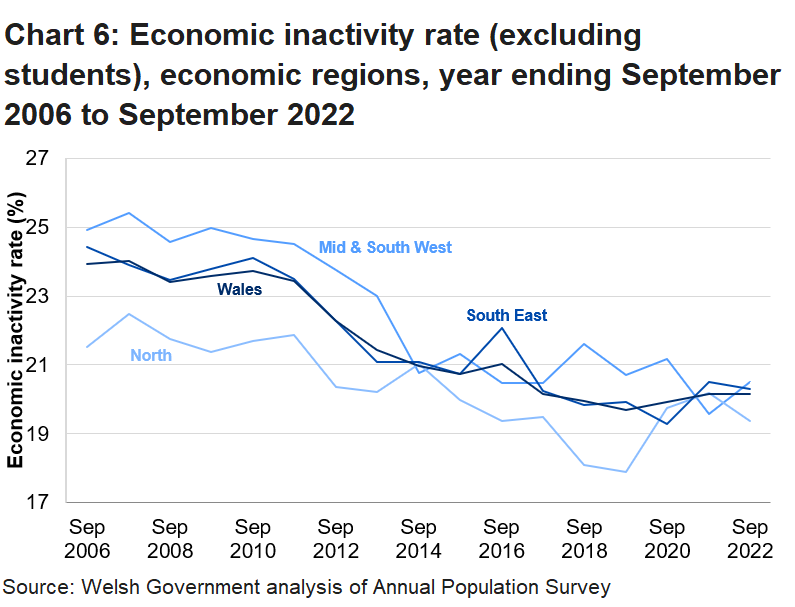
The economic inactivity rate in Mid & South West Wales was 20.5%, an increase of 0.9 percentage points, in South East Wales the rate was 20.3%, a decrease of 0.2 percentage points and in North Wales the rate was 19.4% a decrease of 0.8 percentage points (Differences calculated using unrounded figures).
Economic inactivity data on StatsWales
Over the past four years, North Wales consistently had the lowest economic inactivity rate of all three economic regions until the year ending December 2021, where the rate increased above South East Wales for a number of periods. Mid & South West Wales had the highest rate historically, but has occasionally fallen below other regions in recent periods. Latest data shows Mid & South West Wales once again had the highest economic inactivity rate of the economic regions in the year ending September 2022, with North Wales having the lowest rate.
Reasons for economic inactivity
This section analyses the reasons given for people being economically inactive. The categories for this measure are; Student, Looking after family, Long-term sickness, Temporary sickness, Discouraged, Retired and Other.
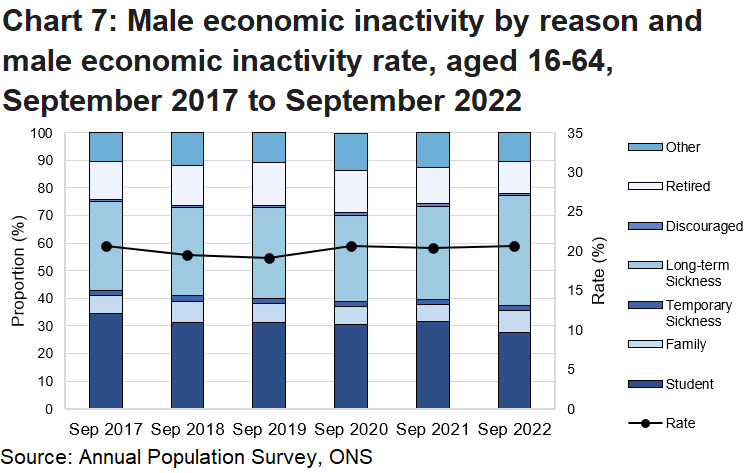
In the year ending September 2022, the most common reason for economic inactivity for men in Wales was long-term sickness, which increased by 6.0 percentage points over the year to 39.9% of all economically inactive males. This was followed by being a student accounting for 27.7% of all economically inactive males, down by 3.9 percentage points from a year earlier.
Economic inactivity data on StatsWales
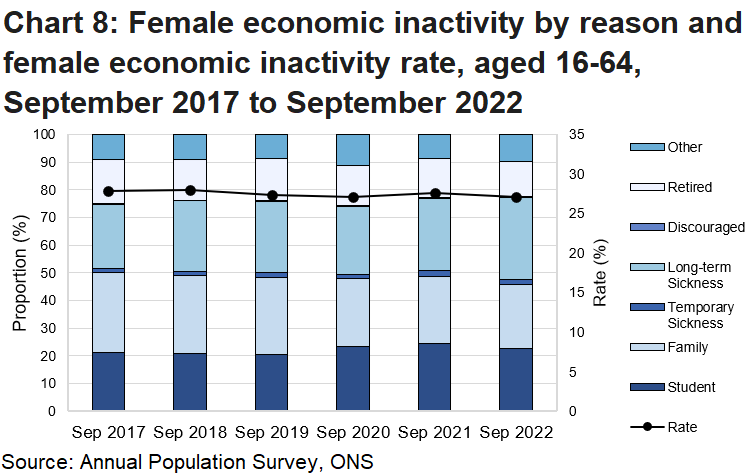
Historically, the most common reason for economic inactivity for women in Wales has been looking after family/home, although the overall trend has been decreasing over time. During 2020, this proportion dropped suddenly, but has started to increase again which could be due to the coronavirus (COVID-19) pandemic, as an opposite trend can be observed for those giving ‘other’ reasons.
In the year ending September 2022, the most common reason for economic inactivity for women in Wales was long-term sickness representing 29.6% of all economically inactive females, up by 3.5 percentage points on the year. The proportion of women who are economically inactive because they are long-term sick is now the highest on record. Over the same period, the proportion of those looking after family / home decreased by 0.9 percentage points, accounting for 23.4% all economically inactive females.
Youth statistics (aged 16 to 24)
Employment
The youth employment rate in Wales in the year ending September 2022 was 54.5%, up 4.8 percentage points compared to the previous year. The UK rate was 53.6%, up 3.0 percentage points compared to the previous year.
The youth employment rate for males increased in Wales by 4.2 percentage points compared to the previous year to 53.9%.
Young females in Wales saw an increase in their employment rate of 5.4 percentage points over the year to 55.1%.

Unemployment
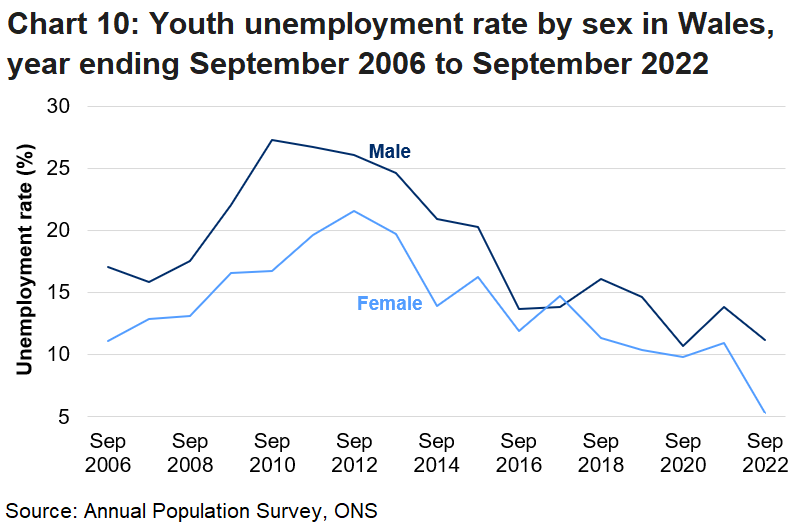
The youth unemployment rate in Wales in the year ending September 2022 was 8.4%, down 4.0 percentage points compared the previous year. The equivalent UK rate was 10.4%, down 2.9 percentage points. The Wales figure for the youth unemployment rate in the year ending September 2022 was the lowest since APS records began in 1996.
The youth unemployment rate for males was higher than females in Wales at 11.2% and 5.3% respectively. This is the lowest female youth unemployment rate in Wales since APS records began in 1996, and a 5.6 percentage point decrease from the previous year.
The difference in youth unemployment between males and females in Wales was 5.9 percentage points in the year ending September 2022, with a higher rate for males than females. This compares to 2.9 percentage points in 2001. The UK gap was 2.8 percentage points, down from 3.1 percentage points in 2001.
Unemployment data on StatsWales
Economic inactivity (excluding students)
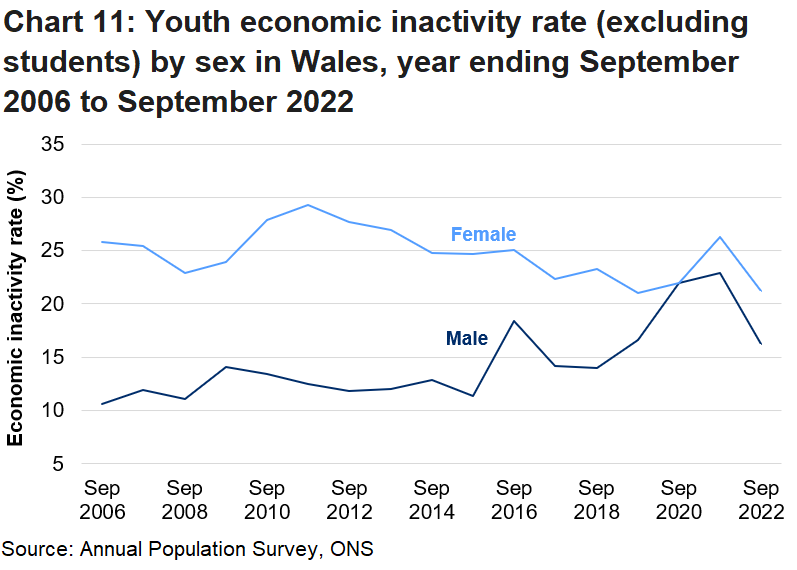
The youth economic inactivity rate in Wales in the year ending September 2022 was 18.5%, down 5.9 percentage points compared to the previous year. The UK rate was 18.5%, up 0.7 percentage points over the year.
The youth economic inactivity rate for males in the year ending September 2022 was 16.3%, a decrease of 6.6 percentage points compared to the previous year, and the rate for females was 21.2%, a decrease by 5.1 percentage points. This series can be volatile and short-term changes should be treated with caution.
Long-term unemployment
In the year ending September 2022, the APS estimates that 14,600 people in Wales were long-term unemployed (12 months or more), down by 32.5% over the year.
This represented 30.2% of all those unemployed in the year, down by 4.2 percentage points over the year. The equivalent UK rate was 26.4%, down by 0.7 percentage points over the year.
The proportion of unemployed males in Wales who had been unemployed for 12 months or more was 34.0%, down 4.7 percentage points over the year. This compares with 30.5% in the UK.
The proportion of unemployed females in Wales who had been unemployed for 12 months or more was 24.8%, down 4.3 percentage points over the year. This compares with 21.7% in the UK.

Disability status
The employment rate for disabled people in Wales was 48.7% in the year ending September 2022, an increase of 1.3 percentage points on the previous year. This compares to a rate of 82.1% for non-disabled people, which increased by 1.5 percentage points over the year.
The unemployment rate for disabled people in Wales was 6.4%, a decrease of 2.1 percentage points on the previous year. This compares to a rate of 2.5% for non-disabled people, which decreased by 0.8 percentage points over the year.
Ethnicity
The employment rate for Black, Asian and minority ethnic people aged 16 to 64 in Wales was 67.2%, a decrease of 1.1 percentage points on the previous year. The employment rate for White people was 73.8%, a 0.8 percentage point increase over the year.
The unemployment rate for Black, Asian and minority ethnic people aged 16 to 64 in Wales was 8.7%, an increase of 1.2 percentage points on the previous year. The unemployment rate for White people was 2.9%, which is the lowest rate since comparable APS records began in 1998, and a 1.2 percentage point decrease over the year.
Quality and methodology information
Relevance
The labour market in Wales can be measured by both the Labour Force Survey (LFS) and the Annual Population Survey (APS). The APS combines the boosted samples of the LFS. It provides rolling four-quarter labour market data for UK countries and regions and also for local areas. The larger sample of the APS allows for estimates at a local authority level and for sub-groups of the population.
The LFS remains the main source for headline labour market indicators at a Wales level, and the data are updated monthly. The latest LFS data is published by the Welsh Government each month in the labour market overview release. This release combines LFS data with other data sources (including the APS) to provide a more detailed commentary on the labour market in Wales. ONS also publish a monthly labour market overview (Office for National Statistics) release which provides an overview of the labour market for the UK as a whole and an additional release which provides an overview of the labour market across the regions and countries of the UK (Office for National Statistics).
This release brings together the latest key APS statistics relating to the Welsh labour market with a more detailed commentary on the regions in Wales and the protected characteristics of people within the Welsh labour market.
The statistics in this release are used by the Welsh Government to monitor the headline statistics for the Welsh labour market as well as providing comparisons to the UK labour market. This release is also used to monitor progress against some of the targets in Welsh Government’s Employability Plan. The release complements the Welsh Economy in Numbers dashboard, which provides a broad picture of the Welsh economy and labour market.
This release is used by other public sector organisations, businesses, academia and private individuals as a means of identifying the key trends in the headline economic and labour market statistics for Wales. Our 2012 user consultation provides more information on how our outputs are used.
The Welsh Government is considering how best to meet user need for analysis of the labour market by protected characteristics. Data is currently available on StatsWales and Nomis.
Accuracy
The data presented in this release is based on sample surveys, therefore is subject to sampling variability. This means the data is subject to differing degrees of sampling variability, i.e., the true value for any measure lies in a differing range about the estimated value. This range or sampling variability increases as the detail in the data increases, for example individual local authority data are subject to higher variability than Wales data.
Estimates of employment, unemployment and economic inactivity are available from both the Labour Force Survey (LFS) and the APS. Estimates from the LFS are based on a rolling quarter and are updated monthly. LFS sample sizes are too low to produce reliable estimates for geographies below Wales level. Estimates from the APS are based on a rolling twelve months, updated each quarter. The APS uses a bigger sample than the LFS so is used to produce estimates for geographies in Wales. At Wales level, the APS is a slightly more robust measure than the LFS, but it is less timely and slower to adapt to changes in the labour market.
On 13 September 2022, ONS published a reweighted APS dataset for March 2020 onwards. This was due to a planned reweight (using updated Pay As You Earn (PAYE) Real Time Information (RTI) data) as well as to correct an error affecting grossing factors for some age groups for the annual periods between April 2019 to March 2020 and July 2020 to June 2021.
Glossary
Employment
People aged 16 to 64 who did at least one hour of paid work in the reference week (whether as an employee or self-employed); those who had a paid job that they were temporarily away from; those on government-supported training and employee programmes and those doing unpaid family work.
The headline employment rate is calculated by dividing the employment level for those aged from 16 to 64 by the population for that age group.
Unemployment
The number of unemployed people in the UK is measured through the Labour Force Survey (LFS) following the internationally agreed definition recommended by the International Labour Organisation (ILO) – an agency of the United Nations. Unemployed people are without a job, have actively sought work in the last four weeks and are available to start work in the next two weeks; or are out of work, have found a job and are waiting to start it in the next two weeks.
The headline unemployment rate is calculated by dividing the unemployment level for those aged 16 and over by the total number of economically active people aged 16 and over.
Economic inactivity
Economically inactive people are those without a job who have not actively sought work in the last four weeks, and/or are not available to start work in the next two weeks.
The headline inactivity rate is calculated by dividing the inactivity level for those aged from 16 to 64 by the population for that age group.
National Statistics status
The United Kingdom Statistics Authority has designated these statistics as National Statistics, in accordance with the Statistics and Registration Service Act 2007 and signifying compliance with the Code of Practice for Statistics.
National Statistics status means that official statistics meet the highest standards of trustworthiness, quality and public value.
All official statistics should comply with all aspects of the Code of Practice for Statistics. They are awarded National Statistics status following an assessment by the UK Statistics Authority’s regulatory arm. The Authority considers whether the statistics meet the highest standards of Code compliance, including the value they add to public decisions and debate.
It is Welsh Government’s responsibility to maintain compliance with the standards expected of National Statistics. If we become concerned about whether these statistics are still meeting the appropriate standards, we will discuss any concerns with the Authority promptly. National Statistics status can be removed at any point when the highest standards are not maintained, and reinstated when standards are restored.
The continued designation of these statistics as National Statistics was confirmed in March 2010 following a compliance check by the Office for Statistics Regulation. These statistics last underwent a full assessment against the Code of Practice in March 2010.
Since the latest review by the Office for Statistics Regulation, we have continued to comply with the Code of Practice for Statistics, and have made the following improvements:
- Changed to a HTML release for increased interactivity and increased accessibility for users.
- Expanded the coverage of topics to include more detail about the headline labour market statistics, and added sections on youth employment and long-term unemployment.
- Introduced a new section on the labour market by different protected characteristics.
- Added charts which allow users to clearly see any trends and volatility in the data.
Well-being of Future Generations Act (WFG)
The Well-being of Future Generations Act 2015 is about improving the social, economic, environmental and cultural wellbeing of Wales. The Act puts in place seven wellbeing goals for Wales. These are for a more equal, prosperous, resilient, healthier and globally responsible Wales, with cohesive communities and a vibrant culture and thriving Welsh language. Under section (10)(1) of the Act, the Welsh Ministers must (a) publish indicators (“national indicators”) that must be applied for the purpose of measuring progress towards the achievement of the wellbeing goals, and (b) lay a copy of the national indicators before Senedd Cymru. Under section 10(8) of the Well-being of Future Generations Act, where the Welsh Ministers revise the national indicators, they must as soon as reasonably practicable (a) publish the indicators as revised and (b) lay a copy of them before the Senedd. These national indicators were laid before the Senedd in 2021. The indicators laid on 14 December 2021 replace the set laid on 16 March 2016 and this releases includes the following national indicator:
- (21) percentage of people in employment
Information on the indicators, along with narratives for each of the wellbeing goals and associated technical information is available in the Wellbeing of Wales report.
This release includes, contextual indicators, namely the basket of indicators, presented in the wellbeing report.
As a national indicator under the Act they must be referred to in the analyses of local wellbeing produced by public services boards when they are analysing the state of economic, social, environmental and cultural wellbeing in their areas.
Further information on the Well-being of Future Generations (Wales) Act 2015.
The statistics included in this release could also provide supporting narrative to the national indicators and be used by public services boards in relation to their local wellbeing assessments and local wellbeing plans.