
Data used in Welsh Revenue Authority performance reporting 2025 to 2026
The Welsh Revenue Authority’s performance measures. Provides transparency to the underlying data in the performance report within our annual report and accounts.
In this page
Introduction
The Welsh Revenue Authority (WRA) published its annual report and accounts for 2025 to 2026 on 15 July 2026. This includes a section on the organisation’s performance during the financial year (the ’performance overview’). This is based on the WRA’s first year of delivery against our 2025 to 2028 Corporate Plan.
Multiple charts are used in this data annex, presenting data for each of the WRA’s performance measures for the 2025 to 2026 period. While these performance measures are referenced in the report, most of the detailed information is omitted. Therefore, this report provides a more comprehensive view of the WRA’s performance data, making the underlying data sets fully accessible for further reference or analysis by interested parties.
The indicators presented in this data annex align with the strategic objectives in our 2025 to 2028 Corporate Plan. As defined in the corporate plan, the measures fall under the Easy, Fair or Sustainable strategic objectives and relate to either or both of our tax service and our payments service. Many of the indicators have changed this year. Details of previous indicators and discontinued charts can be found in the 2024 to 2025 data annex.
For data visualisation purposes, it’s sometimes more effective to display reverse values of the WRA’s performance indicators. For example, the percentage of transactions paid correctly first time is close to 100%, making any variation difficult to see on a zero to 100% scale in a static image. Rather than using a 90% to 100% scale, which would exaggerate the variation, this report presents the percentage of transactions not paid correctly first time, using a scale of zero to 10%. Where this technique is applied, data for both the reverse measure and the actual measure is available in the accompanying spreadsheet.
This report includes concise analysis of each measure. Readers may wish to consider this alongside the overall narrative and context presented in the performance report.
Most analysis below relates to Land Transaction Tax (LTT), although Landfill Disposals Tax (LDT) data are also included where relevant. For further details see Land Transaction Tax and Landfill Disposals Tax.
Data
Chart 1: Number of responses to our feedback forms and proportion of responses that said our services were easy to use, by quarter
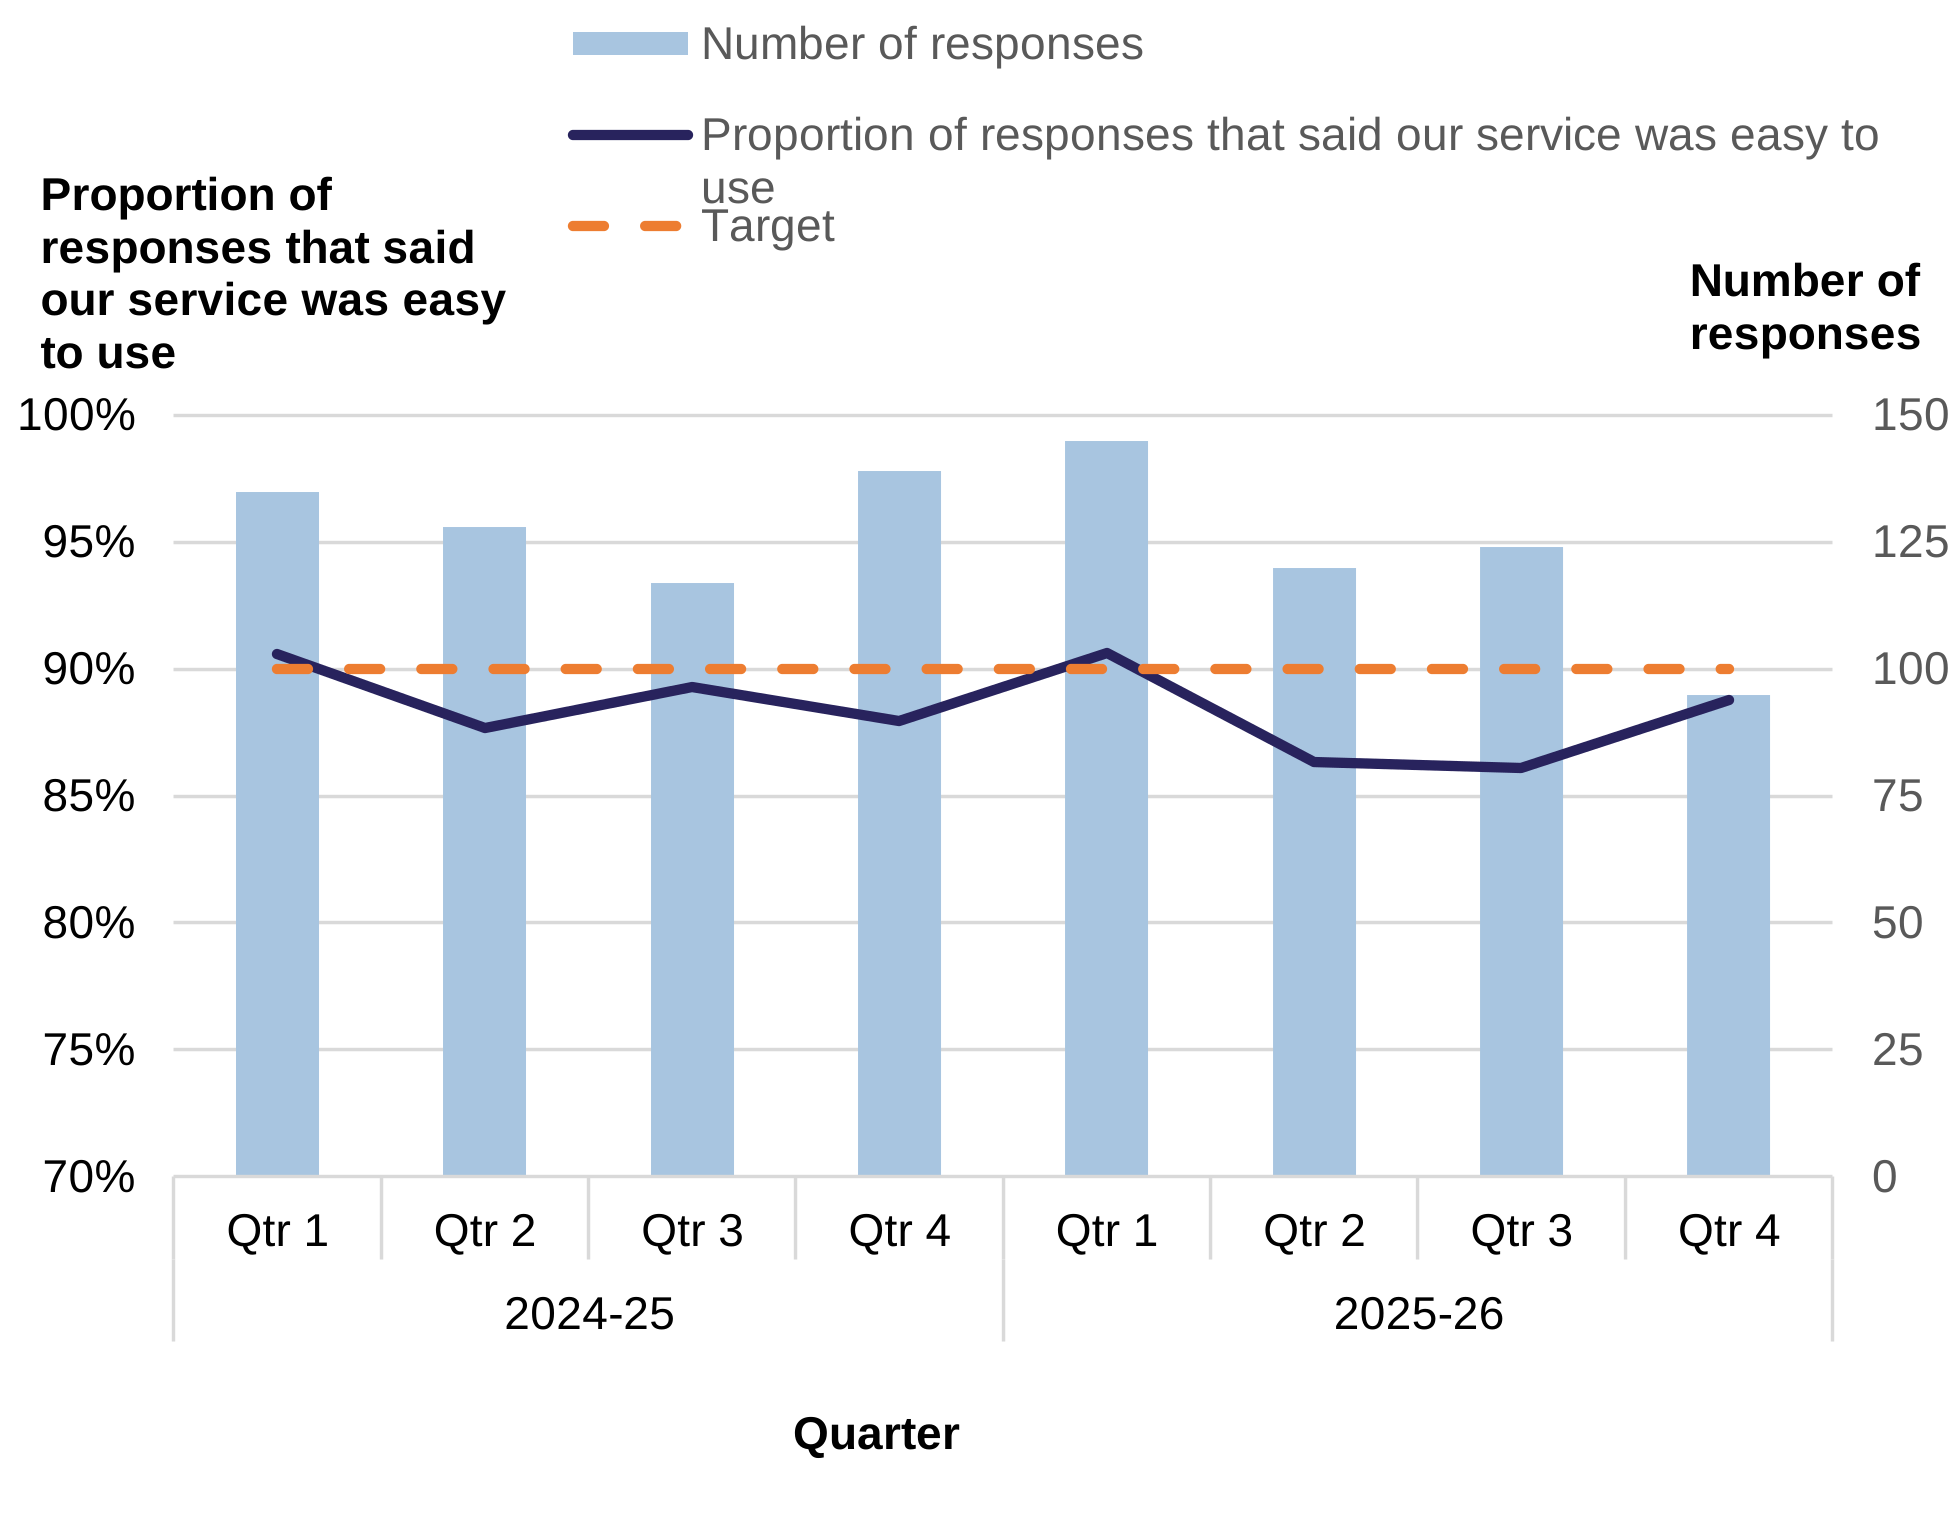
This chart falls under the ‘Easy’ strategic objective and relates to both the tax service and the payment service.
After using our services, users are asked to fill out a feedback form. They are asked whether they found our services easy or difficult to use. The WRA has a performance target that 90% of survey respondents report that our services are easy to use.
Chart 1 shows the quarterly percentage of responses in our feedback survey that said our service was easy to use throughout 2024 to 2025 and 2025 to 2026, using a scale of 70% to 100%, which slightly exaggerates the amount of change. It also displays bars showing the number of responses received each quarter, scaled from zero to 150. The 90% target is shown by the dotted line.
Chart 1 shows a 0.9% downturn from 88.9% to 88% in the number of responses in 2025 to 2026 when compared to 2024 to 2025, though the number of responses did peak in quarter 1 of 2025 to 2026. The proportion of responses that said our service was easy to use was generally slightly below the target but peaked in quarter 1 of both 2024 to 2025 and 2025 to 2026, going above 90% on each occasion.
Chart 2: The average number of days taken to close cases in the Customer Relationship Management (CRM) system, by case closed month
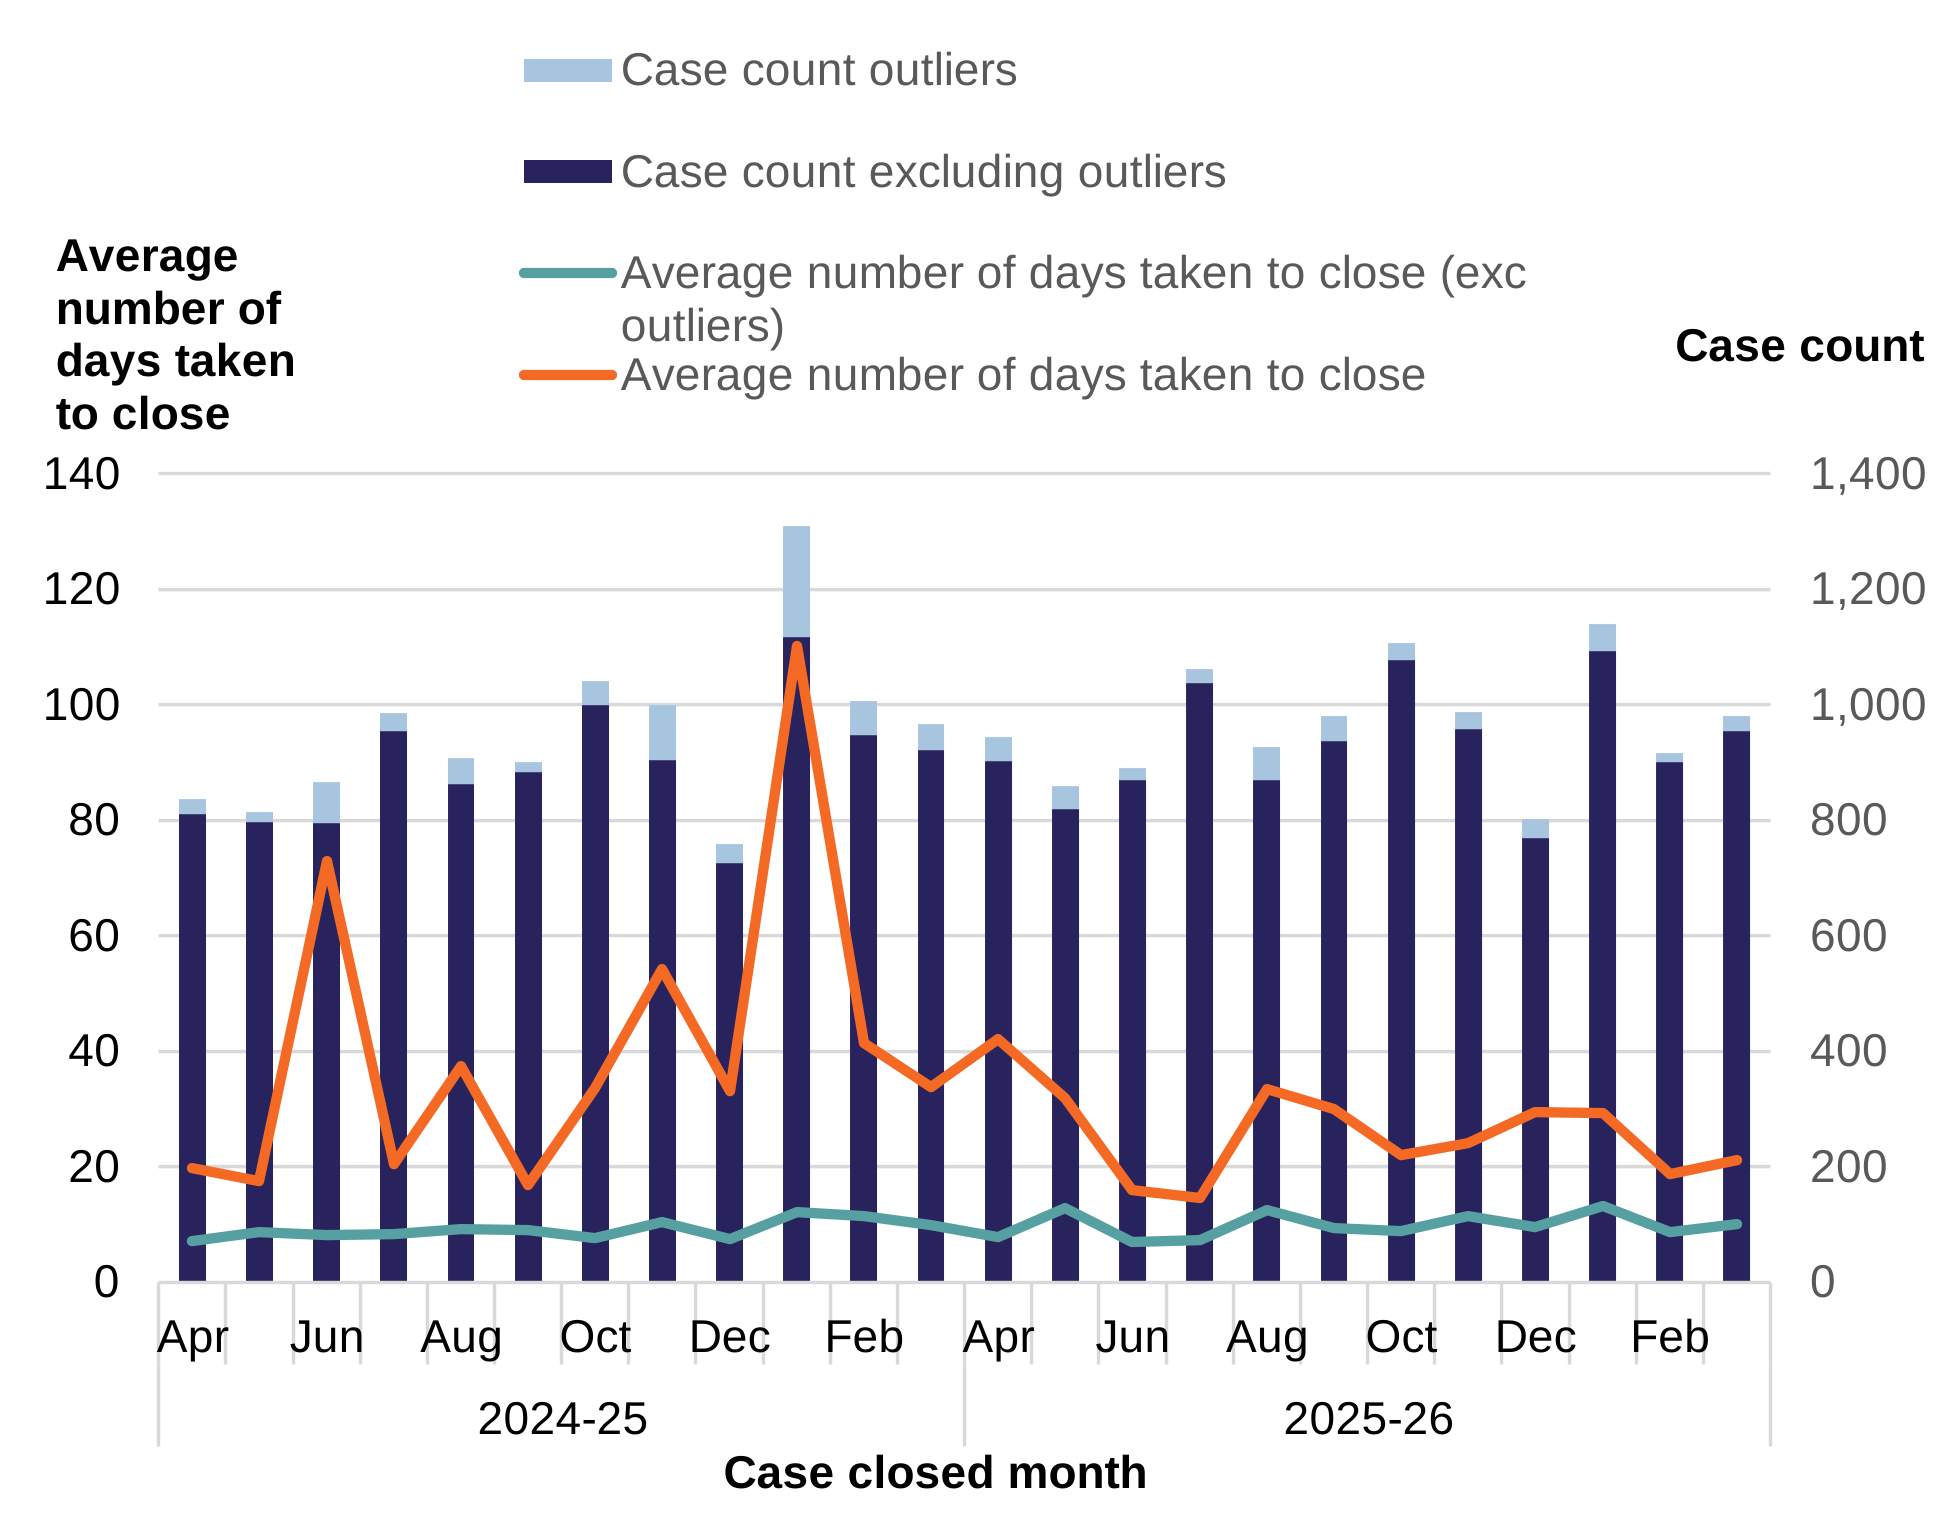
This chart falls under the ‘Easy’ strategic objective and relates to both the tax service and the payment service.
CRM is a system used within the WRA where a CRM case refers to responding to queries made by taxpayers and their representatives (or agents) or the public. This will include cases related to many of the concepts that are covered in other indicators, such as higher rate refund claims but it might also include queries that the WRA raises with taxpayers including those related to investigating potentially risky transactions.
Chart 2 shows the monthly average for the number of days taken to close a CRM case, including and excluding outliers, throughout 2024 to 2025 and 2025 to 2026. The chart uses a scale of zero to 140 days. It also displays bars showing the number of cases closed each month, including and excluding outliers, scaled from zero to 1,400.
Chart 2 shows seasonal decreases in the number of cases closed around the Christmas period in both years. This is followed by a peak in the number of cases closed in the following month. The average number of days taken to close increases during the Christmas period and decreases in the months following. This is visible to a greater extent in 2024 to 2025 than 2025 to 2026. The average number of days taken to close is more stable when excluding outliers.
Chart 3a: Number of and average days to pay LTT higher rate refunds, by month of request
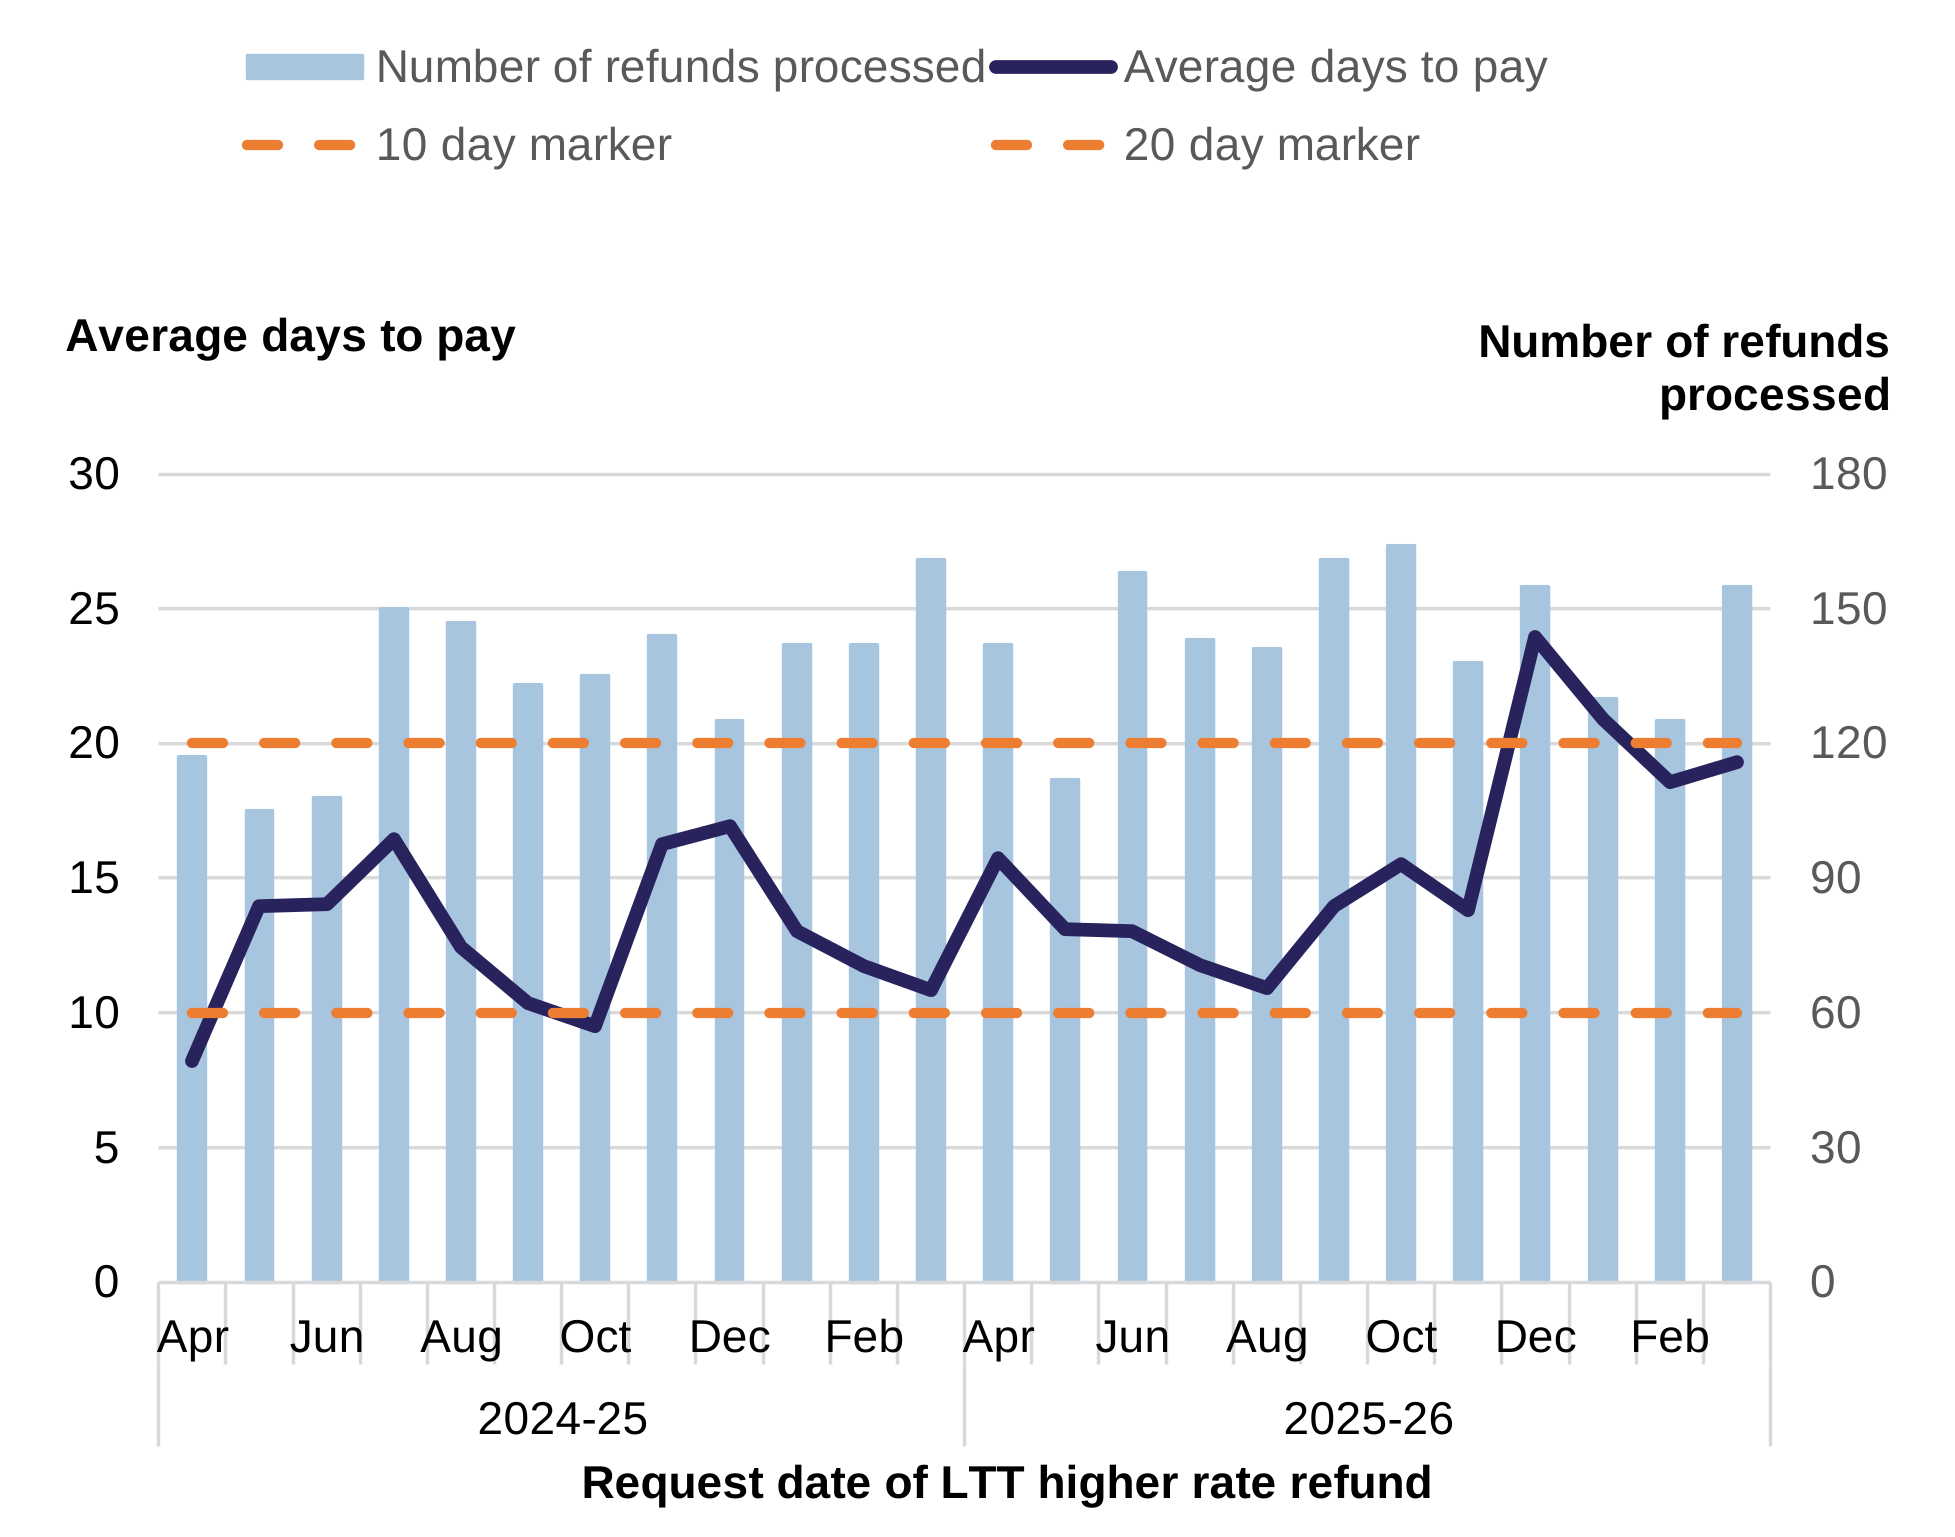
This chart falls under the ‘Easy’ strategic objective and relates to the tax service.
When a taxpayer purchases a new main residence without simultaneously selling their former main residence, they become liable for the higher rate of residential LTT. Those who sell their former main residence within 3 years are usually eligible for a refund of the difference between the higher and main rates of LTT on the original transaction.
The WRA aims to process these higher rate refunds as promptly as possible, with a goal of having an average time of no longer than 10 days to process a higher rate refund case.
Chart 3a shows the monthly time taken to pay for higher rate refunds throughout 2024 to 2025 and 2025 to 2026, using a scale of zero to 30 days. It also displays bars showing the number of refunds processed each month, scaled from zero to 180. The 10-day target and a 20-day reference point are both shown by dotted lines.
Chart 3a shows that the volume of higher rate refunds has increased in 2025 to 2026 when compared to 2024 to 2025. Seasonal peaks in the average number of days to pay occurred around Christmas in both years, followed by a return to the previous levels after. However, the peak for 2025 to 2026 was larger than the previous year and consequently the measure had not returned to previous levels by the end of the year.
Chart 3b: The number of LTT higher rate refunds and proportion processed within 10 and 20 days, by month of request
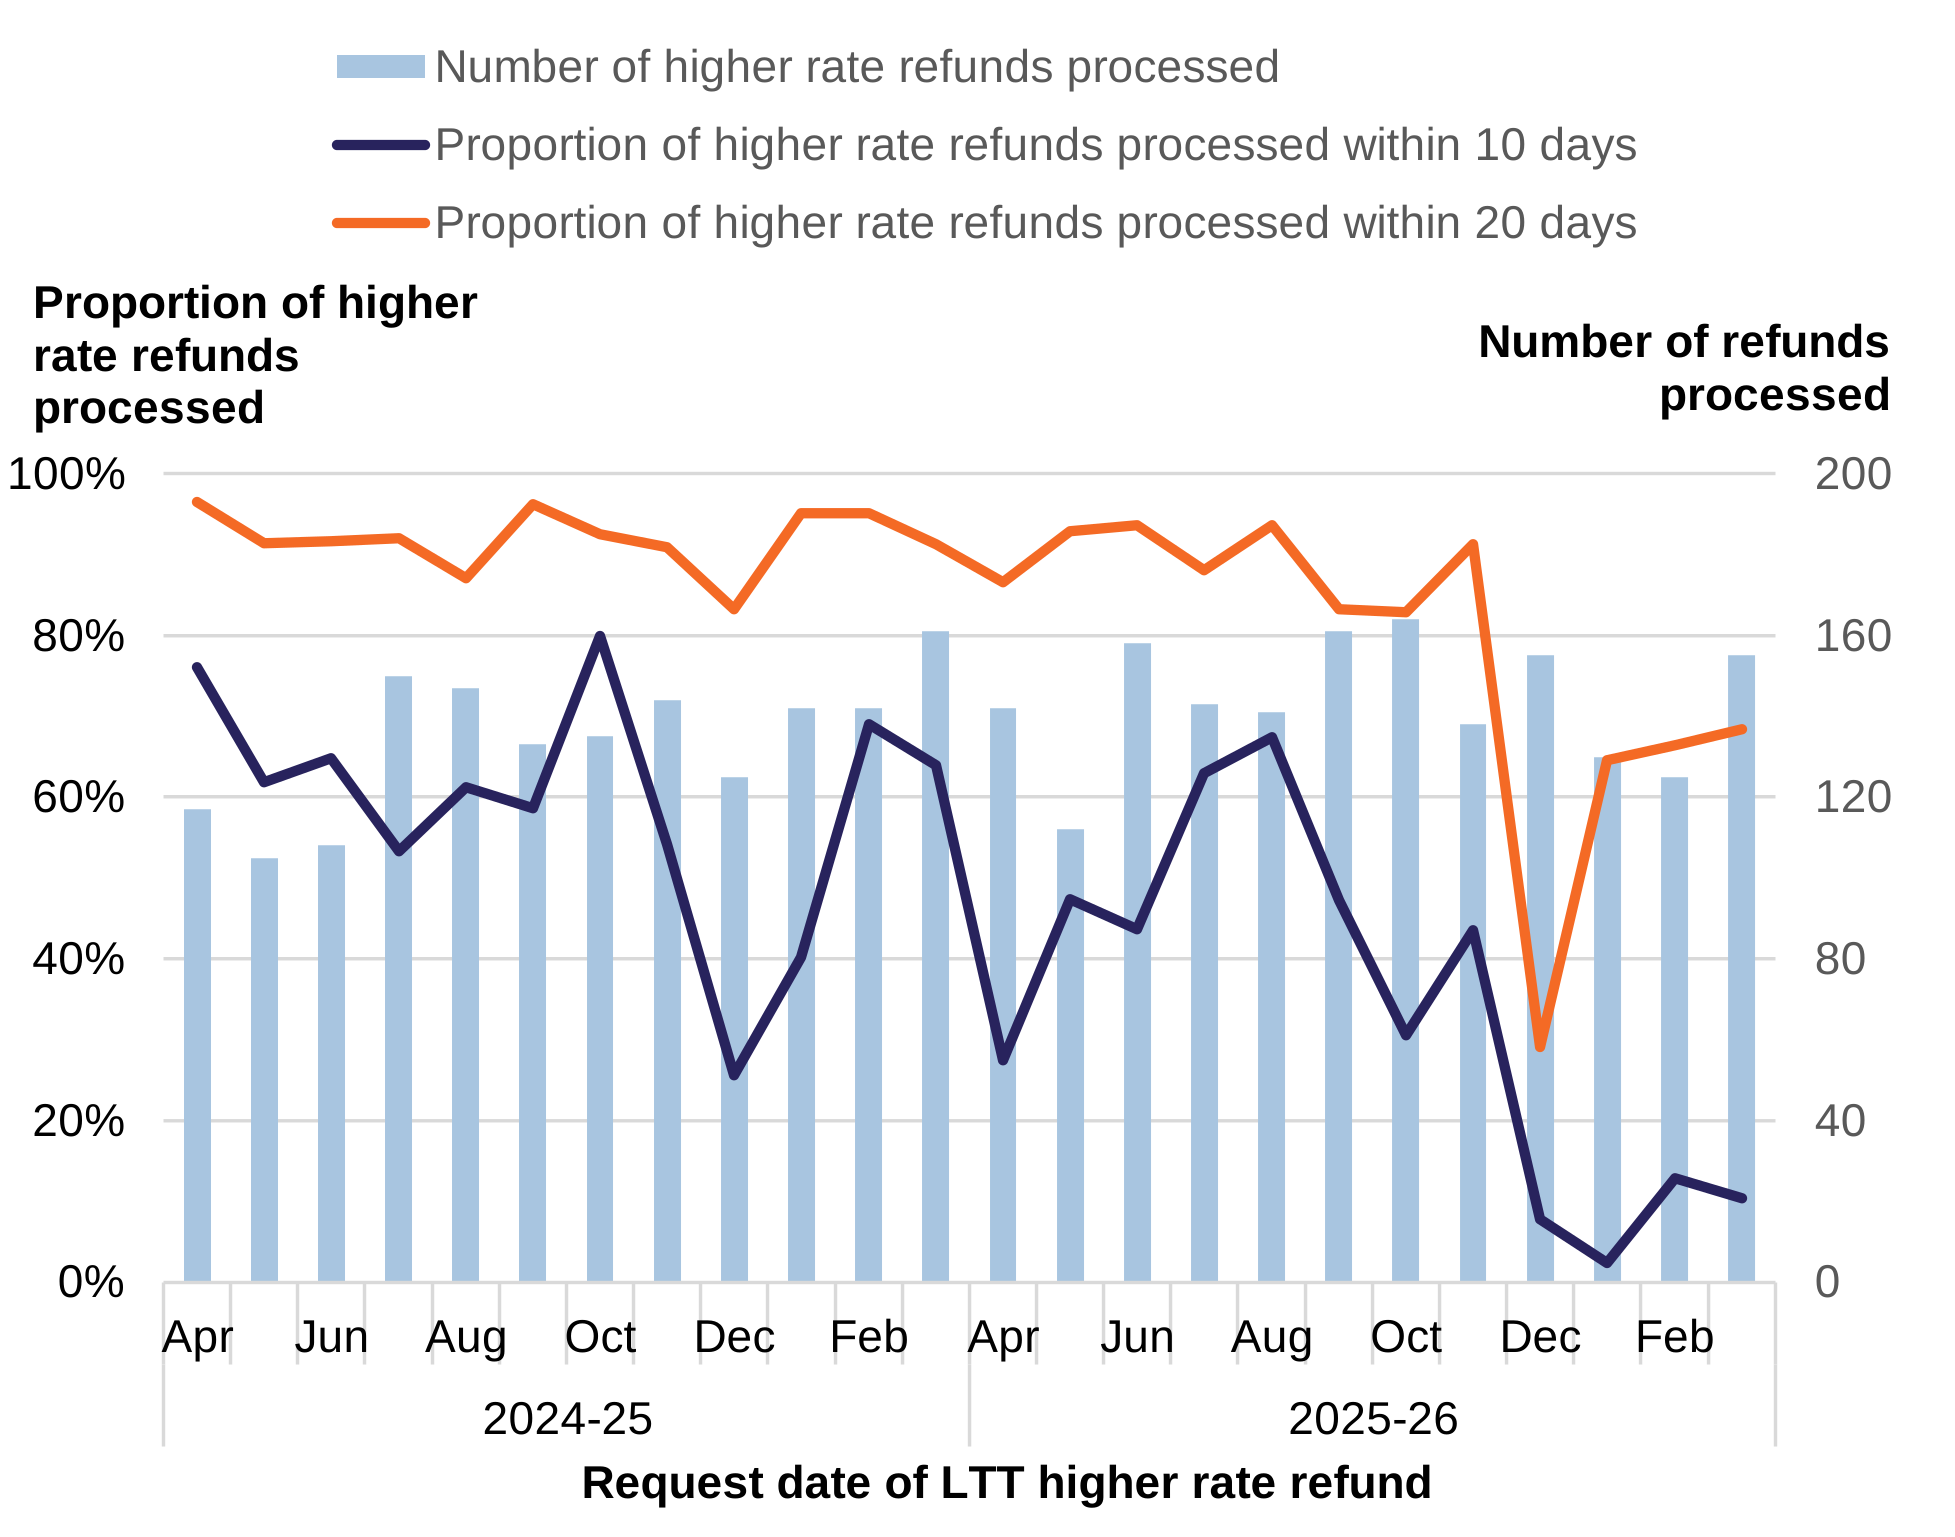
This chart falls under the ‘Easy’ strategic objective and relates to the tax service. The chart provides more context for the WRA’s target of having an average time of no longer than 10 days to process a higher rate refund case.
Chart 3b shows the monthly proportion of higher rate refunds processed within 10 and 20 days throughout 2024 to 2025 and 2025 to 2026. It also displays bars showing the number of refunds processed each month, scaled from zero to 200. The lines representing proportion are scaled from zero to 100%.
Chart 3b shows that there are seasonal decreases in the proportion of higher rate refunds processed within 10 days and, while less variable, a similar pattern can be seen in the proportion processed within 20 days.
The decrease for 2025 to 2026 was larger than the previous year and by the end of year had not returned to previous levels. However, we can see that there has been an improvement in this latter period in the 20-day measure. The measure is included to show that cases are mainly being managed in the 10 to 20 days period. This is largely due to minor staffing challenges resulting in a build-up of outstanding cases in the lead up to Christmas 2025. Although these challenges have since been resolved, the backlog is continuing to influence these indicators and will be tracked both internally and in next year’s report.
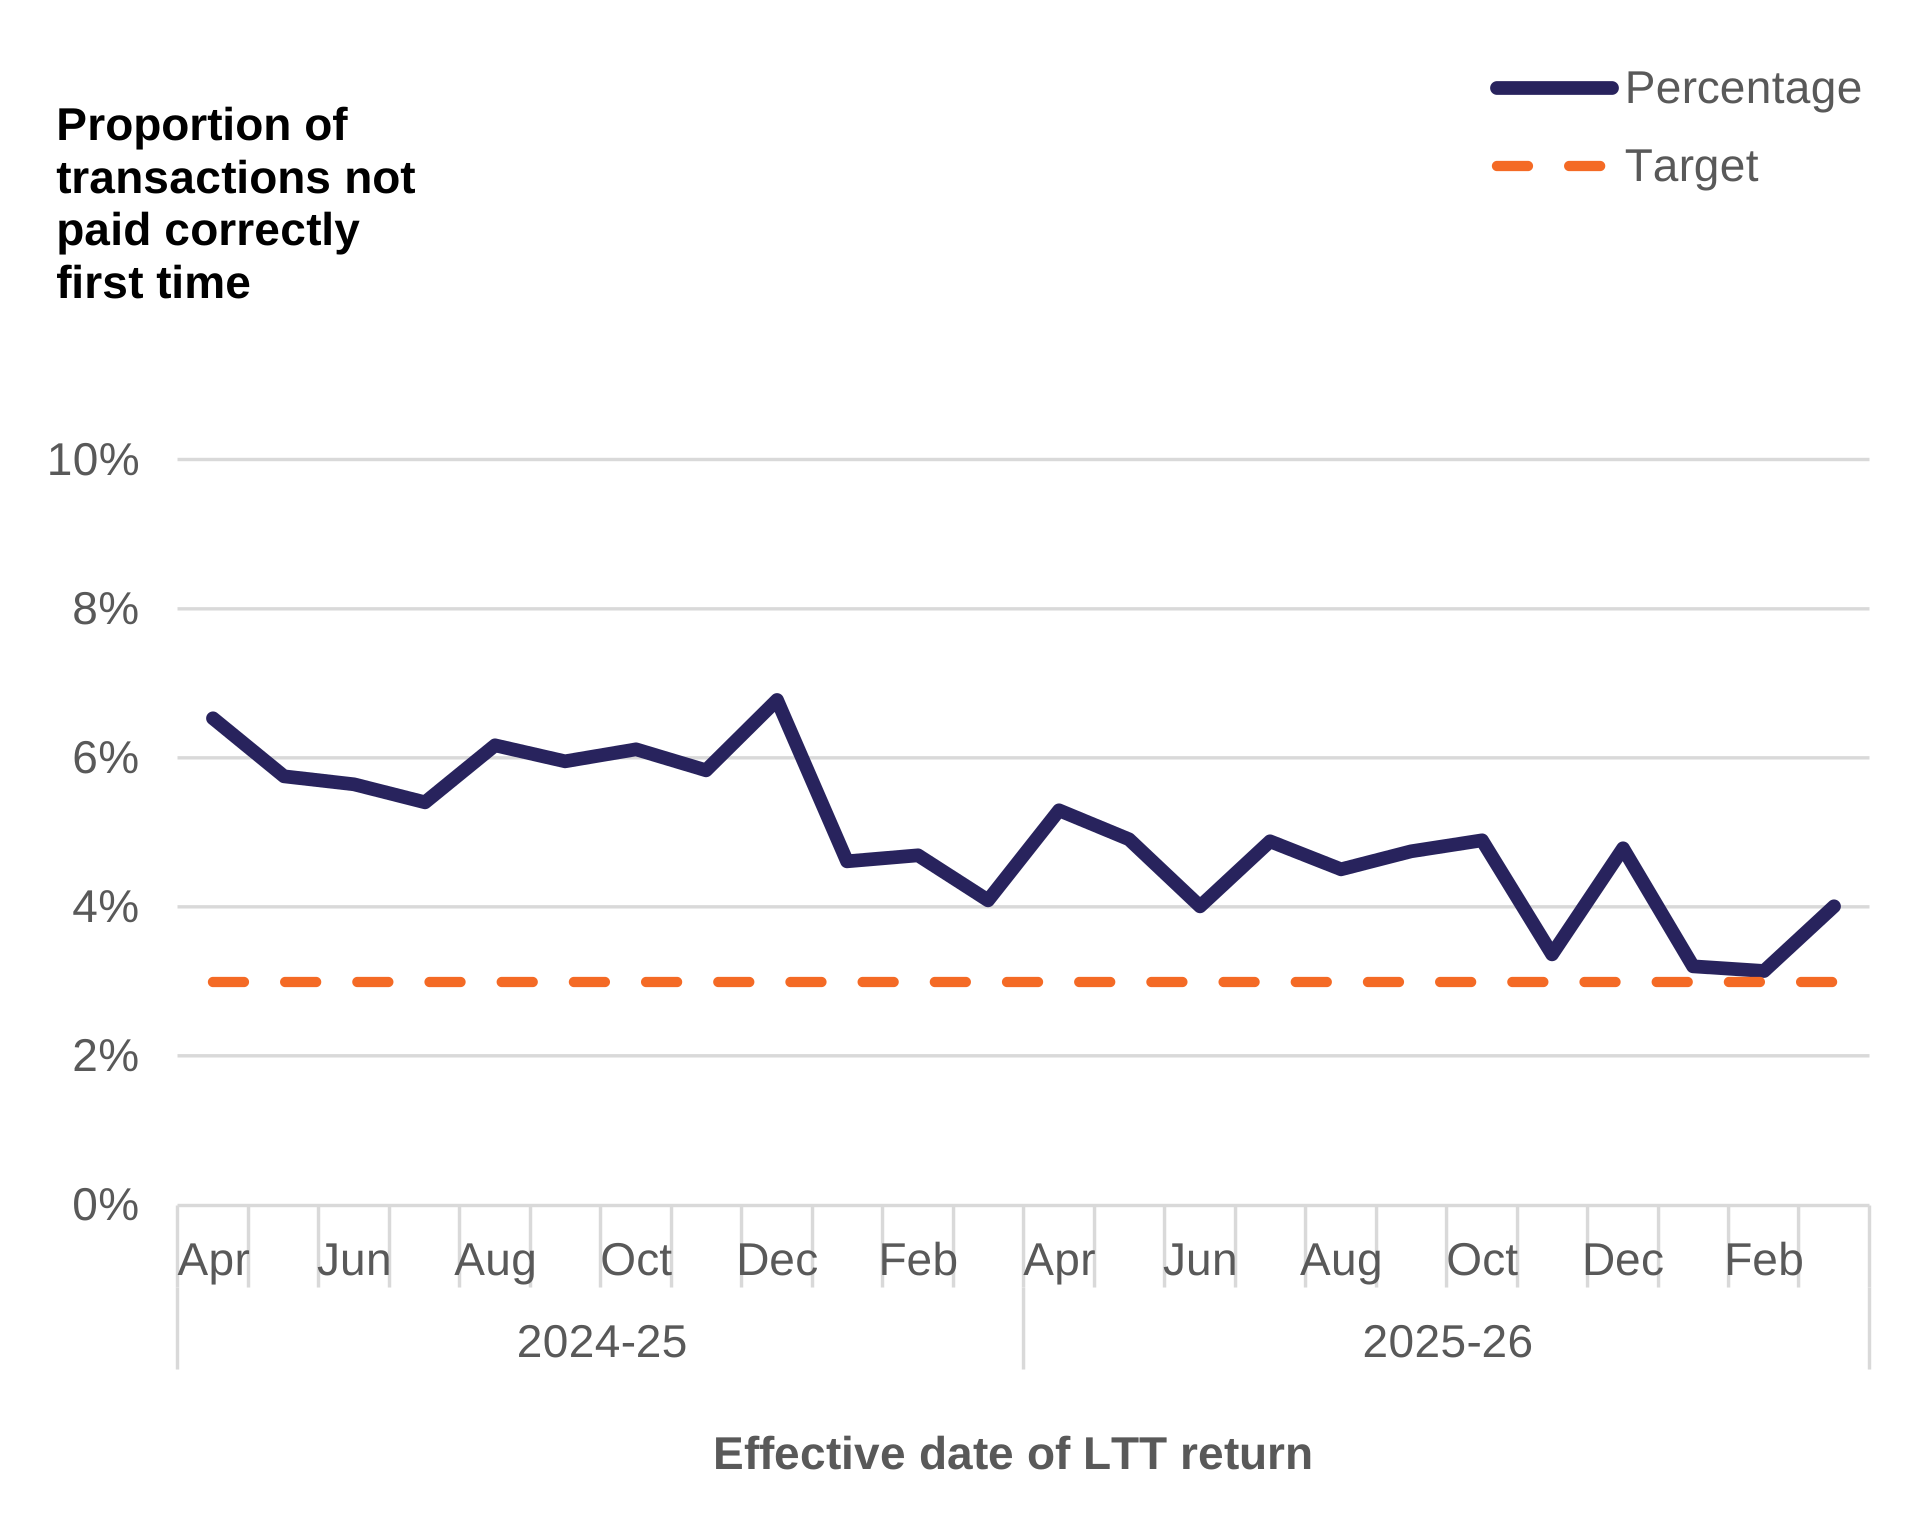
Chart 4: Percentage of transactions not paid correctly first time, by effective month
This chart falls under the ‘Easy’ strategic objective and relates to the payment service.
The WRA aims to capture information about how easy it is to use our services, with 1 measure for this being the percentage of transactions paid correctly first time. The WRA has a performance target of 97% for LTT returns paid correctly first time.
We interpret this measure as transactions paid in full in a single payment and we exclude transactions where amendments to the tax due have been made. This is because any amendments could cause multiple payments to be made but for a reason unrelated to the ease of use of our services.
Chart 4 uses the reverse technique explained in the introduction. It shows how the percentage of transactions effective in each month and not paid correctly the first time has changed over 2024 to 2025 and 2025 to 2026, using a scale of zero to 10%. The reverse target for the percentage of transactions not paid correctly first time is also displayed by the dotted line at 3%.
The chart shows that the percentage of transactions not paid correctly the first time has decreased steadily over the last 2 years and the target for the measure was met in January and February 2026.
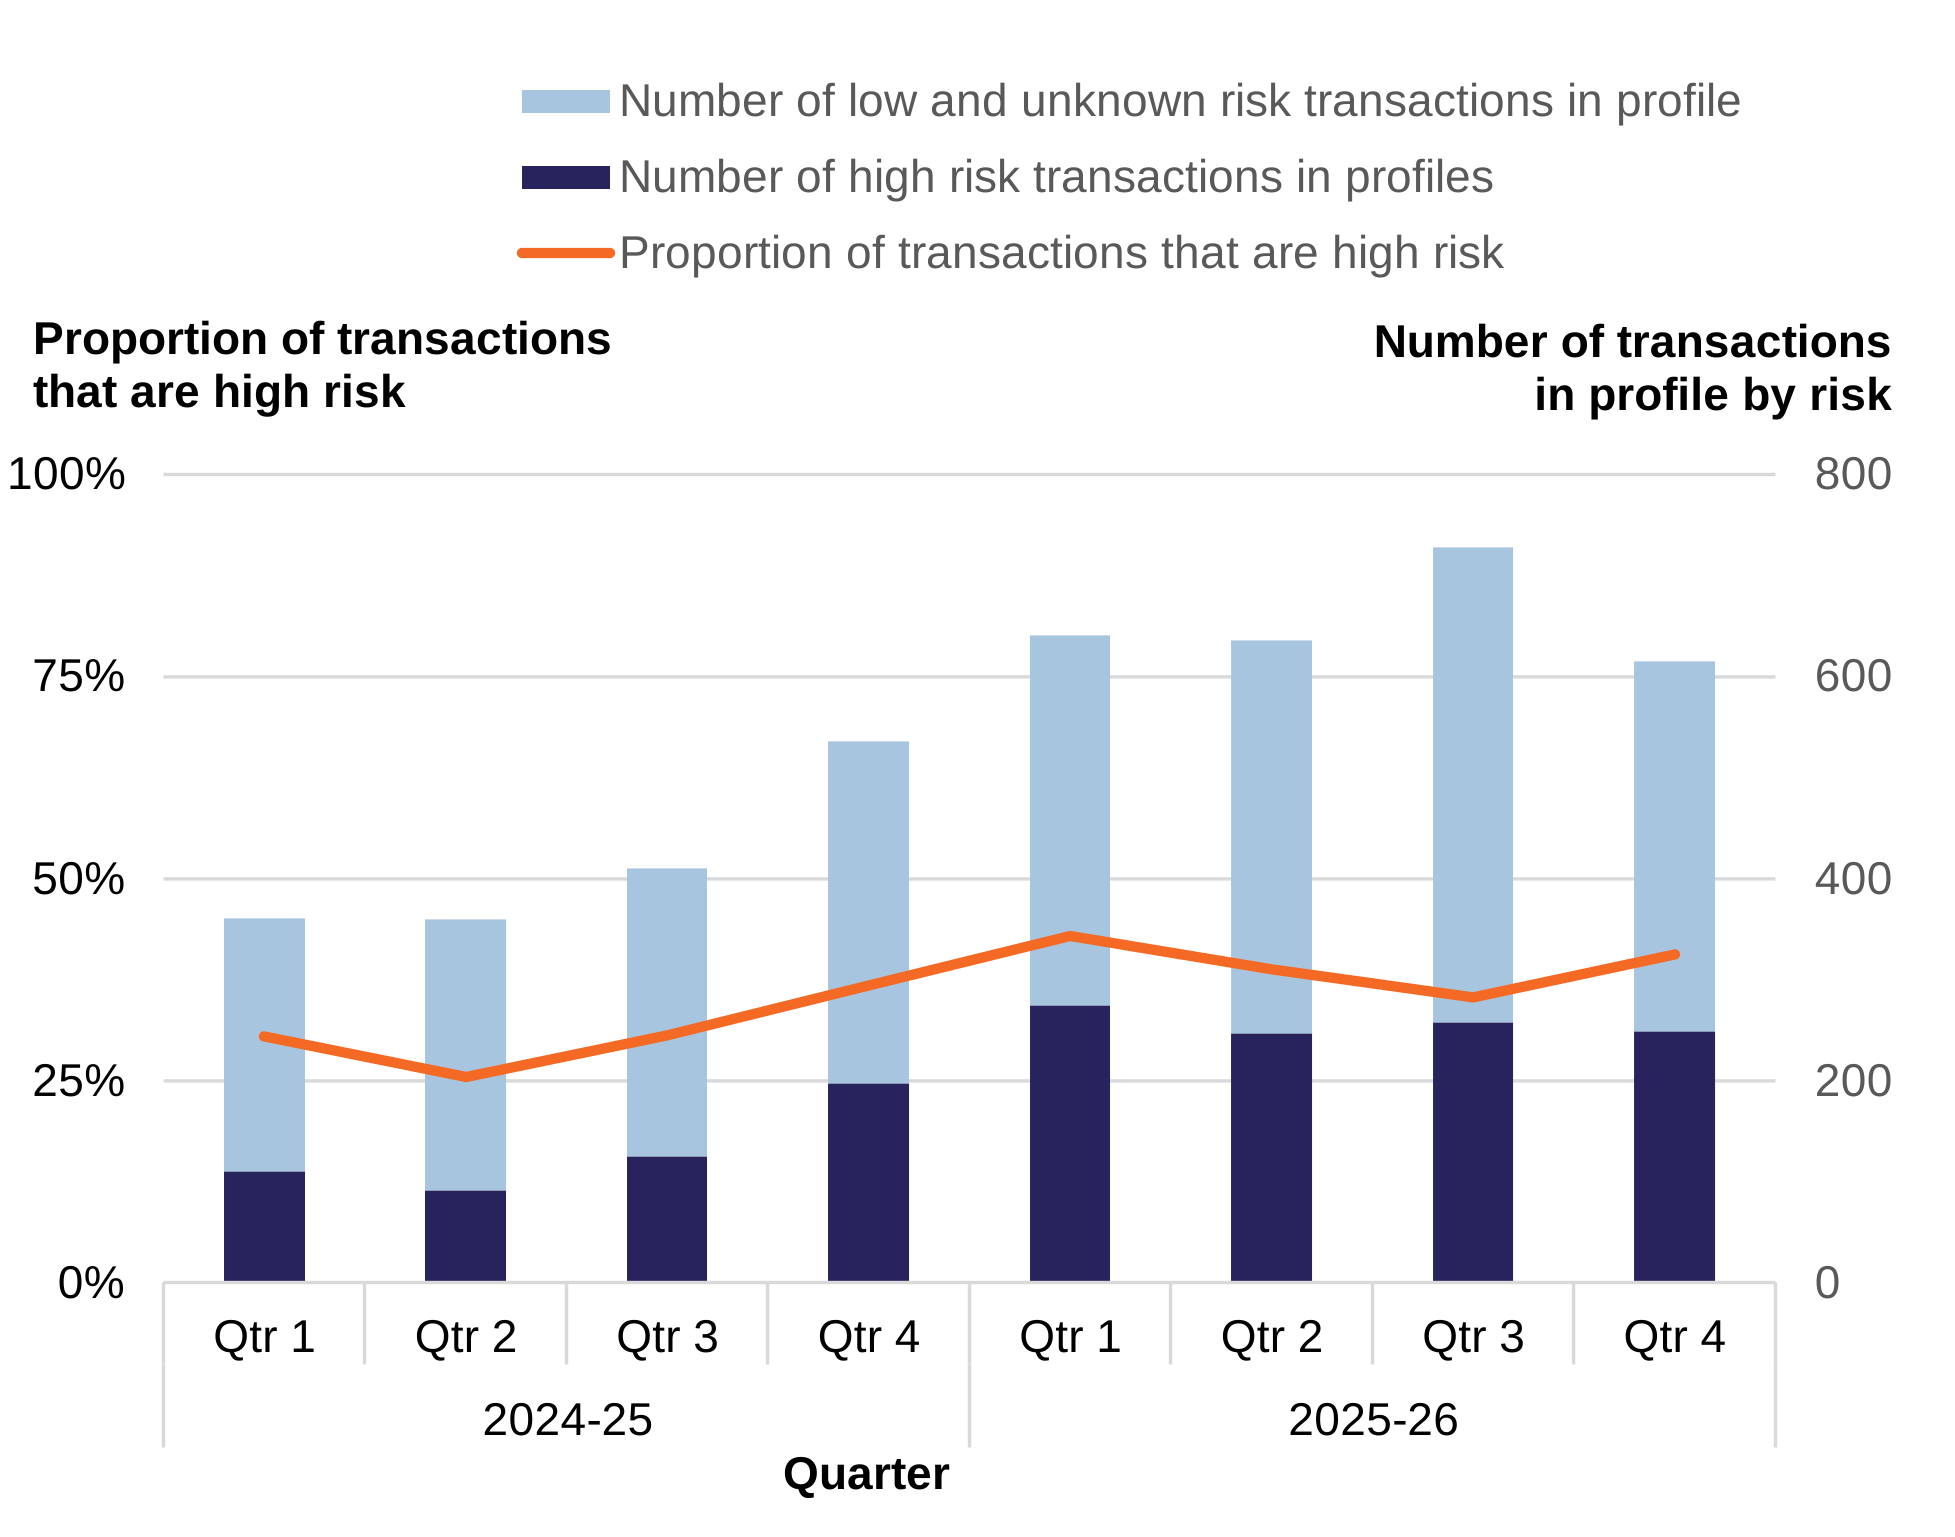
Chart 5: Number of LTT transactions in tax risk profiles and proportion of those transactions that are high risk, by quarter
This chart falls under the ‘Fair’ strategic objective and relates to the tax service.
The WRA conducts detailed analysis of data for each transaction to identify characteristics that may indicate potential errors or risks in the submitted information. This could lead to taxpayers paying the wrong amount of tax and we call these ‘tax risks’. Each identified tax risk undergoes separate analysis to determine the number of affected transactions, enabling tracking over time. We refer to the individual tax risks as ‘tax risk profiles’.
Throughout 2025 to 2026, there have been some changes in the processes related to risking individual transactions. For example, the tax risk team are now making more preliminary enquiries with taxpayers and their representatives (or agents). Their responses are assessed as part of initially establishing the risk, rather than moving straight into more detailed enquiries. There have also been improvements relating to the identification of transactions.
Chart 5 shows the quarterly proportion of transactions in risk profiles that are identified as high risk throughout 2024 to 2025 and 2025 to 2026, using a scale of zero to 100%. It also displays bars showing the number of transactions in risk profiles each quarter. The bars are split between high risk and low or unknown risk, scaled from zero to 800.
Chart 5 shows that the number of transactions in profiles have generally tracked on an upward trajectory over the 2-year period, with a greater proportion of transactions that are high risk in 2025 to 2026 than in 2024 to 2025. The proportion peaked at 45% in quarter 1 of 2025 to 2026. In the main, this is due to the identification of additional types of LTT tax risk, to which the WRA have allocated extra resources from additional funding agreed with the Welsh Government.
Although the most recent quarter had a decrease in the number of high-risk cases, this is likely to be partly due to lower numbers of transactions at that time, and partly to the changes outlined above. As the number of low or unknown risk cases fell by a larger amount, the proportion of transactions that were high risk increased to near the peak seen in quarter 1.
Commentary on the amount of tax recovered
The WRA has a performance aim to carry out tax recovery proportionate to the risk levels. As an example of what we mean by this, when a new risk is identified, initially there may be higher numbers of cases in the new risk profile (and potentially more tax which could be recovered). As mitigation activities are identified and put into practice, such as engaging with taxpayers and their representatives (or agents) about the specific risk, future numbers of new cases and potential tax to be recovered might reduce. This represents the most positive outcome as the tax is being collected without the need for investigations.
Consistent with the above chart showing both increasing cases and accuracy within our tax risk profiles, total tax recovery for LTT rose to £4.6m in 2025 to 2026, a significant increase from just over £2m collected in 2024 to 2025. Also, in 2025 to 2026, a further £0.5m of tax was protected against invalid claims for repayment of LTT, an increase from the £0.4 million protected in 2024 to 2025.
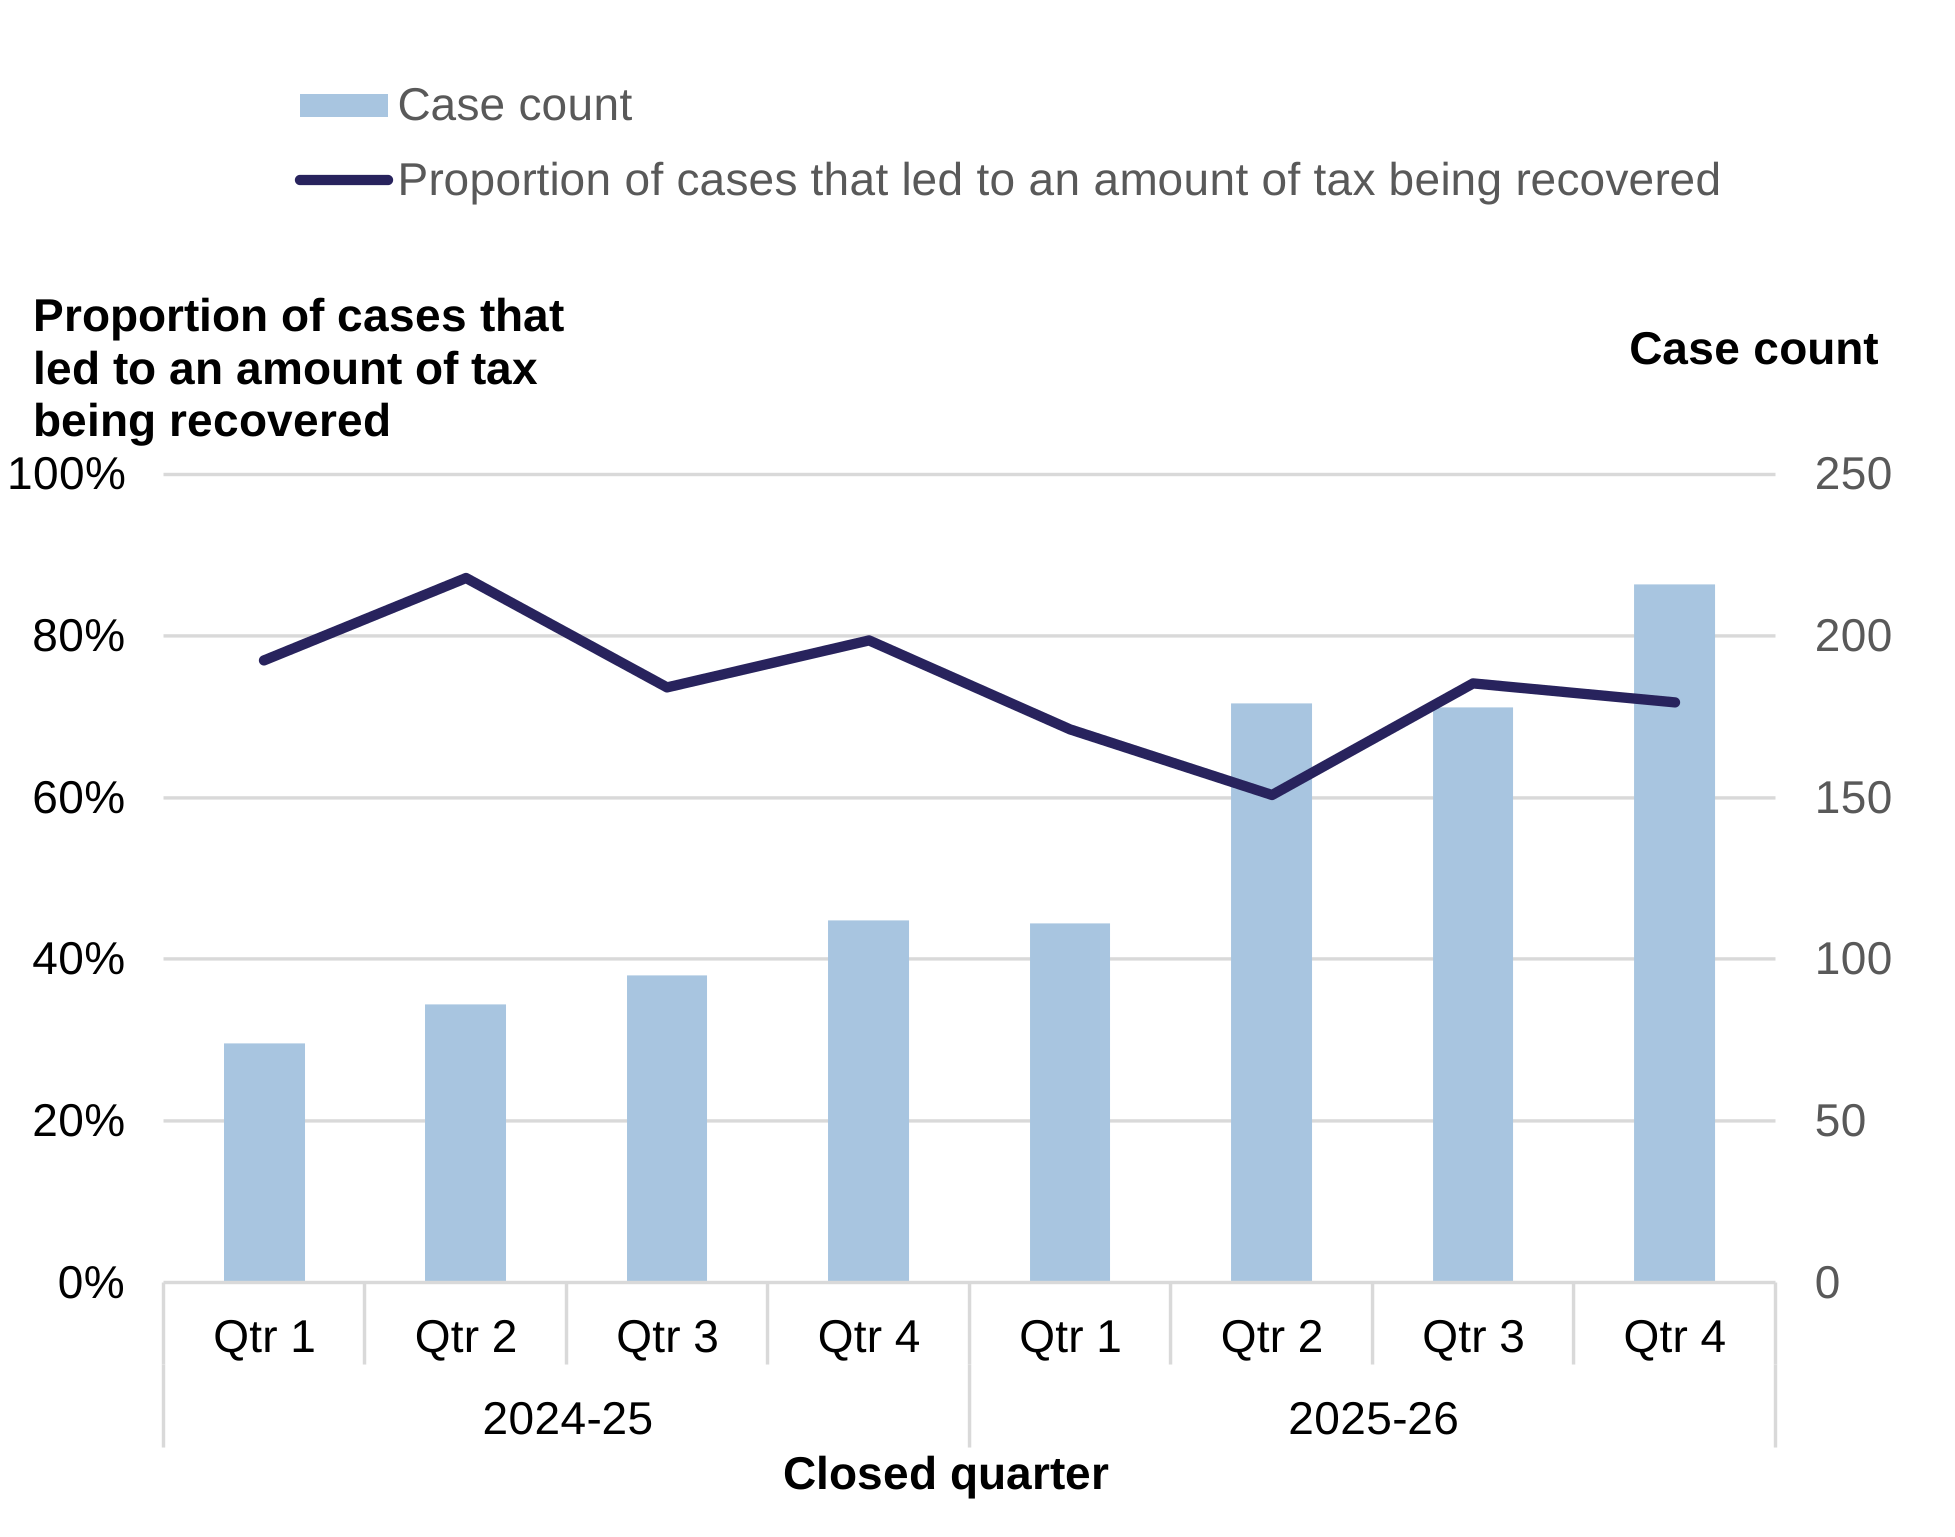
Chart 6a: Number of tax recovery cases and proportion of those cases that led to an amount of tax being recovered, by closed quarter
This chart falls under the ‘Fair’ strategic objective and relates to the tax service.
For cases within the LTT tax risks identified by the WRA, an enquiry is usually opened into the tax return. The enquiry may result in an amendment, usually increasing the tax due. The term ‘tax recovery’ denotes that there was an amendment with additional tax charged and does not relate to the payment of this. Over the 2-year period, the WRA has dedicated additional resources to both understanding broader tax risks and pursuing appropriate recovery actions. In doing so, the WRA has a performance aim to increase the proportion of investigations where an amount of tax is recovered.
Chart 6a shows the quarterly proportion of tax recovery cases that led to an amount of tax recovered throughout 2024 to 2025 and 2025 to 2026, using a scale of zero to 100%. It also displays bars showing the number of tax recovery cases closed each quarter, scaled from zero to 250.
Throughout 2024 to 2025 and 2025 to 2026, tax recovery cases have tracked on an upward trajectory with quarter 4 of 2025 to 2026 showing the highest volume of tax recovery cases to date.
However, the proportion of cases where an amount of tax was recovered was lower in 2025 to 2026 than 2024 to 2025, although it has tracked back upwards towards the end of 2025-26. This latter upturn has followed the increasing preliminary enquiries to taxpayers and their representatives (or agents) and assessing responses as part of initially establishing risk, as mentioned above. This was a deliberate step taken in response to this indicator.
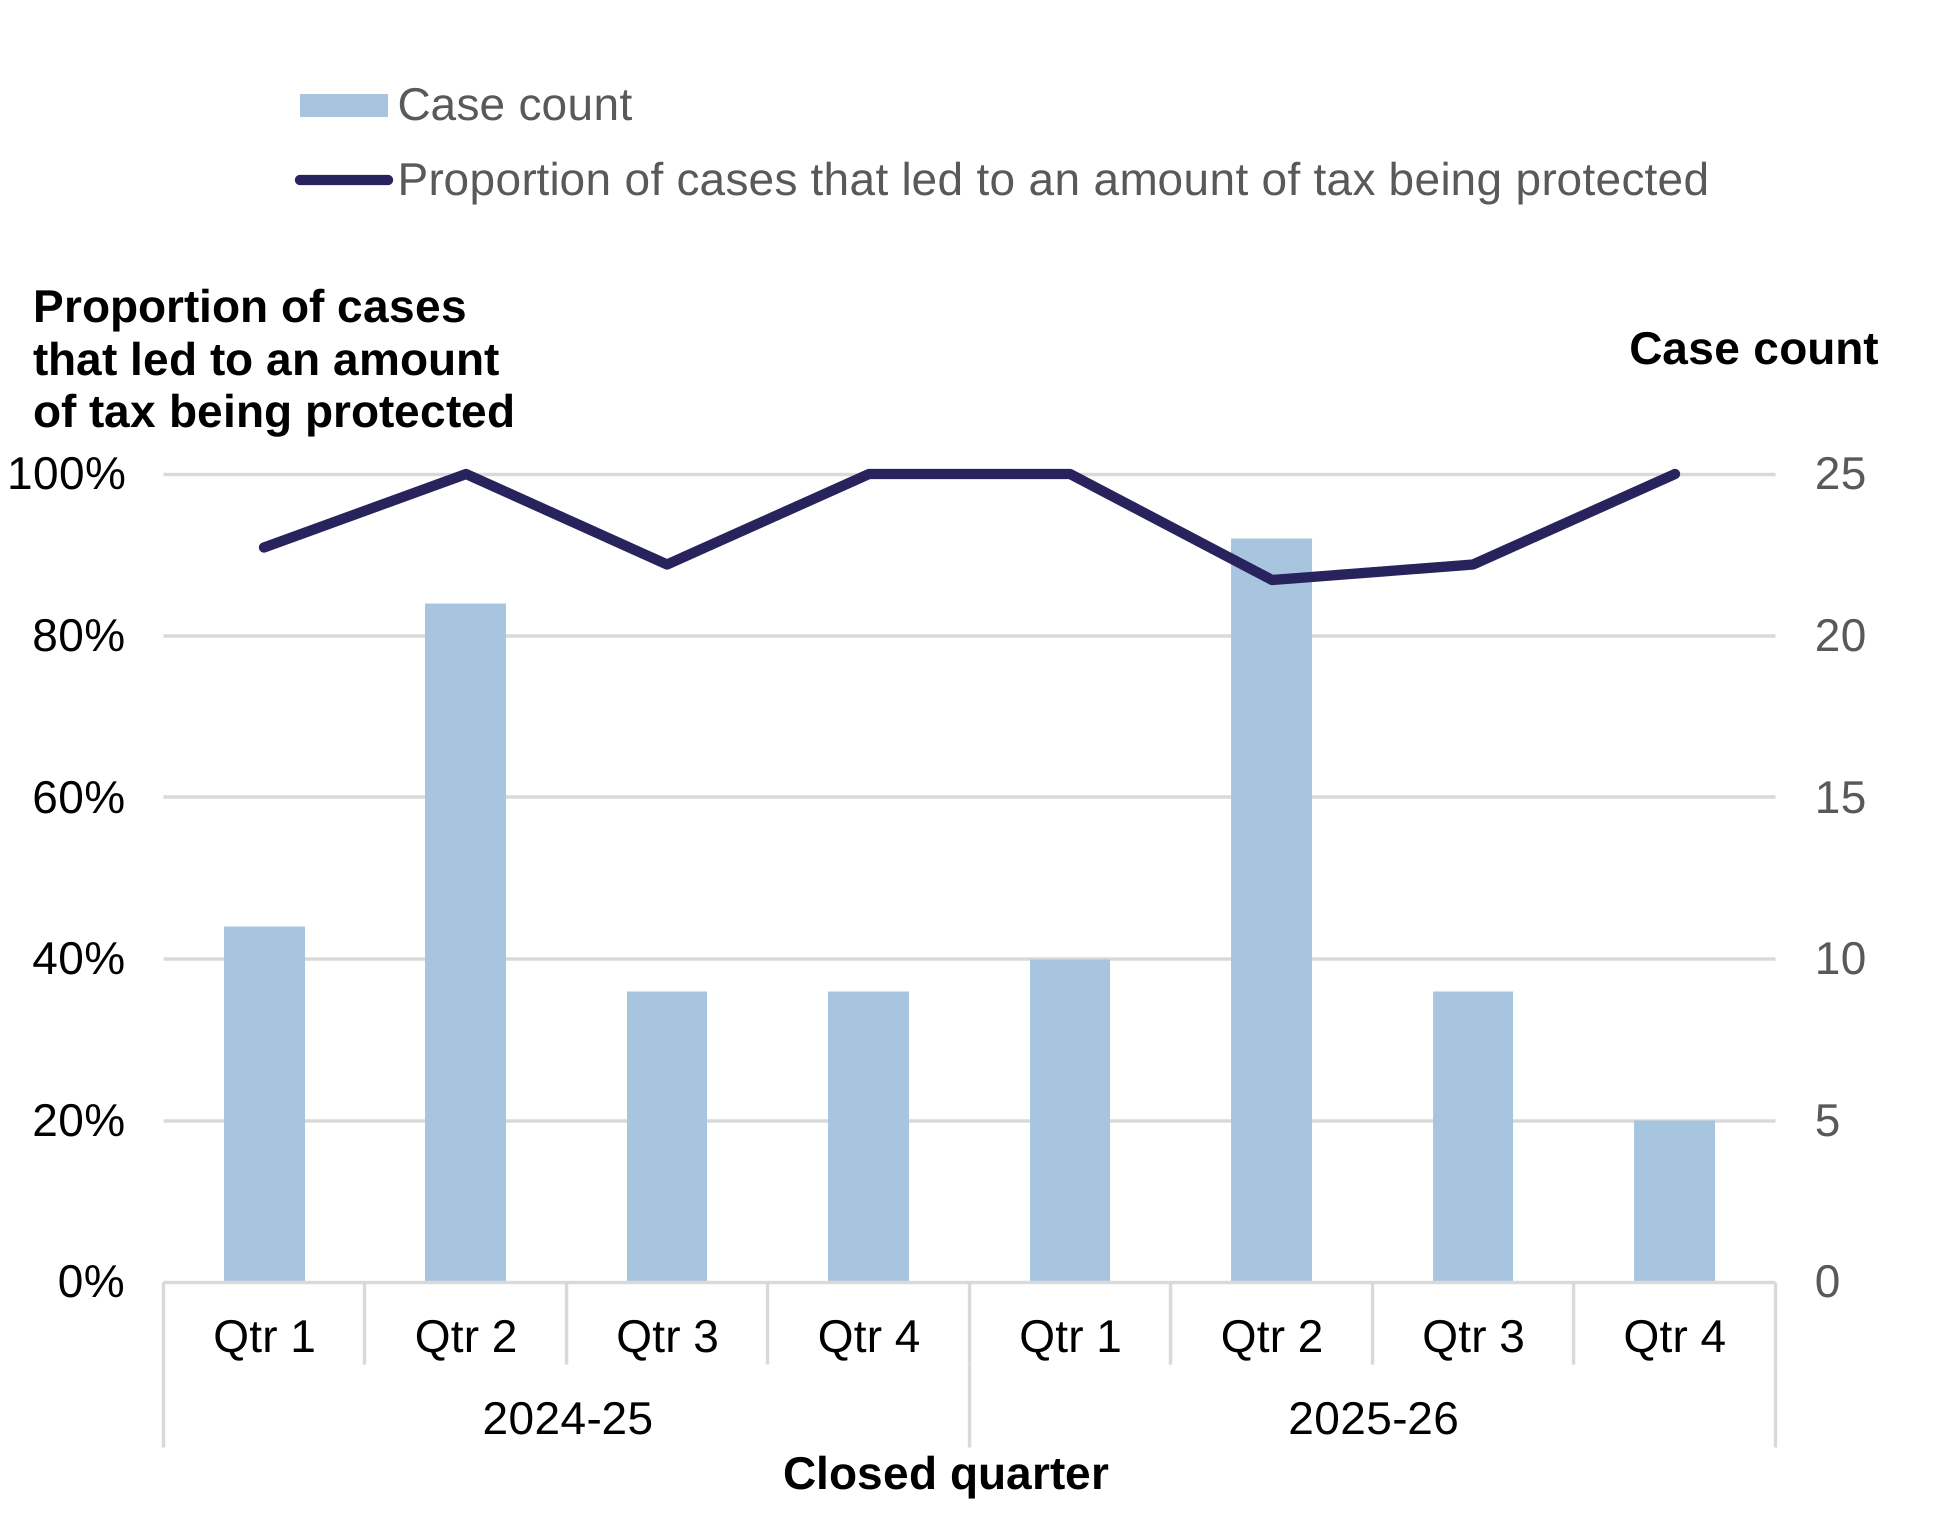
Chart 6b: Number of tax protection cases and proportion of those cases that led to an amount of tax being protected, by closed quarter
This chart falls under the ‘Fair’ strategic objective and relates to the tax service.
The WRA conducts tax protection work. This focuses on cases where taxpayers have submitted downward amendments to LTT returns that appear incorrect. In such cases, the WRA may open an enquiry, which typically results in protecting tax revenue that might otherwise have been inappropriately refunded. The WRA has a performance aim to increase the proportion of investigations where an amount of tax is protected.
Chart 6b shows the quarterly proportion of tax protection cases that protected an amount of tax throughout 2024 to 2025 and 2025 to 2026, using a scale of zero to 100%. It also displays bars showing the number of tax protection cases each quarter, scaled from zero to 25.
The generally low number of protection cases is likely due to direct action by the WRA to provide additional guidance and engage directly with those making inappropriate claims, thus reducing the need for investigations. Despite this variability, the proportion of tax cases where tax was protected has remained at around 90% or higher over the 2-year period.
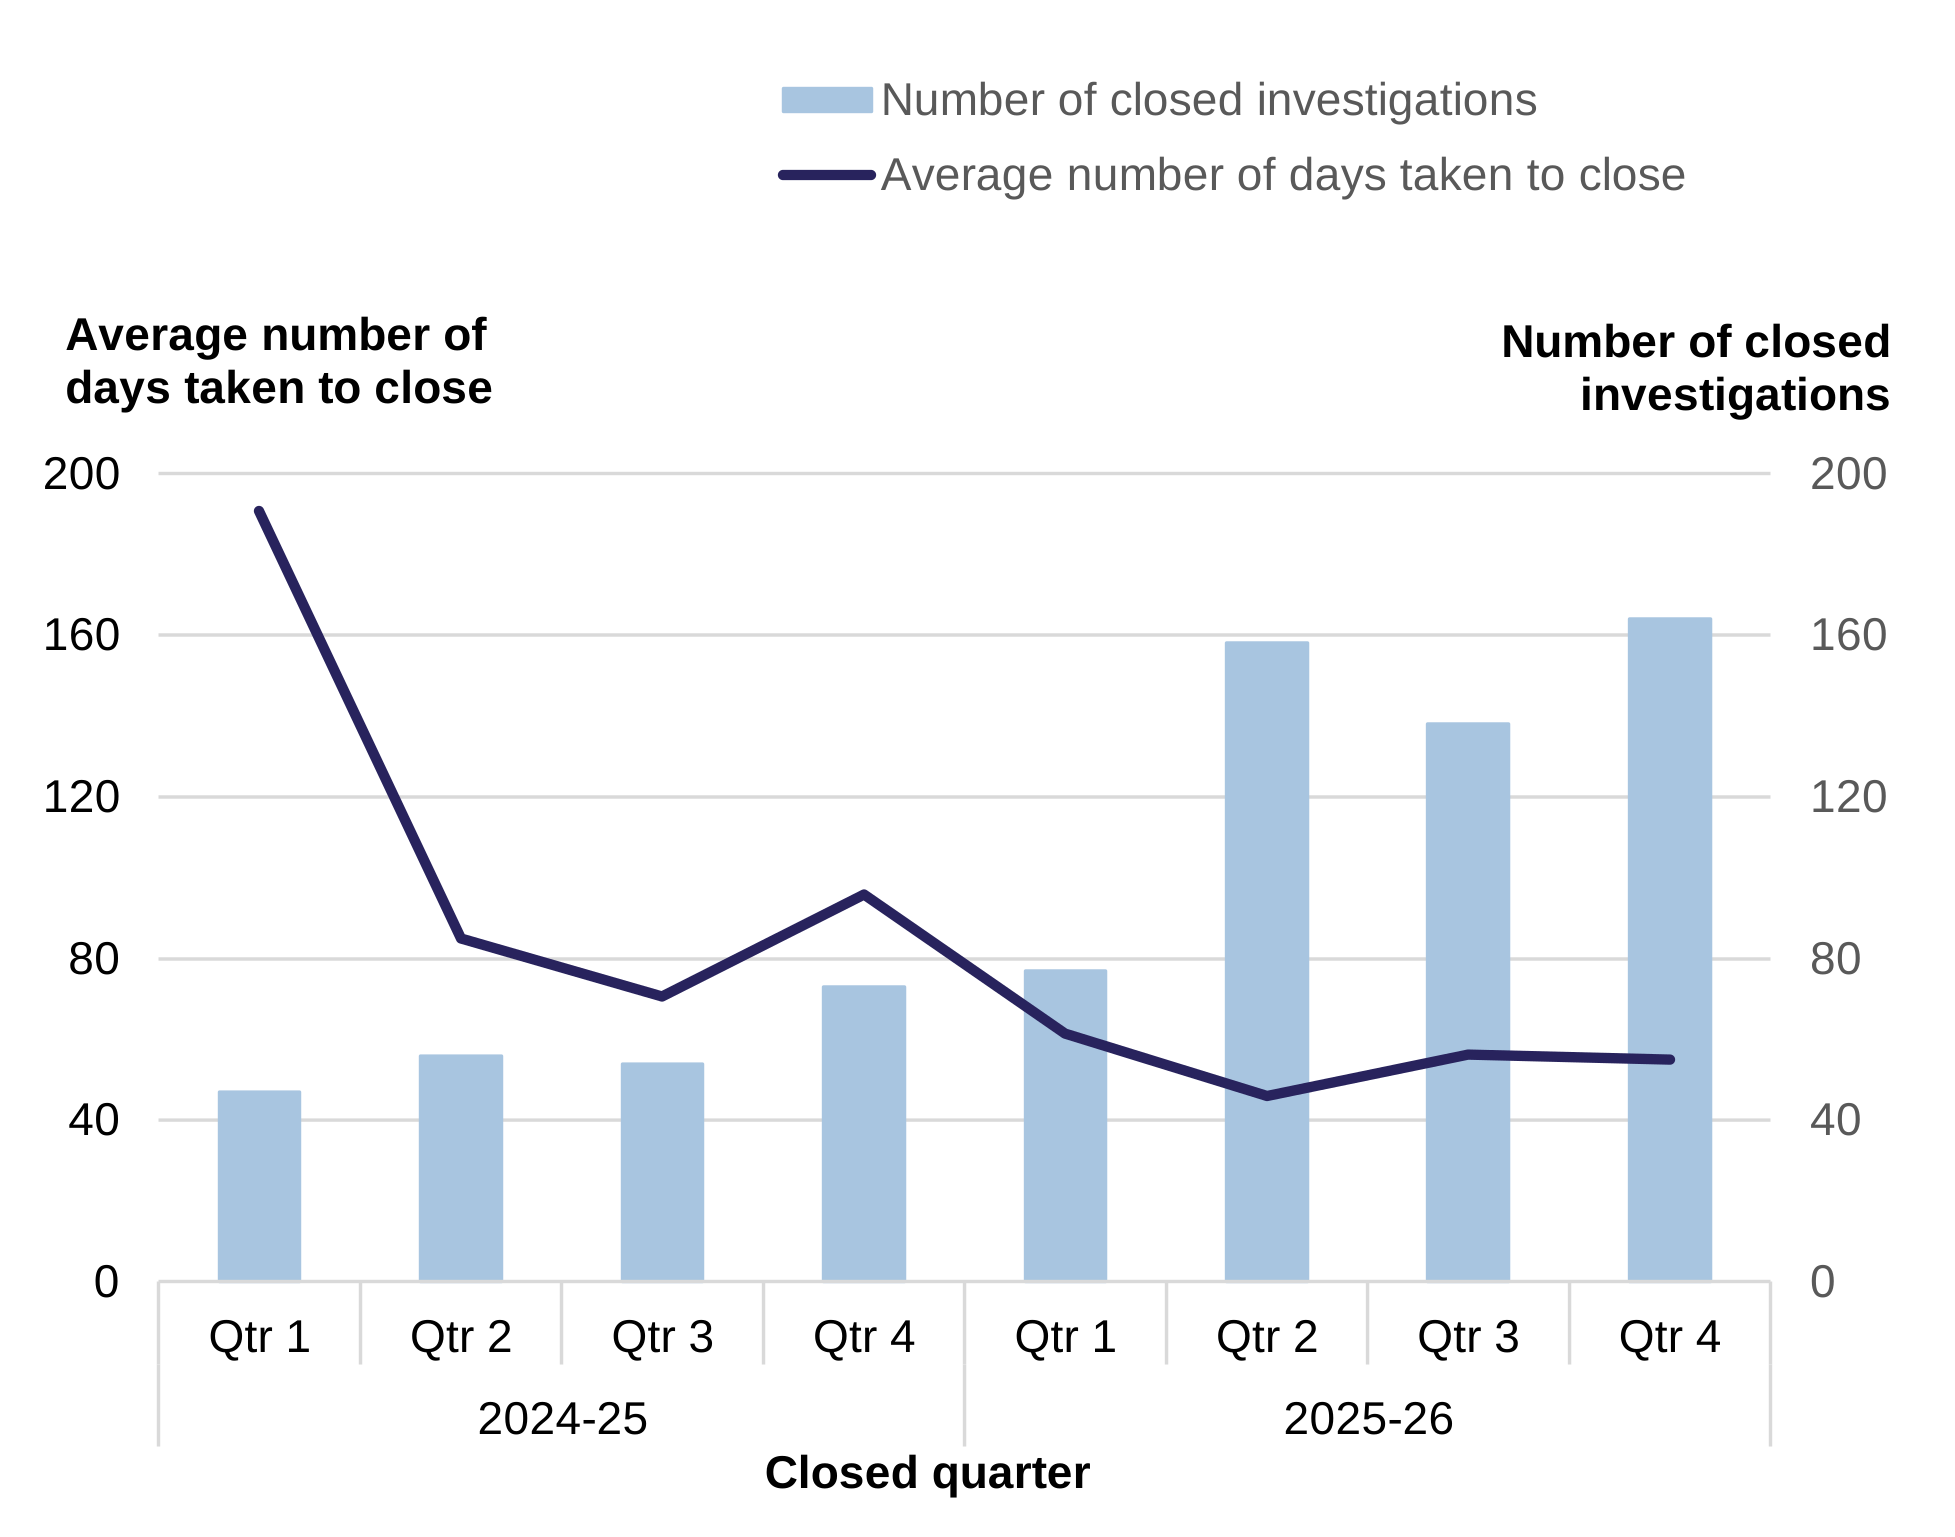
Chart 7a: Average number of days taken to close tax investigations and number of closed tax investigations, by closed quarter
This chart falls under the ‘Fair’ strategic objective and relates to the tax service.
The WRA has a performance aim to minimise the amount of time taken to conclude tax investigations, while ensuring sufficient time is allowed for full consideration of the matters arising. A secondary measure related to the proportion of these investigations concluded within 2 quarters is shown in chart 7b below. This indicates the amount of the maximum time the WRA considers to be reasonable here.
Chart 7a shows the quarterly average number of days to close a tax investigation throughout 2024 to 2025 and 2025 to 2026, using a scale of zero to 200. It also displays bars showing the number of closed tax investigations each quarter, scaled from zero to 200.
Chart 7a shows that the average number of days taken to close a tax investigation has generally decreased in 2025 to 2026 compared to 2024 to 2025, while the number of tax investigations closed has generally increased. In 2025 to 2026, the average number of days to close a tax investigation remained between one month and 90 days (less than a single quarter). The WRA considers this a good balance between thorough consideration and avoiding unnecessary delays for taxpayer.
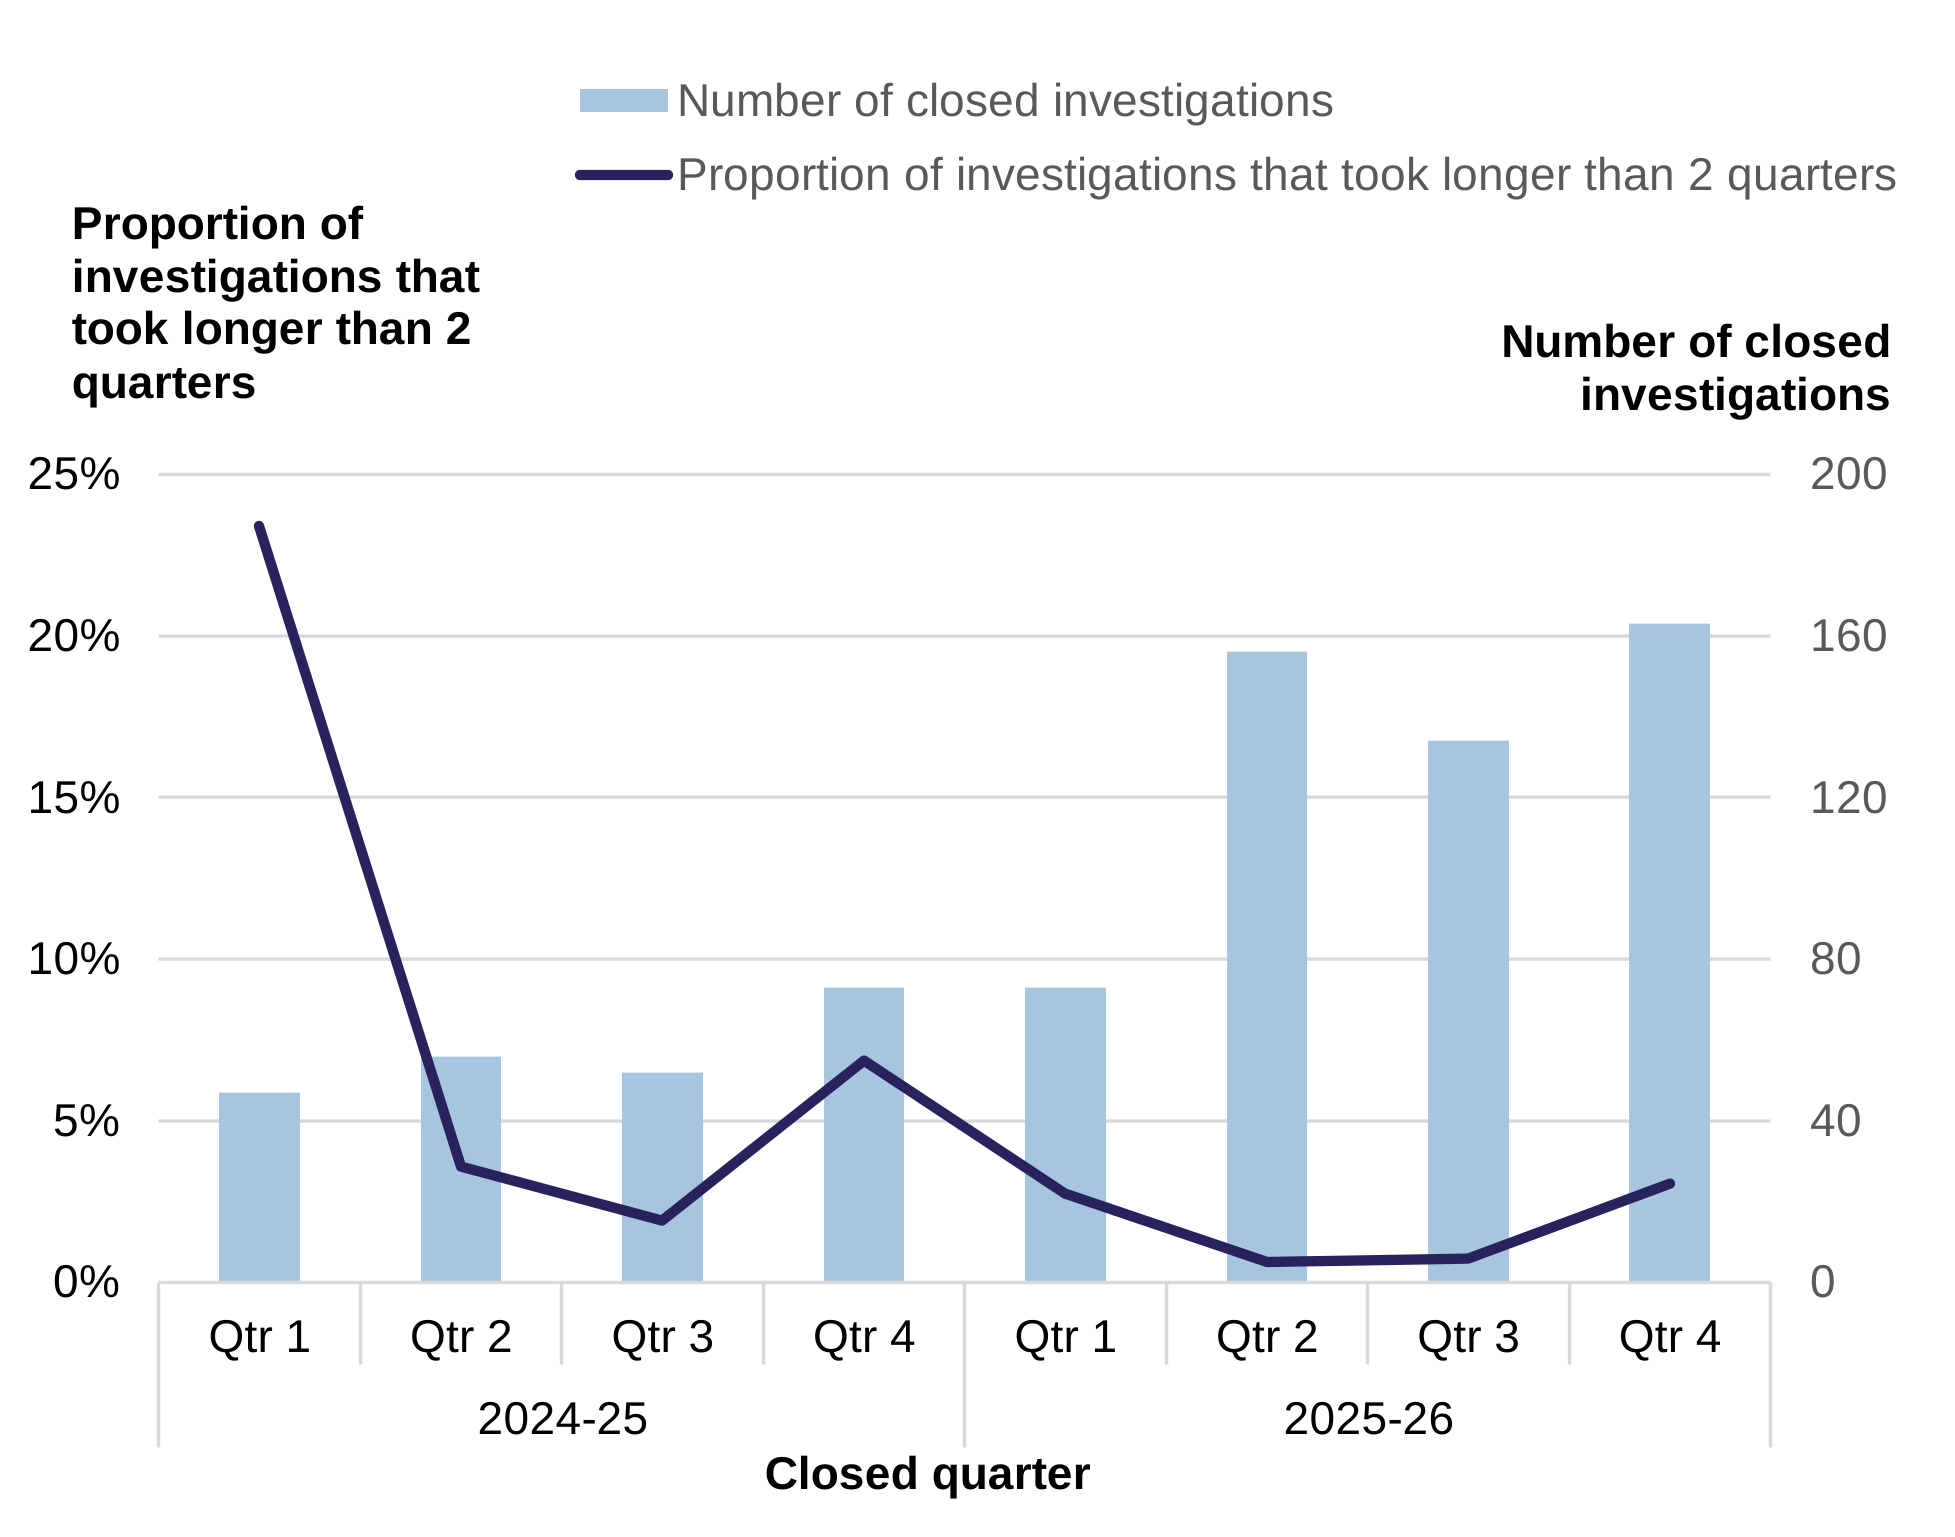
Chart 7b: Proportion of tax investigations that took longer than 2 quarters and number of tax investigations closed, by closed quarter
This chart falls under the ‘Fair’ strategic objective and relates to the tax service.
Chart 7b shows the proportion of tax investigations that take longer than 2 quarters throughout 2024 to 2025 and 2025 to 2026, using a scale of zero to 25%. It also displays bars showing the number of closed tax investigations each quarter, scaled from zero to 200. The chart shows that the proportion of tax investigations taking longer than 2 quarters to complete had a large decrease in quarter 2 of 2024 to 2025 and has generally remained at a lower level during 2025 to 2026, despite the significant rise in investigations.
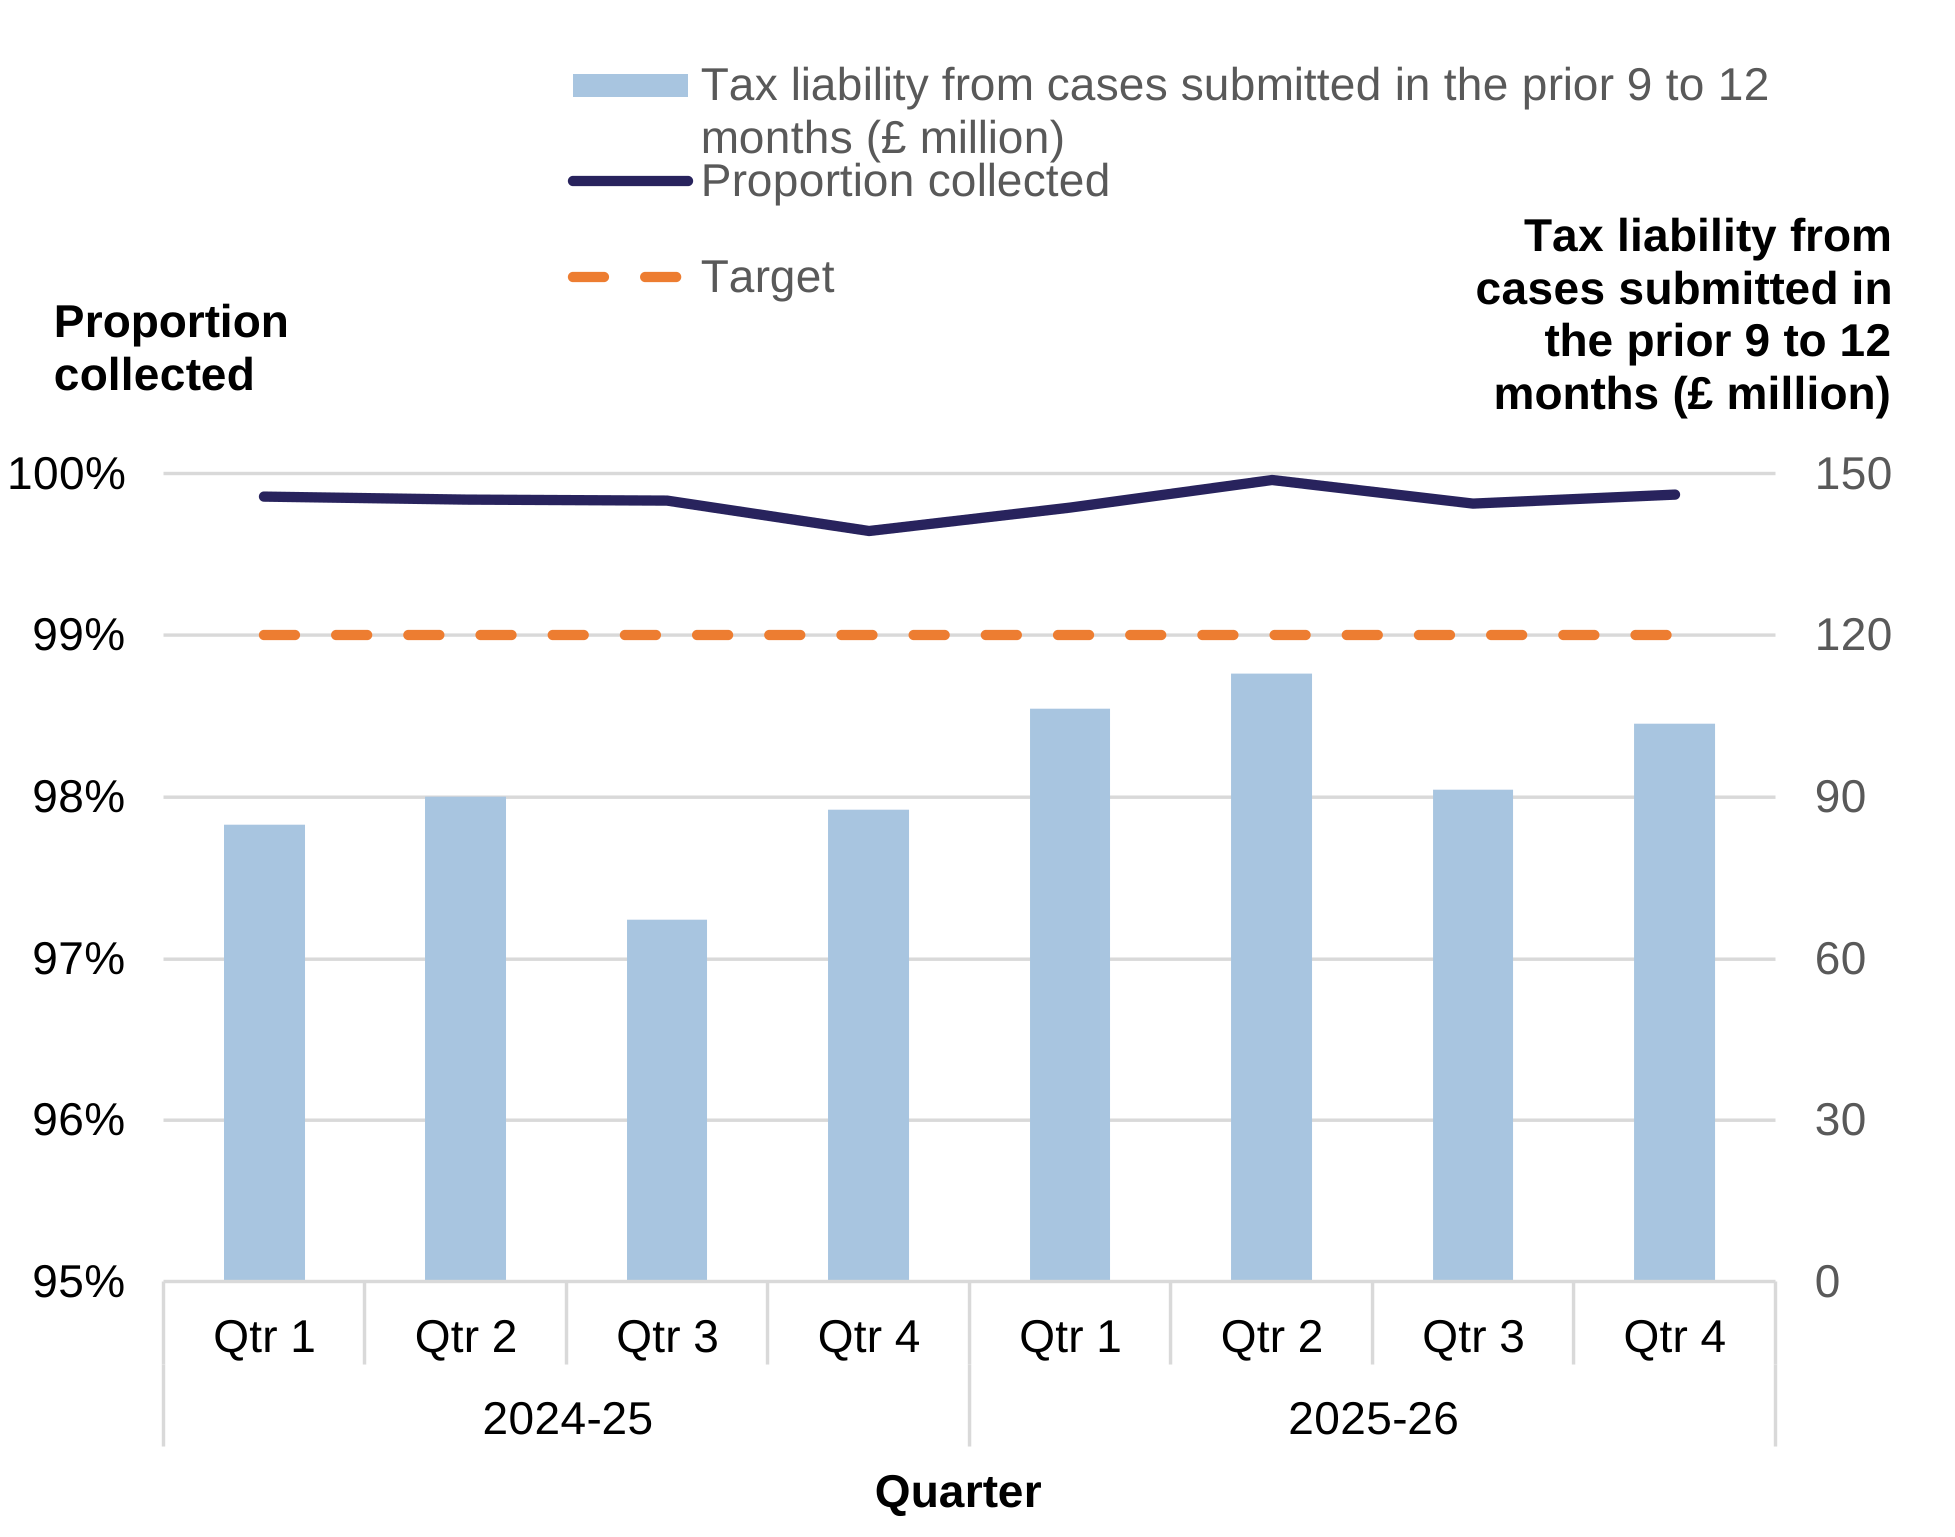
Chart 8: Tax liability from cases submitted in the prior 9 to 12 months (£ million) and proportion collected, by quarter
This chart falls under the ‘Fair’ strategic objective and relates to the payment service.
The WRA sets a 1-month due date for tax payment, if the tax is not paid by the due date then it is considered a tax debt. Due to the monthly variation in the collection of tax debts, it is more effective to look at collection rates over a longer period. The WRA has a performance target that we collect 99% of tax liability raised in the same period a year.
Chart 8 shows the quarterly proportion of tax liability collected from cases submitted in the prior 9 to 12 months throughout 2024 to 2025 and 2025 to 2026, using a scale of 95% to 100%, which will exaggerate the quarterly variation. It also displays bars showing the amount of tax liability from cases submitted in the prior 9 to 12 months, scaled from zero to £150 million. The target for the proportion of tax liability collected from cases submitted in the prior 9 to 12 months is also displayed at 99%.
Chart 8 shows the tax liability collected from cases submitted in the prior 9 to 12 months was generally higher in 2025 to 2026 than in 2024 to 2025. The proportion collected consistently remained higher than the 99% target, ranging between 99.6% and 100%.
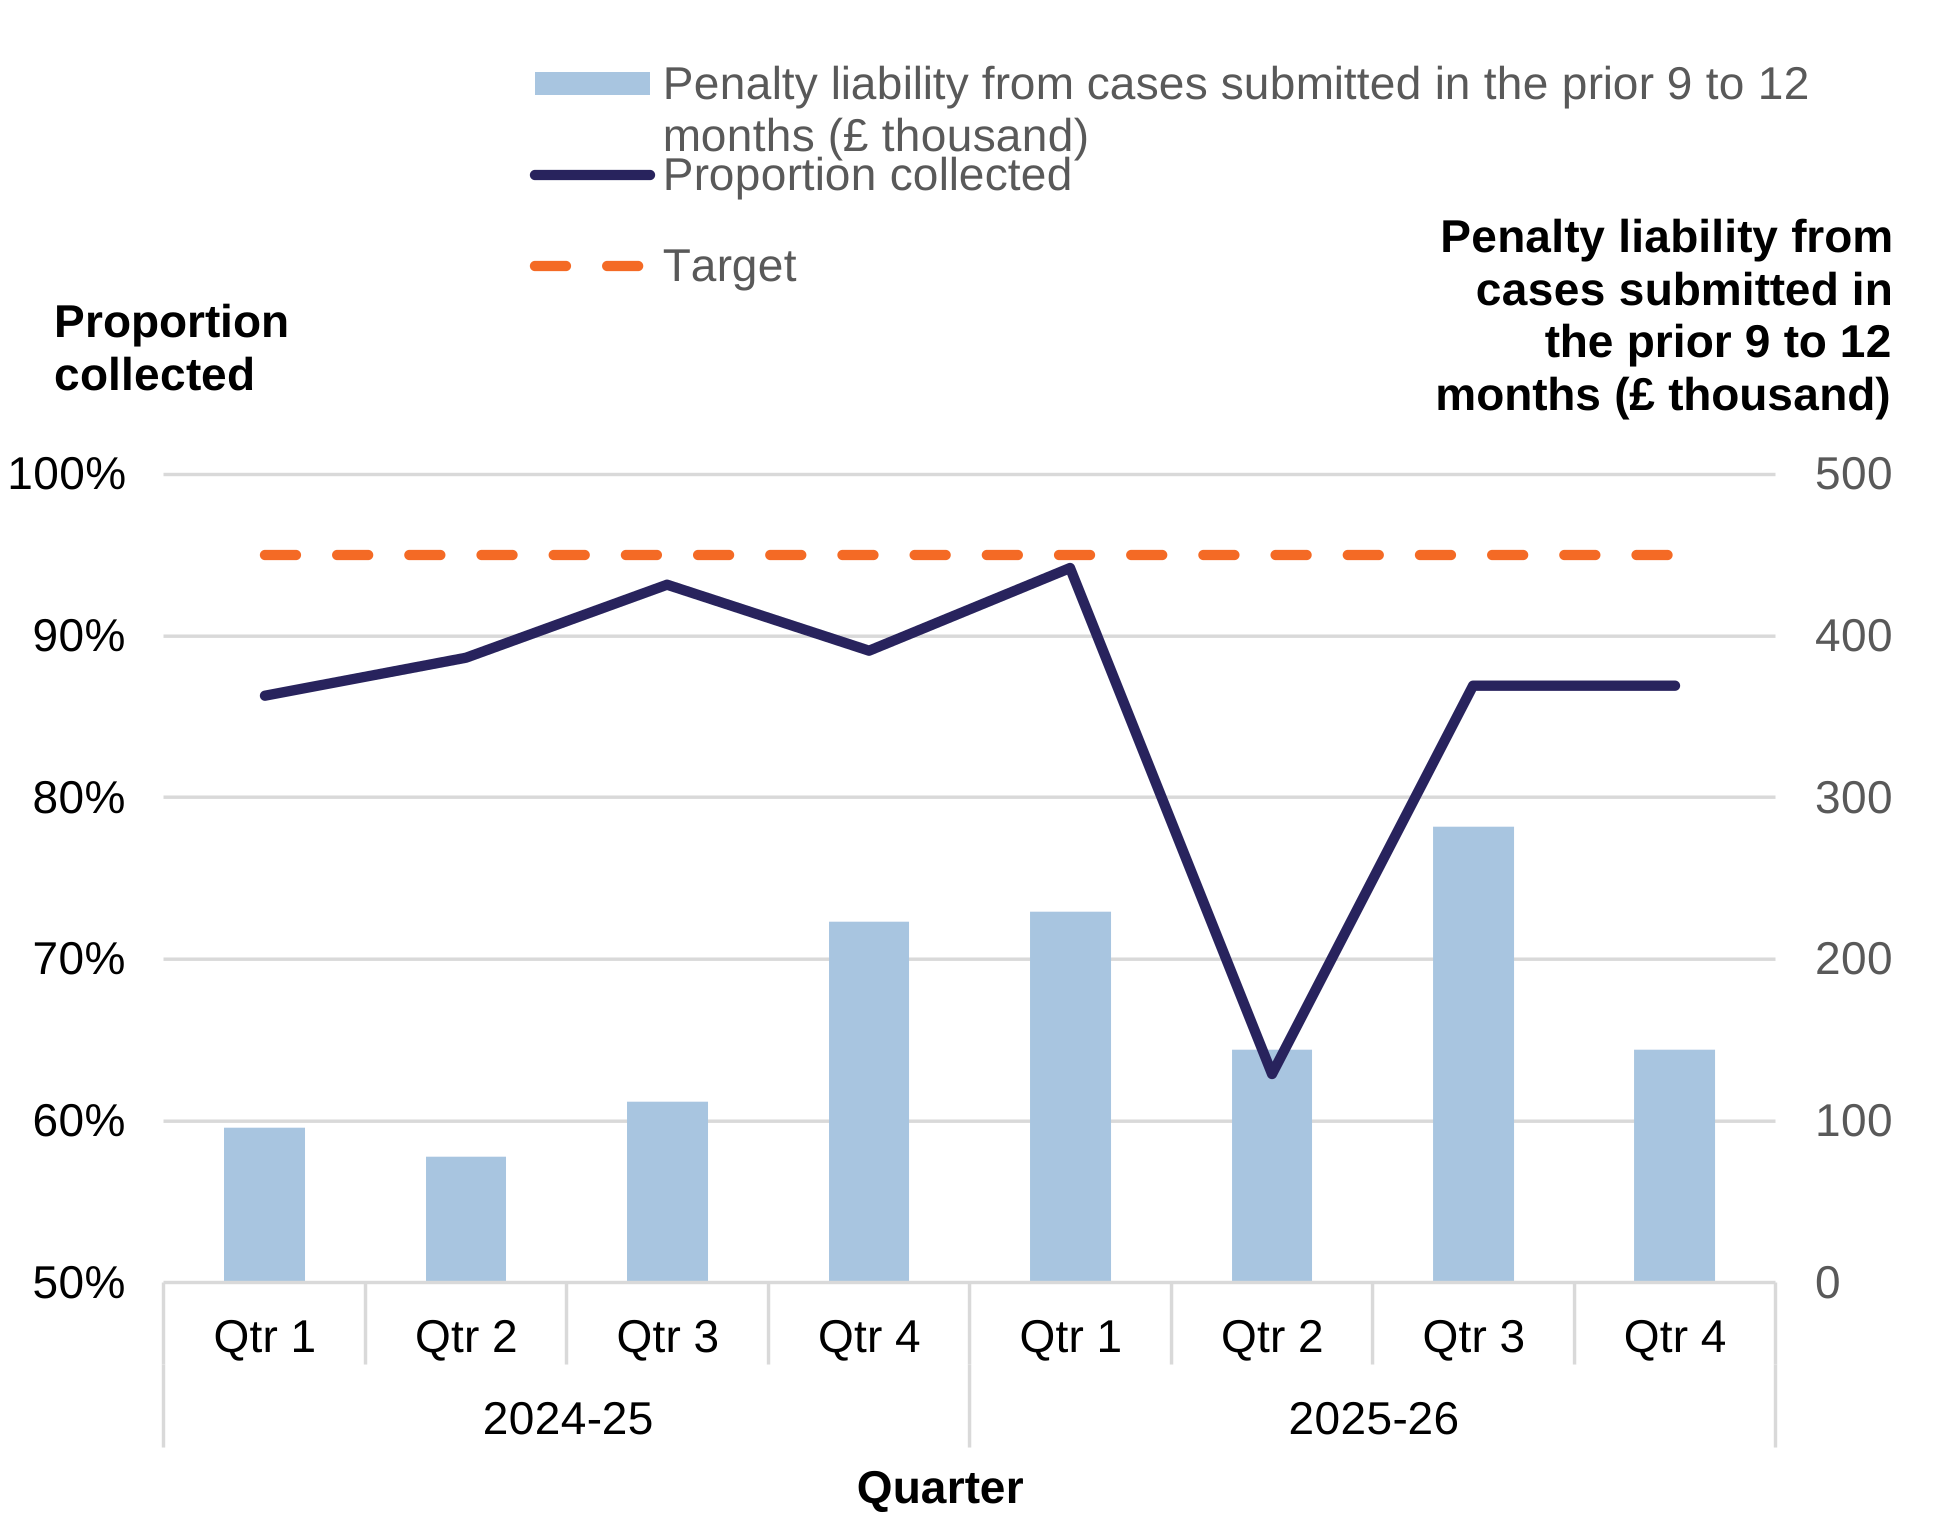
Chart 9: Penalty liability from cases submitted in the prior 9 to 12 months (£ thousand) and proportion collected, by quarter
This chart falls under the ‘Fair’ strategic objective and relates to the payment service.
The WRA applies late payment penalties to tax debts that have not been paid by 1 month, 6 months, and 1 year etc. Due to the monthly variation in the collection of penalty debts, it is more effective to look at collection rates over a longer period. The WRA has a performance target that we collect 95% of penalty liability raised in the same period a year earlier.
Chart 9 shows the quarterly proportion of penalty liability collected from cases submitted in the prior 9 to 12 months throughout 2024 to 2025 and 2025 to 2026, using a scale of 50% to 100%, which will slightly exaggerate the variation. It also displays bars showing the amount of penalty liability from cases submitted in the prior 9 to 12 months, scaled from zero to £500,000. The target for the proportion of penalty liability collected from cases submitted in the prior 9 to 12 months is also displayed at 95%.
Chart 9 shows that the amount of penalty liability from cases submitted in the prior 9 to 12 months has been variable but is generally higher in 2025 to 2026 than in 2024 to 2025. The proportion of penalty liability collected from cases submitted in the prior 9 to 12 months has generally ranged between 85% to 95%, with exception of quarter 2 in 2025 to 2026 which fell to 63%. This fall was due to a small number of cases which had relatively large penalties applied. The proportion collected remained a little below the target throughout the 2-year period.
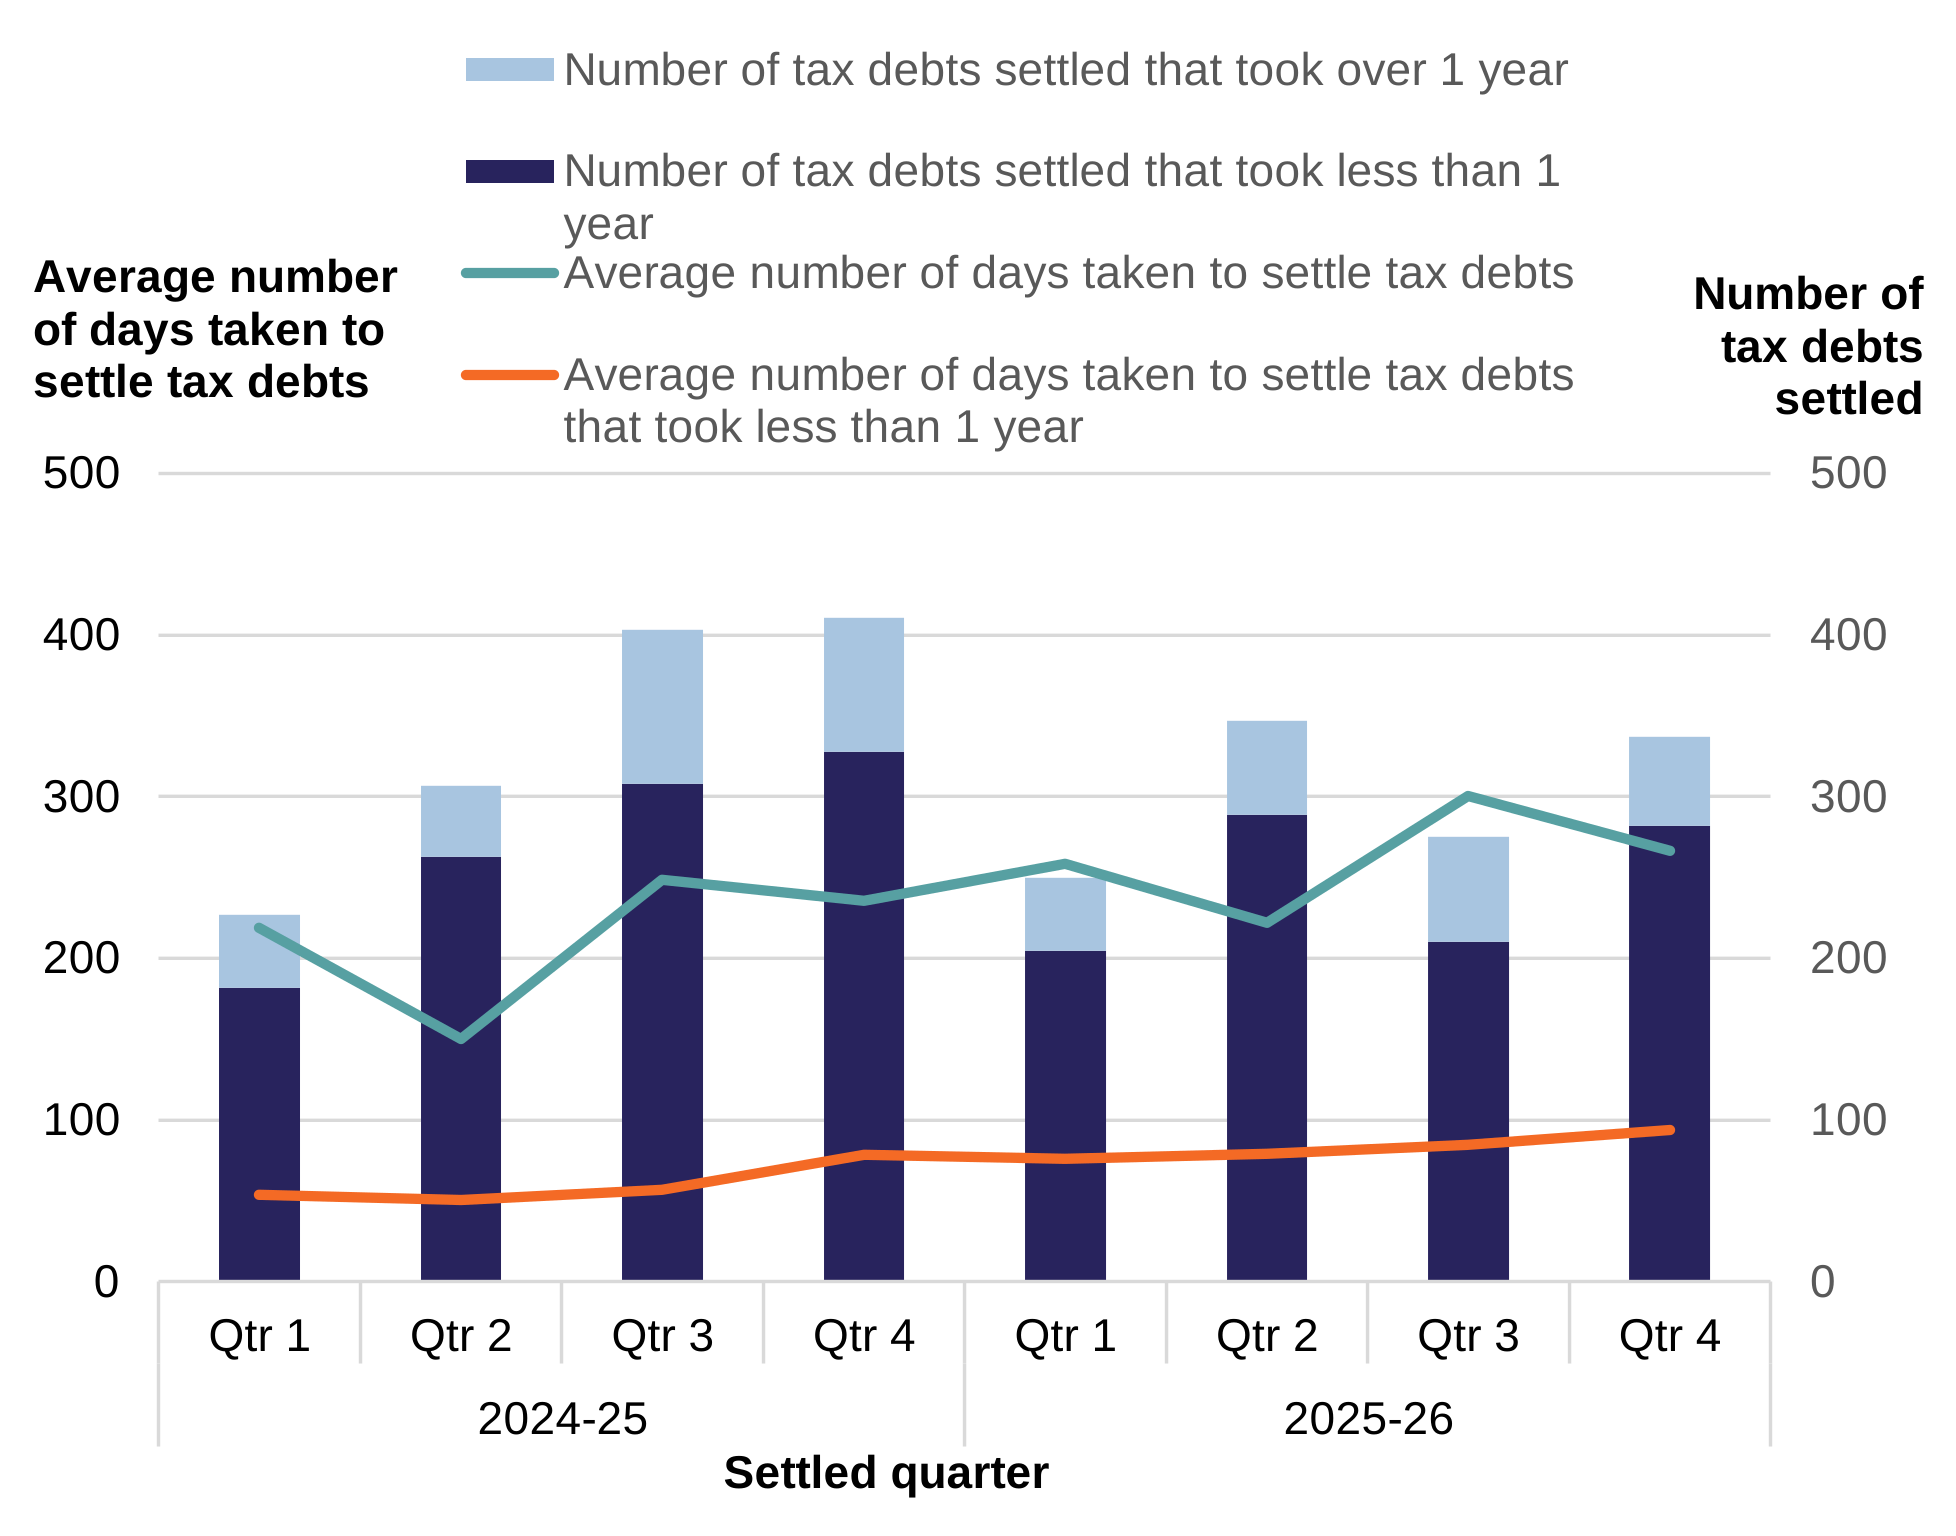
Chart 10a: Average number of days taken to settle tax debts and number of tax debts, by settled quarter
This chart falls under the ‘Fair’ strategic objective and relates to the payment service.
Chart 10a shows the quarterly average number of days taken to settle tax debt throughout 2024 to 2025 and 2025 to 2026. It also displays bars showing the number of tax debts settled each quarter. Both measures use a scale of zero to 500. In this chart, we are considering tax debts that took longer than 1 year to settle as outliers. Although these are relatively small in number, they have a significant impact on the measures.
The number of tax debts increased up to quarter 4 in 2024 to 2025 but has been lower in 2025 to 2026. The number of tax debts that took over 1 year decreased in 2025 to 2026 when compared with 2024 to 2025. The average number of days taken to settle is higher at the end of the 2-year period than at the start but is variable from quarter to quarter. When removing debts of over 1 year, the average time taken to settle is less variable and gradually trends upwards. This may be due to minor staffing challenges over the period, which are now largely resolved. We’ll continue to monitor this both internally and in next year’s report.
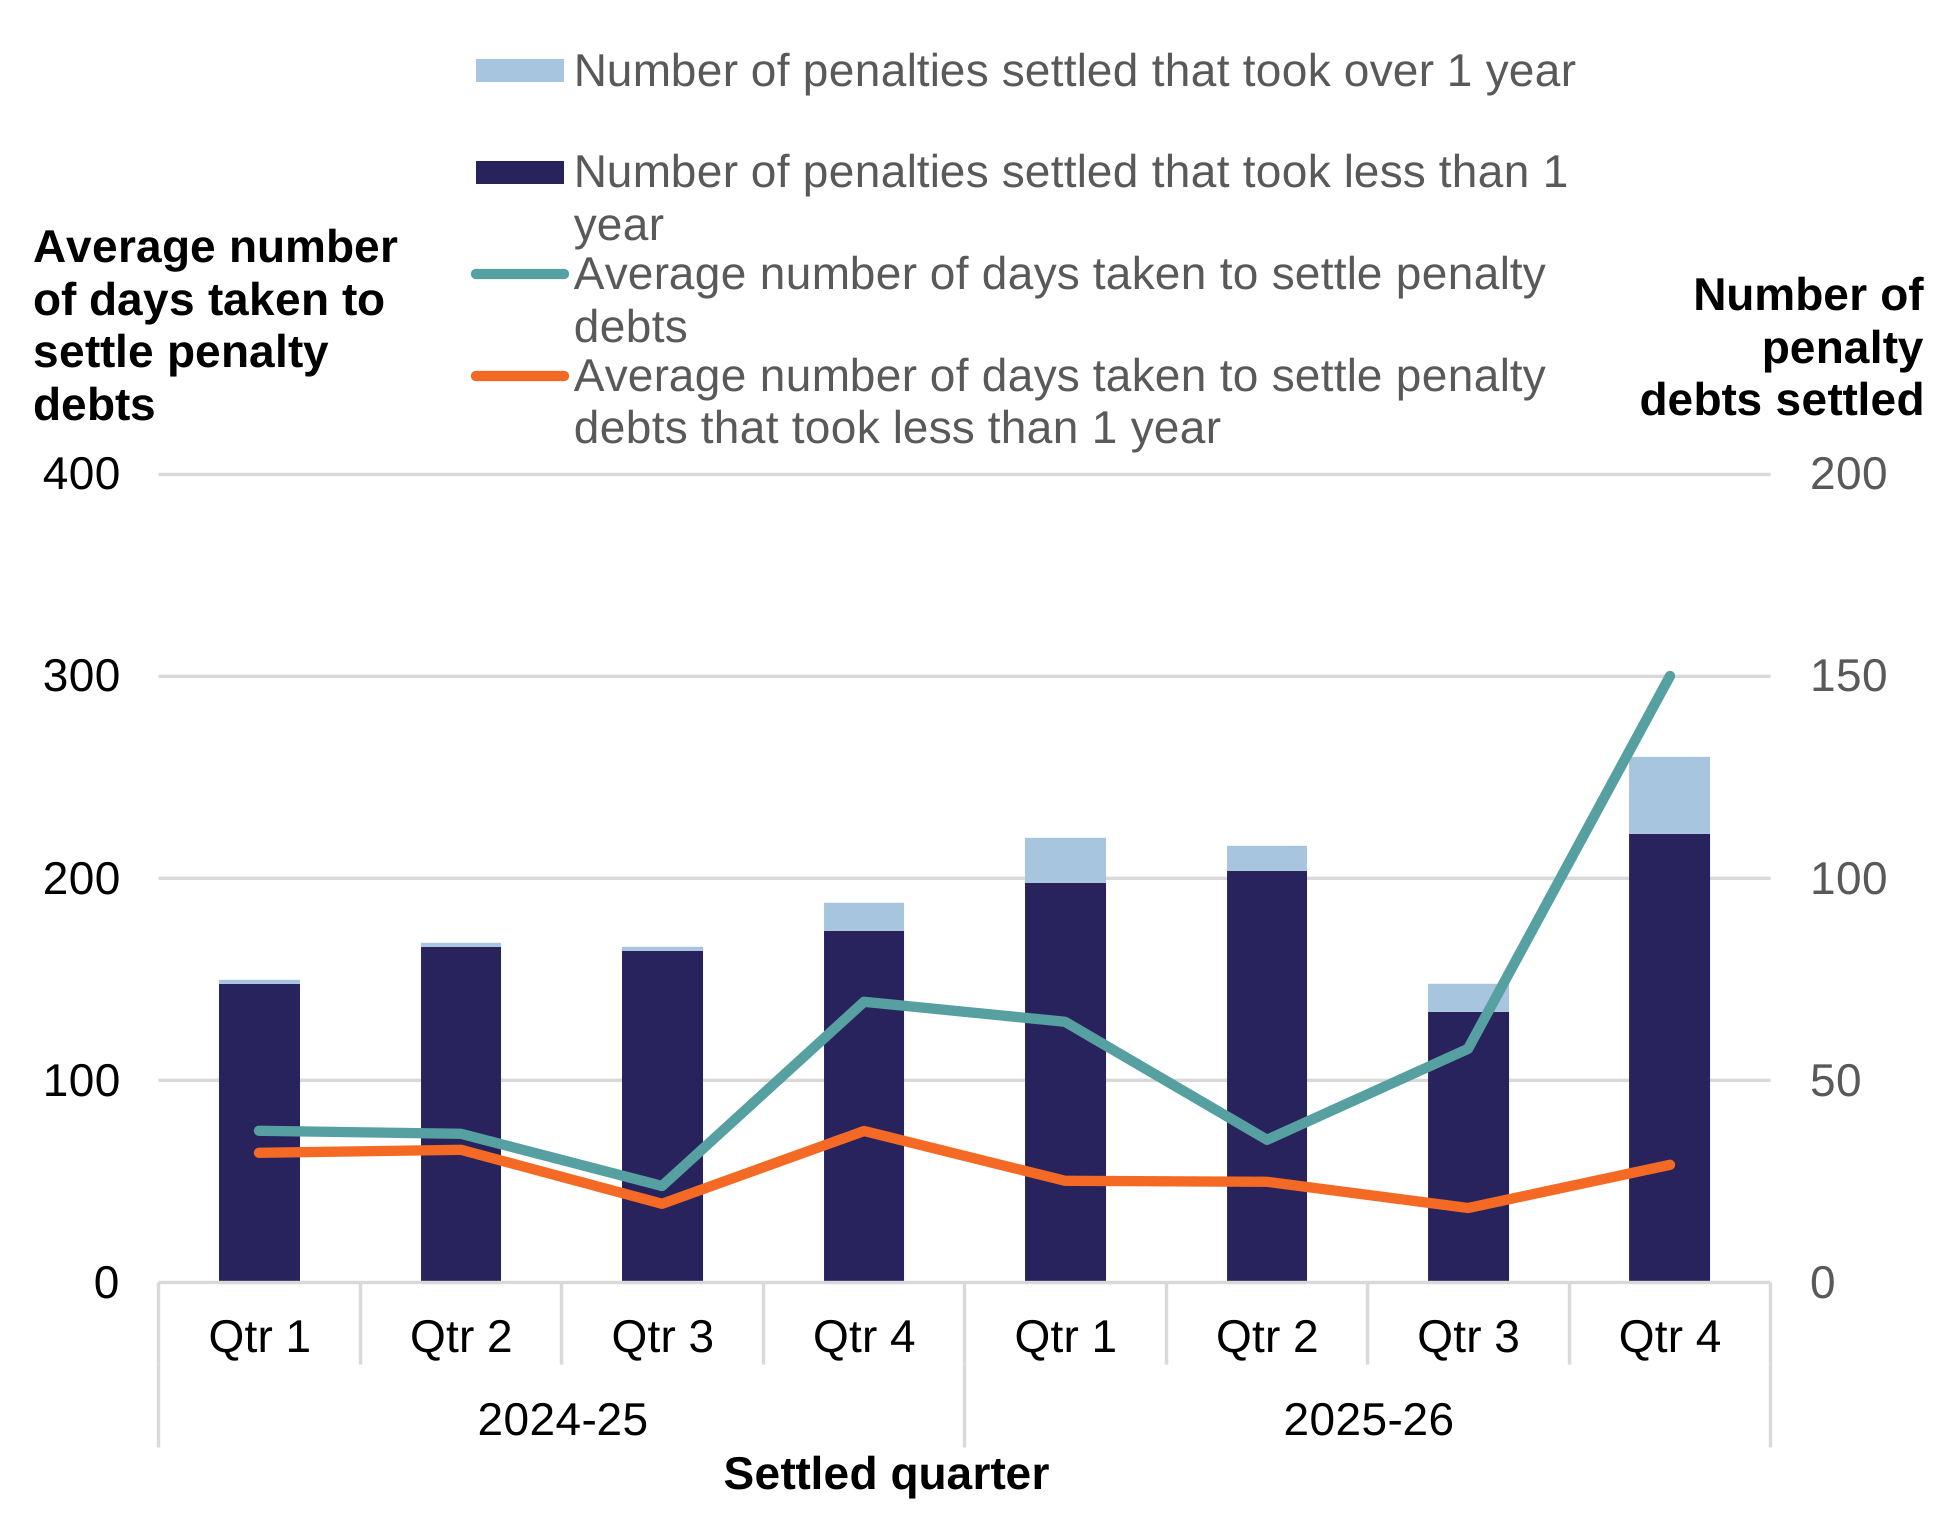
Chart 10b: Average number of days taken to settle penalty debts and number of penalty debts, by settled quarter
This chart falls under the ‘Fair’ strategic objective and relates to the payment service.
Chart 10b shows the quarterly average number of days taken to settle penalty debt throughout 2024 to 2025 and 2025 to 2026, using a scale of zero to 400. It also displays bars showing the number of penalty debts settled each quarter, using a scale of zero to 200. In this chart, we are considering penalty debts that took longer than 1 year to settle as outliers. This is due to the significant impact they have on the measures despite being small in number.
Chart 10b shows that the number of penalties settled that took over 1 year has generally been higher in 2025 to 2026 than in 2024 to 2025 but has remained at a relatively low level. The number of penalty debts settled that took less than 1 year generally increased throughout the 2-year period, except for the dip in quarter 3 of 2025 to 2026. The average number of days taken to settle penalty debts has remained variable over the 2-year period, both when including and excluding outliers. The spike in the most recent quarter is due to the settlement of a small number of particularly old penalty debts.
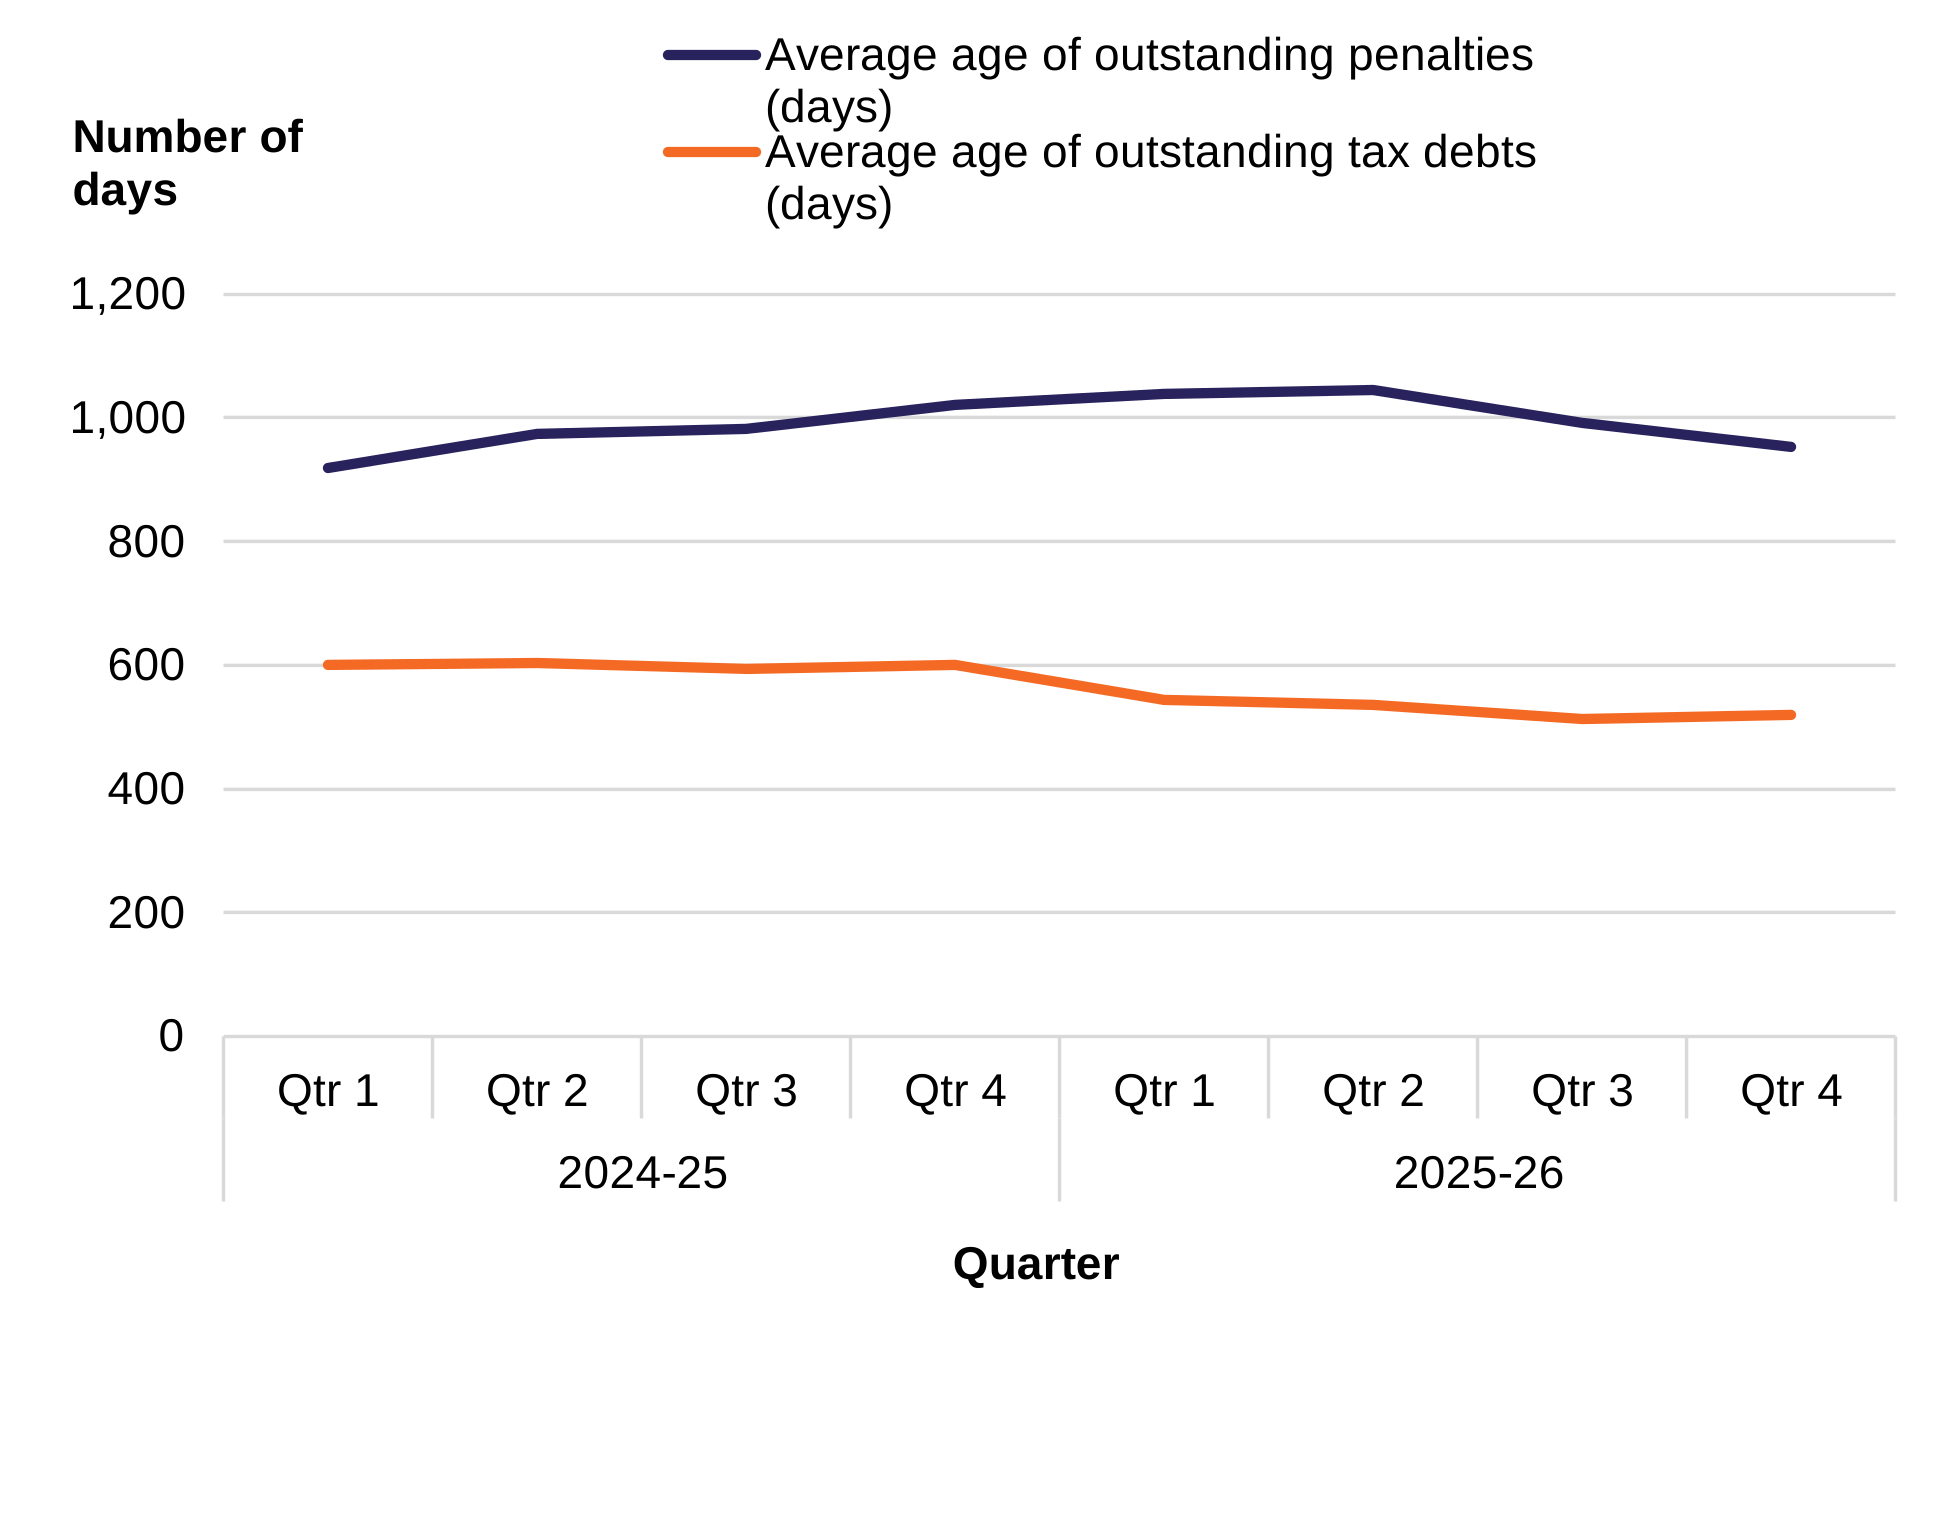
Chart 11: Average age of outstanding tax and penalty debts, by quarter
This chart falls under the ‘Fair’ strategic objective and relates to the payment service.
The data included in the chart represents all outstanding tax and penalty debts as at quarter 4 of 2025 to 2026. The quarter on the chart refers to penalty created date and tax debt start date.
Chart 11 shows the quarterly average age of outstanding penalties and tax debts throughout 2024 to 2025 and 2025 to 2026, using a scale measuring the number of days since the penalty was created and the tax debt started from zero to 1,200.
The average age of outstanding penalties gradually increased until quarter 2 of 2025 to 2026 before gradually decreasing to approximately the levels seen in quarter 1 of 2024 to 2025. The average age of outstanding tax debts has been stable for most of the 2-year period, with a decrease at the start of 2025 to 2026 so that the average age is lower now than at the start of the period.
There were 290 outstanding tax debts and 780 outstanding penalty debts as at the end of quarter 4 of 2025 to 2026. More detail on outstanding debt is provided in the debt appendix at the end of this report.
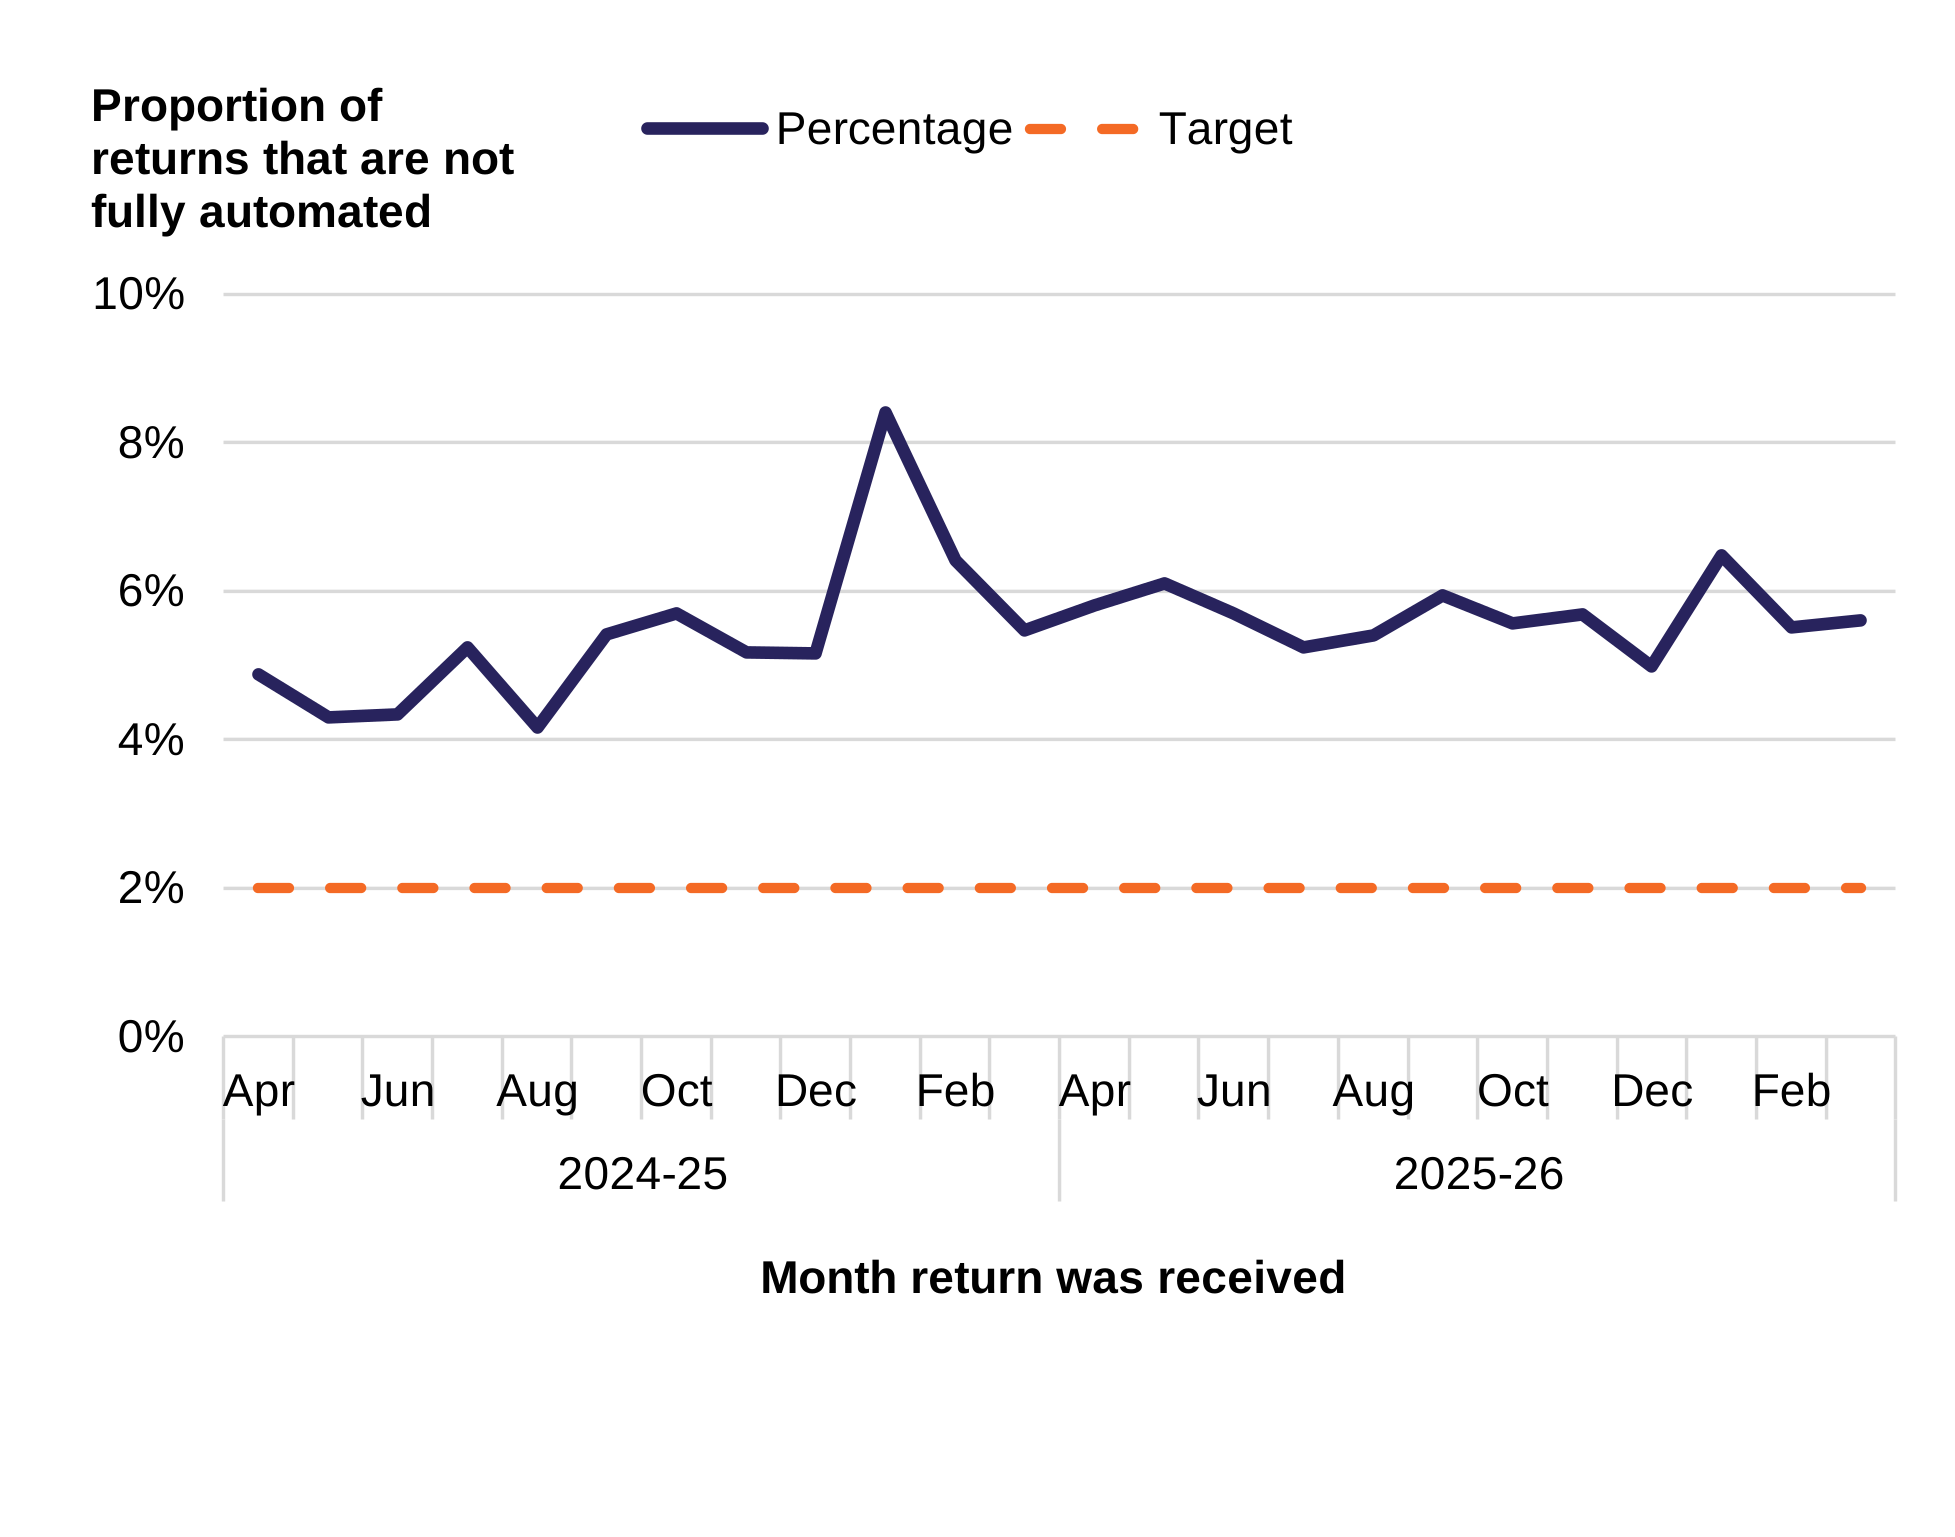
Chart 12: The percentage of transactions not processed automatically through to initial payment, by month received
This chart falls under the ‘Sustainable’ strategic objective and relates to the payment service.
The WRA has a performance target to automatically process 98% of transactions without manual intervention. This target includes both the receipt of digital transactions and automatic matching of first payments to transactions with a financial liability, covering both LTT and LDT. The chart only includes initial submission and payment (if relevant) and not future action the WRA might undertake to manage tax risk.
Chart 12 uses the reverse technique explained in the introduction. It shows how the monthly percentage of transactions that required manual intervention has changed over the course of 2024 to 2025 and 2025 to 2026, using a scale of zero to 10%. The dotted line shows the reverse target of 2%.
The chart shows fluctuating percentages across both years, with peaks during January followed by declines. Beyond the peak in January 2025, the trend remains relatively consistent sitting between 4% and 6%, which does not quite meet the stretching 2% target set for the reverse of this measure. We’ll continue to monitor this both internally and in next year’s report.
Other measures under the ‘Sustainable’ strategic objective
Narratives on our other measures that fall under the ‘Sustainable’ strategic objective, such as staff engagement, use of the Welsh language, and the Future Generations of Wales’ 5 ways of working can be found in our annual report and accounts for 2025 to 2026.
Appendix: outstanding debt
While the amount of outstanding debt is not a formal measure in the Corporate Plan, it’s helpful to present figures for the total debt at the end of each financial year. We provide a breakdown for tax and penalty debt, annual amounts of debt written off, and a breakdown of total debt for each tax.
| Financial year | Tax debt [Note 1] | Penalty debt | Total debt [Note 1] | Debt written off |
|---|---|---|---|---|
| 2018 to 2019 | 6.1 | [k] | 6.1 | [k] |
| 2019 to 2020 | 8.2 | 0.1 | 8.3 | [k] |
| 2020 to 2021 | 7.9 | 0.1 | 8.0 | [k] |
| 2021 to 2022 | 8.8 | 0.2 | 9.0 | [k] |
| 2022 to 2023 | 10.2 | 0.2 | 10.4 | [k] |
| 2023 to 2024 | 8.2 | 0.2 | 8.4 | 0.1 |
| 2024 to 2025 | 6.2 | 0.4 | 6.5 | [k] |
| 2025 to 2026 | 4.8 | 0.5 | 5.3 | 0.9 |
| Financial year | LTT debt | LDT debt (excluding unauthorised disposals) [Note 1] | Unauthorised disposals debt | Total debt [Note 1] |
|---|---|---|---|---|
| 2018 to 2019 | 2.7 | 3.4 | 0.0 | 6.1 |
| 2019 to 2020 | 3.0 | 5.3 | 0.0 | 8.3 |
| 2020 to 2021 | 4.3 | 3.7 | 0.0 | 8.0 |
| 2021 to 2022 | 5.4 | 3.7 | 0.0 | 9.0 |
| 2022 to 2023 | 5.5 | 4.9 | 0.0 | 10.4 |
| 2023 to 2024 | 4.8 | 3.5 | 0.1 | 8.4 |
| 2024 to 2025 | 5.7 | 0.8 | 0.1 | 6.5 |
| 2025 to 2026 | 4.8 | [k] | 0.5 | 5.3 |
[k] Represents a value which rounds to 0, but is not 0.
[Note 1] Some of the historic tax debt presented built up due to some LDT enquiries taking years to resolve. Such debts only appear in our debt statistics once the enquiries ended (in line with our accounting practice), even though in practice they were paid shortly after enquiries concluded. As a result, some of the debt figures for earlier years are theoretical, and the trend in debt (particularly LDT debt) should be treated with caution. It's possible that debt figures for earlier years may be revised in future when outstanding enquiries are completed.
Table 1a presents trends in debt over the past 8 years. Some of the tax debt figures for earlier years were affected by the issue described in Note 1. Total debt was £5.1 million at the end of 2025 to 2026, with tax debt contributing the majority of this and penalty debt contributing £0.5 million. Debt write-offs were £0.1 million in 2023 to 2024 and rounded to nil in all other years (up to 2024 to 2025). £0.9 million of debt was written off in 2025 to 2026.
Table 1b shows that LDT debt decreased to a very small amount (which would round to nil) at the end of 2025 to 2026. LTT debt has fluctuated between £4 million and £6 million in each of the past 6 years. Debt from unauthorised disposals grew by £0.4 million in the past year to reach £0.5 million in debt at end of 2025 to 2026. LDT statistics for quarter 4 of 2025 to 2026 provide a narrative on unauthorised disposals activity and suggest possible reasons for the increase in related debt.