
Estimated prevalence of neurodivergent people in Wales: Science Research Evidence
Estimates of the number of neurodivergent people in Wales using multiple data sources, including estimates by type of neurodivergence, age and region.
In this page
Definitions
Neurodiversity is the range of differences in individual brain function and behavioural traits which are part of normal variation in people and includes neurotypical and neurodiverse individuals.
Neurodivergence refers to the natural variation in how people's brains work, including differences in thinking, learning, and interacting.
Neurodivergence encompasses the following:
- Autism Spectrum Disorder (ASD)
- Attention-Deficit and Hyperactivity Disorder (ADHD)
- Developmental Language Disorder (DLD)
- Dyslexia, Dyscalculia
- Developmental Coordination Disorder (DCD or Dyspraxia)
- Tourette’s Syndrome
These are collectively referred to as ‘neurodevelopmental conditions (NDCs) throughout this report. Neurodevelopmental conditions can often occur alongside mental health conditions, such as anxiety or depression.
Neurotypical refers to individuals who are not neurodivergent.
‘Neurodivergence’ Language
The previous Welsh Government formally adopted the social model of disability in 2002 which manifests itself in its actions in the way in which policy is developed and delivery is approached. This means the focus is on what people can do and achieve if societal barriers are removed, rather than on what they cannot do due to their impairments. Therefore, terms containing the words conditions or disorder, which can be considered stigmatising, may not be in line with the social model of disability. However, we have used the terms provided in the data source we are referencing:
We understand some of these terms may be outdated (for example, Asperger Syndrome), and that certain language may be preferred by different individuals and organisations (such as identity-first language rather than person-first language).
Many terms such as Autism Spectrum Disorder (ASD), Autism Spectrum Condition (ASC), Asperger's, ‘on the spectrum’ now all come under the ‘autism’ umbrella and are predominantly referred to throughout this report as ASD. Similarly, although neurodivergence may be the preferred term by many; neurodivergence, neurodivergent conditions and neurodevelopmental conditions (NDCs) are used interchangeably in this report depending on the language used in the source data.
1. Headline results
Awareness and understanding of neurodivergence and neurodevelopmental conditions are increasing and services in Wales do not have the capacity to meet rising demand, particularly in accessing early support and assessment for adults and children. The findings from this report may be useful to support planning and policy assumptions of existing and future neurodevelopmental and neurodivergence services and education needs in Wales. For further detail on the below headline results (such as references, descriptions and caveats), please see the relevant parts in the main body of the report.
1.1 Prevalence of Neurodivergence in Wales
1.1.1 Official Statistics
The Pupil Level Annual School Census (PLASC), Educated other than at school (EOTAS) and Independent School Census (ISC) collect data on neurodevelopmental conditions, not all learners recorded as having a neurodevelopmental condition are formally diagnosed. where pupils have been assessed as having additional learning needs (ALN) or special educational needs (SEN) provision (referred to from hereon as ‘need’, pupils who are home-schooled are not included in this data).
Data from the 2024 to 2025 PLASC (as at January 2025) indicated that:
- 2.5% of pupils in schools reported their need as ASD
- The percentage of pupils with a need of ASD increased between 2016 to 2017 to 2024 to 2025. Between 2018 to 2019 and 2024 to 2025 inclusive, ASD has been the most common neurodivergent condition (NDC) for pupils with ALN or SEN provision in Wales
- 0.6% of all pupils in schools reported their need as ADHD
- the percentage of pupils with dyspraxia and the percentage with dyscalculia decreased slightly from 0.2% in 2016 to 2017 to 0.1% (or below) in 2024 to 2025
- the percentage of pupils with dyslexia in Wales decreased between 2016 to 2017 and 2024 to 2025 from 1.8% to 0.5%
The Lifelong Learning Wales Record (LLWR) suggests:
Between August 2023 and July 2024, around 7.8% of leaners in further education or doing an apprenticeship had a self-identified neurodivergence. The most common neurodivergence amongst these learners over the same period is dyslexia at 4.1%.
The Higher Education Statistics Agency (HESA) data suggests the following for those with a permanent address in Wales (Between 2014 to 2015 and 2023 to 2024):
The percentage of higher education student enrolments with a learning difference such as dyslexia, dyspraxia or AD(H)D (as a percentage of all higher education enrolments with a Wales permanent address) has risen from 5.5% (5,425 students) to 6.8% (7,010 students).
Over the period 2014 to 2015 to 2023 to 2024, the percentage of student enrolments with social or communication conditions (speech and language impairment or ASD) (as a percentage of all higher education enrolments with a Wales permanent address) has risen from 0.4% (360 student enrolments) to 1.1% (1,135 student enrolments).
1.1.2 Official Statistics in development
In Wales, in 2023, children receiving care and support:
- had higher rates of ASD (13%) than the general population
- had much higher rates of ASD in Ceredigion than in other local authorities in Wales
Children receiving care and support include looked after children, children on the child protection register who are not looked after, and children receiving care and support who are neither looked after nor on the child protection register. Source: StatsWales.
The figures are based on a snapshot of children who had a care and support plan in place on 31 March for at least 3 months. Source: Children receiving care and support census 2023 to 2024.
1.1.3 Administrative data
Health records in the Secure Anonymised Information Linkage (SAIL) Databank show that diagnoses of autism spectrum disorder (ASD) and attention deficit hyperactivity disorder (ADHD) have increased over time. Rates of new ASD diagnoses increased by more than 150% between 2008 and 2016. Diagnoses also increased among people aged over 35 and among women. Source: Evidence of increasing recorded diagnosis of autism spectrum disorders in Wales, UK: An e-cohort study.
A Cardiff University study using health records from 2000 to 2016 found that 0.51% of people with records in the SAIL Databank had an ASD diagnosis. This is lower than expected prevalence estimates, suggesting that many people with ASD in Wales may not have been recognised by healthcare services.
A 2023 study using SAIL health records estimated that, by their 18th birthday, 0.9% of people born in Wales in the 1990s had an ASD diagnosis and 1.4% had an ADHD diagnosis. Males were more likely than females to have an ASD diagnosis (1.5% compared with 0.4%) and an ADHD diagnosis (2.2% compared with 0.6%). Source: Can a nation-wide e-cohort of ADHD and ASD in childhood be established using Welsh routinely available datasets?.
1.1.4 Management Information
Data collected from 4 of the 7 local health boards in Wales showed that:
- between September 2018 and June 2021, the number of children and adults seeking diagnostic assessment from neurodevelopmental services was consistently higher than the number of assessments carried out
- for approximately every 2 children seeking a neurodevelopmental assessment, 1 assessment was carried out
- for approximately every 2.3 adults seeking an assessment, 1 assessment was carried out
Participating health boards:
- Aneurin Bevan University Health Board
- Cardiff and Vale University Health Board
- Hywel Dda University Health Board
- Powys Teaching Health Board
1.1.5 Further studies
The British Dyslexia Association and the Foundation for People with Learning Disabilities suggest:
- estimated rates of 10% for dyslexia, 6% for dyspraxia and 6% for dyscalculia from various UK studies
- if applied to the population of Wales, these rates would indicate:
- 319,000 people with dyslexia
- 191,000 people with dyspraxia
- 191,000 people with dyscalculia
- some individuals may have more than one neurodivergence and could therefore be included in more than one estimate
Sources:
- British Dyslexia Association: Dyslexia
- Foundation for People with Learning Disabilities: Dyspraxia
- British Dyslexia Association: Dyscalculia
- Office for National Statistics: Estimates of the population for England and Wales (2024 mid-year estimates)
1.2 Recommendations for further research
Based on the findings in this paper, the following options for further research are recommended.
Prevalence and diagnosis
- build on the previous ‘prevalence in Wales’ analysis carried out by Cardiff University using SAIL data after 2016, including the prevalence of diagnosed patients with comorbid conditions
- explore whether there are differences in prevalence rates of neurodevelopmental conditions, or recognition or diagnosis of them, across different areas of Wales and the factors that may contribute to these differences
- explore the factors leading to an increase in the recognition and diagnosis of neurodivergence to help ensure equitable access to information, resources and assessments across Wales
Assessment and services
- explore whether waiting times for neurodevelopmental condition (NDC) assessments differ across Wales and the reasons for any differences
- model future demand for neurodevelopmental services in Wales to help shape future services and target assessment capacity to reduce backlogs and waiting times
Data collection and surveys
- determine whether a representative survey of the population of Wales would provide more accurate prevalence estimates than currently available sources
- consider including a question on neurodivergence in the National Survey for Wales or the 2031 Census
- ensure consistency across data collections and definitions relating to neurodivergence across all local health boards in Wales
- investigate options for enhancing the data collected on neurodivergence among children and young people, including whether a formal diagnosis has been obtained and whether it was obtained privately or through the NHS
Education
- determine whether there is a correlation between the number of pupils being home educated and the percentage of pupils with NDCs
- consider whether there should be a mechanism to collect data on additional learning needs (ALN) or neurodivergence among electively home-educated pupils
- consider whether there should be a mechanism to collect data on ALN and neurodivergence separately so that pupils with NDCs who do not have an ALN can also be captured in the data
2. Background
The aim of this paper is to estimate the number of neurodivergent people in Wales. This includes people with an NHS diagnosis (or those on a waiting list to be assessed), those diagnosed privately, and those who self-identify, although data can be limited, particularly for those who self-identify.
It is of particular interest to determine the prevalence of each type of neurodivergence, and to establish the number and percentage of neurodivergent people in Wales by region and deprivation level.
The previous Welsh Government recognised the needs of neurodivergent people through the autism strategy first published in 2008, which led to the establishment of the National Autism Team and the introduction of the Integrated Autism Service in every Welsh region in 2016. In 2021, it also published the Statutory Code on the Delivery of Autism Services, which set out the roles and responsibilities of public bodies to help ensure the needs of autistic people are met.
Awareness and understanding of neurodivergence is increasing and existing services do not have the capacity to meet rising demand, particularly in accessing early support and assessment. On 6 July 2022, in a written statement on improvements to neurodevelopmental conditions services, the then Deputy Minister for Social Services published the summary outcomes report of the independent Review of the Demand, Capacity and Design of Neurodevelopmental Services and announced a new improvement programme backed by £12 million up to March 2025.
As part of the Neurodivergence Improvement Programme (NIP), a series of engagement events were held across Wales in 2022 to align the programme with priorities identified by neurodivergent people and their parents and carers.
In recognition of the prevalence of co-occurring neurodivergent conditions and mental health conditions, the Mental Health and Wellbeing Strategy states that services will be connected to ensure those providing mental health support have the confidence and knowledge to engage effectively with neurodivergent people who need support.
Sources
3. Prevalence of neurodivergent people, Wales
3. Education, Wales (official statistics)
3.1.1 Pupils with NDCs and ALN or SEN provision, Wales
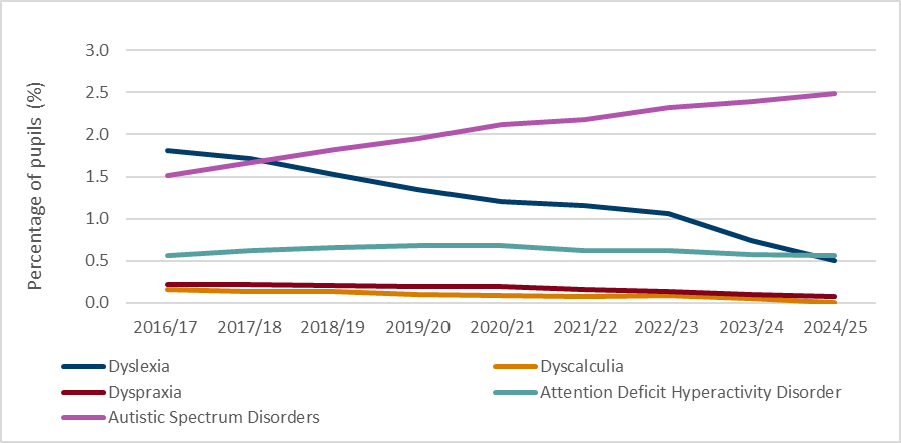
According to the PLASC and EOTAS censuses, there was an increase in the percentage of pupils with autism spectrum disorder (ASD) who also have additional learning needs (ALN) or special educational needs (SEN) provision in schools in Wales between 2016 to 2017 and 2024 to 2025. Decreases were observed in the percentage of pupils with dyslexia, dyscalculia or dyspraxia who also have ALN or SEN provision. See Table 1 and Figure 1.
A formal diagnosis is not required for a learner to be identified as having an ALN and, conversely, not all learners with a neurodevelopmental condition (NDC) diagnosis will have an ALN. Therefore, the PLASC and EOTAS data is not an accurate measure of NDCs among pupils in Wales.
Individual Development Plans (IDPs) are prepared for children with ALN, so it may be the case that not all learners recorded as having a neurodevelopmental condition in the PLASC or EOTAS census are formally diagnosed. However, the Additional Learning Needs Code states that, where there is a relevant diagnosis, it should be considered and recorded in the relevant section of the IDP (section 2A). There may be an element of professional judgement from those working with children, and approaches may vary between settings and local authorities.
Implementation of the ALN system in Wales began in September 2021. Local authorities, schools and settings made progress to move learners to the ALN system and identify and plan for their additional learning needs.
As of September 2025, the fully implemented ALN system serves as the sole statutory framework for supporting children and young people with ALN in Wales. PLASC data has shown a significant reduction in the overall number of learners with SEN or ALN since implementation of the new system.
The January 2025 PLASC, covering the 2024 to 2025 academic year, showed that the number of pupils with SEN or ALN in maintained schools had decreased since the 2017 to 2018 academic year. Some of the fall in SEN pupils over the last 3 years is due to a systematic review of SEN registers by schools.
Sources
- Schools' census results
- Schools' census results, January 2025
- The Additional Learning Needs Code
- The additional learning needs transformation programme: frequently asked questions
Table 1: Percentage of neurodivergent pupils (with ALN or SEN provision), by type of neurodivergence, by academic year, Wales [See notes below Figure 1]
| 2016 to 2017 | 2017 to 2018 | 2018 to 2019 | 2019 to 2020 | 2020 to 2021 | 2021 to 2022 | 2022 to 2023 | 2023 to 2024 | 2024 to 2025 | |
| Dyslexia | 1.8 | 1.7 | 1.5 | 1.3 | 1.2 | 1.2 | 1.1 | 0.7 | 0.5 |
| Dyscalculia | 0.2 | 0.1 | 0.1 | 0.1 | 0.1 | 0.1 | 0.1 | 0.1 | [k] |
| Dyspraxia | 0.2 | 0.2 | 0.2 | 0.2 | 0.2 | 0.2 | 0.1 | 0.1 | 0.1 |
| ADHD | 0.6 | 0.6 | 0.7 | 0.7 | 0.7 | 0.6 | 0.6 | 0.6 | 0.6 |
| ASD | 1.5 | 1.7 | 1.8 | 2.0 | 2.1 | 2.2 | 2.3 | 2.4 | 2.5 |
Source: Pupil Level Annual School Census (PLASC), Educated Other Than At School (EOTAS) and independent school census return
Figure 1: Percentage of neurodivergent pupils (with ALN or SEN provision), by type of neurodivergence, by academic year, 2016 to 2017 to 2024 to 2025, Wales [See notes]
Source
- Pupil Level Annual School Census (PLASC)
- Educated Other Than At School (EOTAS)
- Independent school census return
Notes:
- Note 1: Percentage of all pupils in maintained and independent schools with dyslexia, dyscalculia, dyspraxia, ADHD and ASD (only includes pupils with additional learning need or special educational needs provision). Pupils who are home-schooled are not included in this data.
- Note 2: From January 2017, schools were allowed to report as many special educational needs as required. For example, if types 'dyslexia' and 'dyspraxia' are reported for a pupil, that pupil is counted twice, once under each type.
- [Note 3] Further information can be found on the Schools’ census: January 2025 and the EOTAS census 2025 links.
- [Note 4] Pupils that have these conditions but do not have SEN and ALN provision are not included in the figures.
- [Note 5] The number of pupils with SEN and ALN provision has decreased since the implementation of the ALN system began.
- [Note 6] The symbol [k] means the data item is not exactly zero, but estimated as zero or less than half the final digit shown.
The percentage of pupils in schools in Wales with ASD and ALN or SEN provision increased from 1.5% in academic year 2016 to 2017 to 2.5% in academic year 2024 to 2025.
The percentage of pupils with ADHD and ALN or SEN provision increased slightly from 0.6% to 0.7% between academic year 2016 to 2017 and academic year 2018 to 2019 but then fell back to 0.6% in academic year 2021 to 2022, where it has remained until academic year 2024 to 2025.
The percentage of pupils with dyspraxia and ALN or SEN provision, and the percentage with dyscalculia and ALN or SEN provision, decreased slightly from 0.2% in academic year 2016 to 2017 to 0.1% (or below) in academic year 2024 to 2025.
The percentage of pupils with dyslexia and ALN or SEN provision in Wales decreased from 1.8% in academic year 2016 to 2017 to 0.5% in academic year 2024 to 2025.
This may be due, in part, to an increase in the number of pupils who are home-schooled, as data on NDCs is not collected for home-schooled pupils. The rate of electively home-educated pupils in academic year 2024 to 2025 is 15.3 of every 1,000 pupils, up from 1.6 of every 1,000 pupils in academic year 2009 to 2010, and the rate has increased each year since then. It may also be due to a change in the identification of the need for additional support.
Source
Pupils educated other than at school: September 2024 to August 2025
3.1.2 Lifelong Learning Wales Record (LLWR) statistics
The Lifelong Learning Wales Record (LLWR) data provides the official source of statistics on learners in further education, apprentices and the adult learning sector.
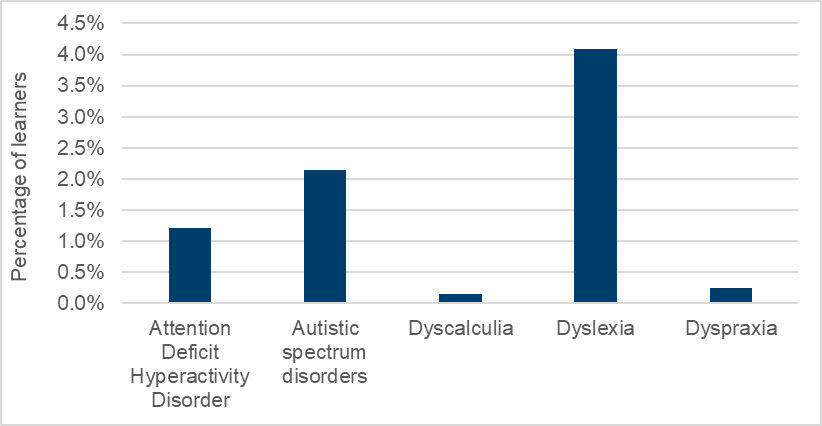
Between August 2023 and July 2024, around 7.8% of learners in further education or undertaking an apprenticeship had a self-identified neurodivergence. The most common neurodivergence amongst these learners over the same period was dyslexia at 4.1%.
Source
Table 2: Learners by learning type, and self-identified neurodivergent primary learning difficulty or disability at further education colleges and apprenticeship providers, August 2023 to July 2024 [See notes below Figure 2]
| Primary learning difficulty or disability | Number of learners | % (of all learners) |
| ADHD | 1,890 | 1.2% |
| ASD | 3,345 | 2.2% |
| Dyscalculia | 240 | 0.2% |
| Dyslexia | 6,350 | 4.1% |
| Dyspraxia | 385 | 0.2% |
| Total neurodivergent | 12,210 | 7.8% |
| Total learners in further education, apprenticeships or the adult learning sector | 155,580 | 100.0% |
Source: Lifelong Learning Wales Record (LLWR)
Figure 2: Learners by learning type, and self-identified neurodivergent primary learning difficulty or disability at further education colleges and apprenticeship providers, August 2023 to July 2024 [See notes]
Source: Lifelong Learning Wales Record (LLWR)
Notes:
- Note 1: Learners are counted once within a learning type or once altogether in the 'All' provide type category. If a learner studied in multiple learning types, apprenticeships are prioritised, then full-time education.
- Note 2: Sixth forms, local authority community learning and higher education are not included in this table.
- Note 3: Numbers are rounded to the nearest 5.
3.1.3 Higher Education Statistics Agency (HESA) statistics
HESA publish the number of student enrolments by disability, sex, level of study, mode of study, entrant marker and academic year for those with UK permanent addresses.
The Commission for Tertiary Education and Research (Medr) provided the equivalent data for students with a Wales permanent address.
Source
Table 3: Higher education student enrolments with a learning difference such as dyslexia, dyspraxia or AD(H)D, all levels (undergraduate and postgraduate) and all modes (full time and part time) of study, 2014 to 2015 to 2024 to 2025, Wales (See notes below Figure 3)
| 2014 to 2015 | 2015 to 2016 | 2016 to 2017 | 2017 to 2018 | 2018 to 2019 | 2019 to 2020 | 2020 to 2021 | 2021 to 2022 | 2022 to 2023 | 2023 to 2024 | |
| No. of student enrolments with a learning difference | 5,425 | 5,530 | 5,665 | 5,620 | 5,980 | 6,130 | 6,630 | 6,800 | 6,675 | 7,010 |
| % of student enrolments with a learning difference | 5.5% | 5.6% | 5.7% | 5.7% | 5.9% | 5.9% | 6.0% | 6.2% | 6.2% | 6.8% |
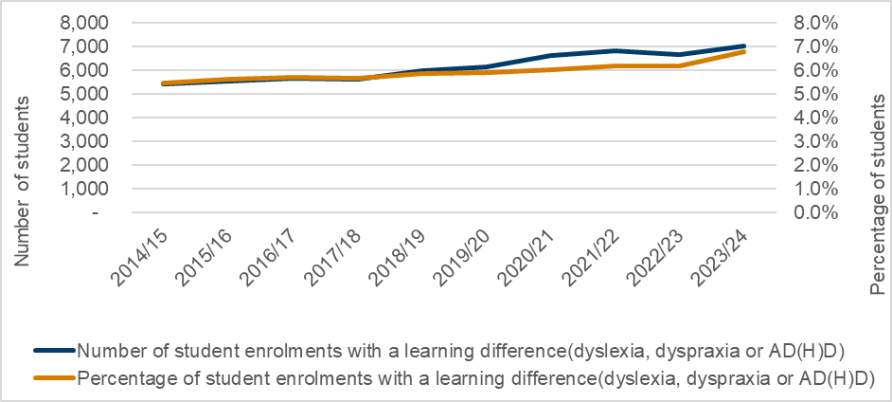
Figure 3: Higher education student enrolments with a learning difference such as dyslexia, dyspraxia or AD(H)D, all levels (undergraduate and postgraduate) and all modes (full time and part time) of study, 2014 to 2015 to 2024 to 2025, Wales [See notes]
Source: HESA (This is a Wales-version of the Table 15 open data published by HESA)
Notes:
- Note 1: HESA standard registration population
- Note 2: Students with a permanent Wales-address
- Note 3: Student numbers rounded to the nearest multiple of 5; numbers lower than 2.5 are suppressed (*)
The number and percentage of all higher education student enrolments with a permanent Wales address with a learning difference (such as dyslexia, dyspraxia or AD(H)D) increased between academic years 2014 to 2015 and 2023 to 2024.
The percentage of these students with a learning difference (as a percentage of all higher education enrolments with a Wales permanent address) increased from 5.5% (5,425 students) to 6.8% (7,010 students) over this period.
Table 4: Higher education student enrolments with social or communication conditions such as speech and language impairment or an autistic spectrum condition, all levels (undergraduate and postgraduate) and all modes (full time and part time) of study, 2014 to 2015 to 2024 to 2025, Wales
| 2014 to 2015 | 2015 to 2016 | 2016 to 2017 | 2017 to 2018 | 2018 to 2019 | 2019 to 2020 | 2020 to 2021 | 2021 to 2022 | 2022 to 2023 | 2023 to 2024 | |
| No. of student enrolments with social/ communication conditions | 360 | 430 | 490 | 565 | 730 | 870 | 945 | 1,060 | 980 | 1,135 |
| % of student enrolments with social/ communication conditions | 0.4% | 0.4% | 0.5% | 0.6% | 0.7% | 0.8% | 0.9% | 1.0% | 0.9% | 1.1% |
Source: HESA
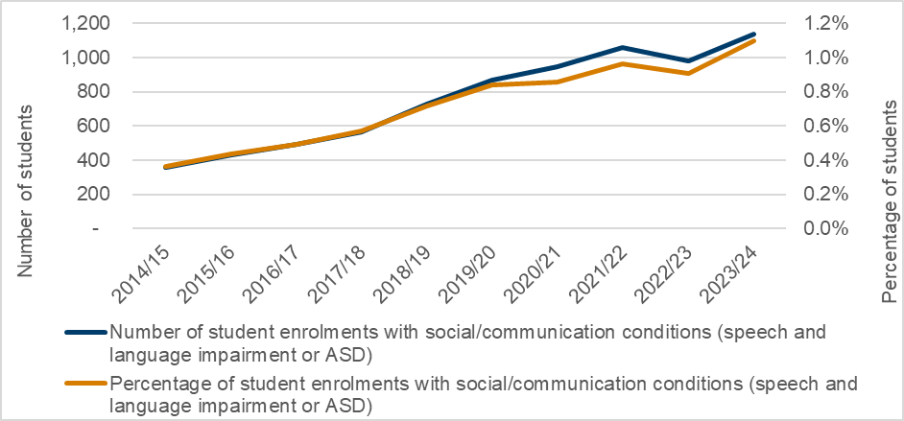
Figure 4: Higher education student enrolments with social or communication conditions such as speech and language impairment or an autistic spectrum condition, all levels (undergraduate and postgraduate) and all modes (full time and part time) of study, 2014 to 2015 to 2024 to 2025, Wales
Source: HESA
Notes:
- Note 1:HESA standard registration population
- Note 2: Students with a permanent Wales-address
- Note 3: Student numbers rounded to the nearest multiple of 5; numbers lower than 2.5 are suppressed (*)
The number and percentage of all higher education student enrolments with a permanent Wales address with social or communication conditions (speech and language impairment or ASD) increased between academic year 2014 to 2015 and academic year 2023 to 2024. However, there was a decrease from 1% (1,060 student enrolments) in academic year 2021 to 2022 to 0.9% (980 student enrolments) in academic year 2022 to 2023.
Over the period academic year 2014 to 2015 to academic year 2023 to 2024, the percentage of student enrolments with a permanent Wales address with social/communication conditions (speech and language impairment or ASD), as a percentage of all higher education enrolments with a Wales permanent address, rose from 0.4% (360 student enrolments) to 1.1% (1,135 student enrolments).
3.2 Health Board Data, Wales (Management Information)
Note that this section refers to a one-off review undertaken in 2022 of data provided by 4 of the 7 health boards in Wales:
- Aneurin Bevan University Health Board
- Cardiff and Vale University Health Board
- Hywel Dda University Health Board
- Powys Teaching Health Board
Therefore, the total numbers of children in Wales referred or accepted for an assessment is likely an underestimate.
The data in this section refers to NHS assessments, although there were some cases where NHS health boards commissioned private providers to carry out the assessment. However, cases where individuals sought their own private assessment separate to the NHS are not included in this data.
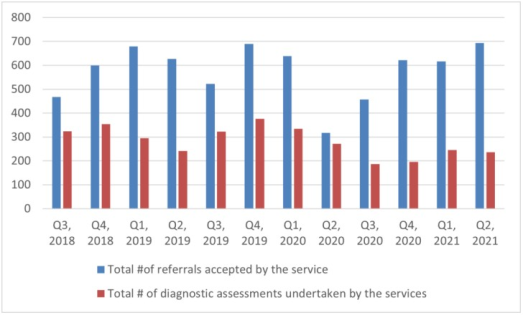
The number of children seeking diagnostic assessment from neurodevelopmental services has consistently been higher than the number of diagnostic assessments undertaken in the 4 health boards that provided data.
Both demand and activity fell during the COVID-19 pandemic, but activity remains lower than it was before the pandemic, while demand has increased again.
Over the period quarter 3, calendar year 2018 to quarter 2, calendar year 2021, 6,381 children were referred for an assessment and 3,160 assessments were undertaken. This means that, for roughly every 2 children seeking an assessment, 1 assessment was undertaken in the 4 health boards that provided data.
Source
Figure 5: The numbers of children referred to neurodevelopmental services for diagnostic assessment and the numbers of children assessed in each quarter of 2019 to 2020 and 2020 to 2021 (total for Aneurin Bevan, Cardiff and Vale and Hywel Dda University Health Boards and Powys Teaching Health Board)
Source: Aneurin Bevan, Cardiff and Vale and Hywel Dda University Health Boards and Powys Teaching Health Board
Similarly, the number of adults seeking diagnostic assessment has consistently been higher than the number of diagnostic assessments undertaken in 4 of the 7 health boards in Wales.
Both demand and activity fell during the COVID-19 pandemic. While demand remains lower than it was before the pandemic, activity has now returned to peak pre-pandemic levels.
Over the periods April 2019 to March 2020 and April 2020 to March 2021, 3,466 adults sought an assessment and 1,502 assessments were undertaken. This means that, for just over every 2 adults seeking an assessment, 1 assessment was undertaken. The ratio of adults seeking an assessment to assessments undertaken was 2.3:1.
Note that we cannot assume that the same ratio would be observed in the 3 health boards that did not provide data:
- Betsi Cadwaladr University Health Board
- Cwm Taf Morgannwg University Health Board
- Swansea Bay University Health Board
4. Prevalence of each type of neurodivergence
4.1 Autism and Autism Spectrum Disorder (ASD)
The prevalence of autism varies between sources, studies and different populations in Wales. This may be due to differences in populations (eg. patients with digital records only, school pupils, or students). Also, some studies report prevalence rates based on self-diagnoses, some include formal diagnoses only and others are based on special educational needs (SEN) or additional learning needs (ALN).
4.1.1 Pupils with ASD, Wales [Official Statistics]
According to the PLASC and EOTAS data, the proportion of children in Wales reported by schools to have Autistic Spectrum Disorder (ASD) was 2.5% in academic year 2024 to 2025.
This figure is already higher than the estimated whole population rate of around 1%. These numbers are not the same as the number of people with an autism diagnosis. They are based on research about the true figure, which is likely to be higher. More research is needed to know for sure.
There may be additional pupils in schools with ASD who do not have SEN or ALN provision.
Source: What is autism (National Autistic Society)
4.1.2 Autism rates in anonymised healthcare records, Wales [Administrative Data]
Cardiff University used the Welsh Secure Anonymised Information Linkage (SAIL), an anonymised e-cohort comprised of healthcare record data, to produce all-age estimates of prevalence and incidence of recorded autism for the years 2001 to 2016.
The number of new recorded cases of autism increased from 0.188 per 1,000 person-years in 2001 to 0.644 per 1,000 person-years in 2016.
The overall prevalence rate of autism in healthcare records was 0.51% in 2016, which is lower than suggested by population survey and cohort studies, but comparable to other administrative record study estimates.
Rates of new incident diagnoses of autism saw more than a 150% increase in the years 2008 to 2016, with a trend towards more diagnoses in those aged over 35 years and an eightfold increase in diagnoses in women from 2000 to 2016.
This study suggests that while the number of people being diagnosed with autism is increasing, many are still unrecognised by healthcare services.
A further study using healthcare records from SAIL estimated that 0.9% of those born in the 1990s in Wales had a diagnosis of ASD by their 18th birthday.
Males were more likely than females to have an ASD diagnosis, with 1.5% of males and 0.4% of females receiving such a diagnosis.
Prevalence of ASD is similar across all deprivation levels.
Sources:
- Evidence of increasing recorded diagnosis of autism spectrum disorders in Wales, UK: An e-cohort study
- Can a nation-wide e-cohort of ADHD and ASD in childhood be established using Welsh routinely available datasets?
4.1.3 Children receiving care and support with Autism Spectrum Disorder [Official Statistics in Development]
The Welsh Government collect data each year on the percentage of children receiving care and support with ASD.
The prevalence of ASD in children receiving care and support is much higher than in the general population of pupils, as shown by the PLASC and EOTAS figures above.
The prevalence of ASD in children receiving care and support increased from 10% in 2017 to 13% in 2023.
However, the percentage was higher for males than for females between 2017 and 2023 (inclusive). In 2023, the percentage of children receiving care and support with ASD was 17% for males and 7% for females.
Source: Health of children receiving care and support by measure and year
Figure 6: The proportion of children receiving care and support with ASD, Wales, 2017 to 2023, by gender
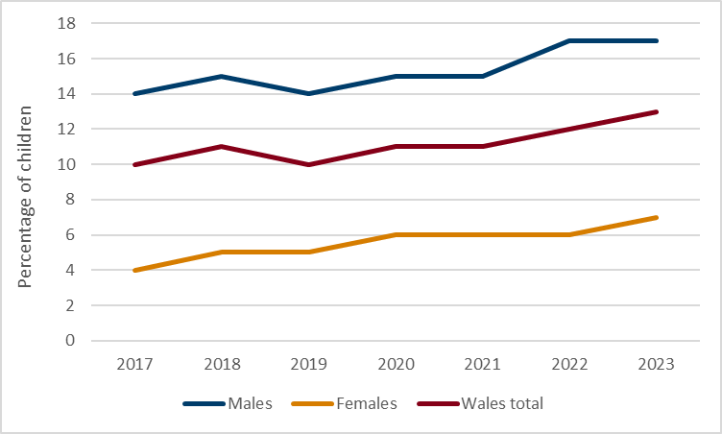
The proportion of children receiving care and support with ASD in Wales increased between 2017 and 2023 for both males and females.
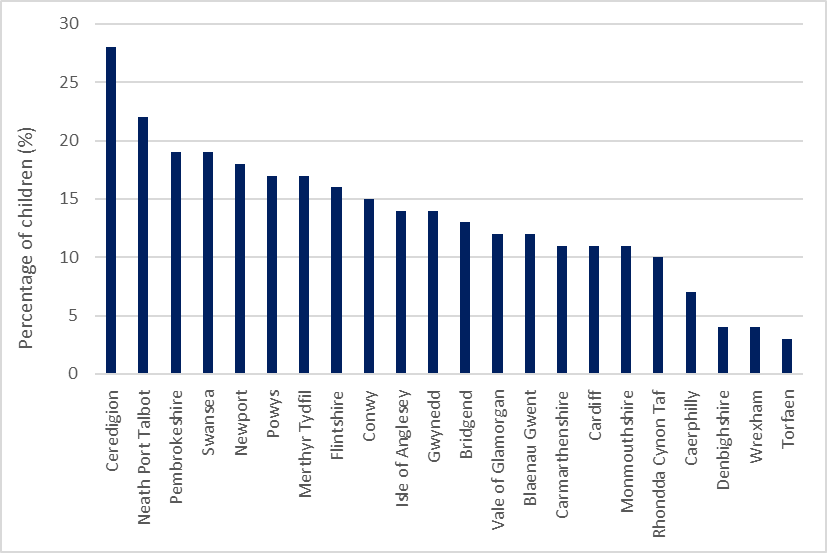
Figure 7: The percentage of children receiving care and support with ASD, Wales in 2023, by Local Authority (LA)
Source: StatsWales (official statistics in development)
In 2023, the Local Authority in Wales with the highest proportion of children receiving care and support with ASD is Ceredigion (28%). Torfaen is the Local Authority in Wales with the lowest proportion in 2023 (3%).
4.1.4 Prevalence of self-reported autism by age band, UK [Official Statistics]
The ONS published an ad hoc report in 2020 which estimated the prevalence of self-reported autism in 16 to 64-year-olds in the UK as 2.9% (95% confidence interval of 2.7% to 3.1%).
In the Annual Population Survey, respondents are asked:
“Do you have any physical or mental health conditions or illnesses lasting or expected to last 12 months or more?”
If they respond “Yes”, they are then directed to identify their condition(s) or impairment(s) from a list. “Autism (including autism spectrum condition, Asperger syndrome)” is one of the response options.
As such, the statistics do not show prevalence of autism in the general population, only those who stated that they had a condition or illness lasting 12 months or more.
Source
Table 5: Prevalence self-reported of autism among people with a long-term health condition aged 16 to 64 years, by age bands, 2020, UK
| Estimate % | Lower 95% confidence limit | Upper 95% confidence limit | Unweighted sample | |
| 16-19yrs | 17.6 | 15.7 | 19.6 | 294 |
| 20-24yrs | 10.1 | 8.7 | 11.5 | 204 |
| 25-29yrs | 6.6 | 5.5 | 7.7 | 149 |
| 30-34yrs | 3.2 | 2.5 | 4.0 | 96 |
| 35-64yrs | 0.8 | 0.7 | 1.0 | 246 |
| 16-64yrs | 2.9 | 2.7 | 3.1 | 989 |
| Source: Office for National Statistics - Annual Population Survey | ||||
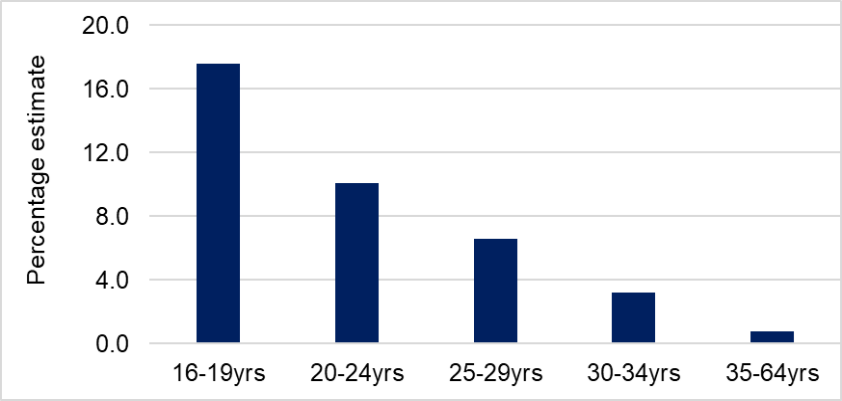
Figure 8: Prevalence of self-reported autism among people with a long-term health condition aged 16 to 64 years, by age bands, 2020, UK
Source: Office for National Statistics
In 2020, the self-reported prevalence of autism among people with long-term health conditions aged 16 to 64 in the UK decreased as the age band increased, from 17.6% of 16 to 19-year-olds to 0.8% of 35 to 64-year-olds.
Increased awareness and understanding of autism among younger adults may contribute to the substantial differences in reported prevalence by age category.
It is possible that older autistic adults could be less likely to have an autism diagnosis, know enough about autism to self-diagnose, or even consider the possibility that they are autistic. Adults may find diagnoses difficult to obtain due to the fact they have navigated life (school, relationships, employment) so far without a diagnosis.
Amongst all age groups surveyed, the question wording also requires respondents to consider their autism to be a “physical or mental health condition or illness”, or to have another condition or illness, in order to proceed with the question.
It is not possible to determine whether there is a genuine difference in autism prevalence in the population by age group from these statistics.
4.2 Attention-Deficit Hyperactivity (ADHD)
The expected rate of ADHD using a narrow definition (NHS Digital, England, 2018) is around 1% to 2%, and around 5% using a broader definition (NICE, Global, 2021).
However, censuses and studies considering subsets of populations in Wales (school pupils, students and patients with digital records only) produce a range of ADHD prevalence rates.
4.2.1 Pupils with ADHD and SEN or ALN provision
The increase in the percentage of pupils reported by schools (in PLASC and EOTAS) to have ADHD has been much lower than that observed for ASD.
The proportion of pupils with ADHD and SEN or ALN provision stood at 0.6% in academic year 2024 to 2025. This is lower than the proportion of pupils with ASD and SEN or ALN provision (2.5% in academic year 2024 to 2025).
4.2.2 ADHD rates in anonymised healthcare records, Wales (Administrative Data)
A study using healthcare records from SAIL estimated that 1.4% of those born in the 1990s in Wales had a diagnosis of ADHD by their 18th birthday.
Males were more likely than females to have an ADHD diagnosis, with 2.2% of males and 0.6% of females receiving such a diagnosis.
While matched on age and sex, those with ADHD came from slightly more deprived backgrounds than their matched controls.
Sources
- PowerPoint Presentation (NHS Digital)
- Prevalence Background information
- Attention deficit hyperactivity disorder (NICE)
4.3 Dyslexia
It's estimated that up to 1 in every 10 people in the UK has some degree of dyslexia.
This would equate to around 319,000 people in Wales in mid-2024.
There is limited data available on the number of people in Wales with dyslexia. However, the PLASC and EOTAS census indicates that 0.5% of children in Wales had a recognised ALN or SEN need of dyslexia in academic year 2024 to 2025 (see Table 1 and Figure 1). This excludes data from electively home-educated pupils.
The LLWR indicates self-diagnosed prevalence rates of 1.2% among students in further education colleges and apprenticeship providers in academic year 2023 to 2024 (see Table 2 and Figure 2).
This may mean that many pupils and students with dyslexia are not being recognised.
There is a section within the existing Specific learning difficulties (SpLD) Framework to help teachers identify learners in Wales who may have dyslexia and make appropriate adjustments to teaching practice and school and classroom environments, so these learners do not risk falling behind other pupils in their class.
A formal diagnosis is not required to ensure support is provided to a learner when they need it, and support should not be delayed whilst waiting for a diagnosis if needs and relevant support can be identified.
It is difficult to determine the age distribution of those with a dyslexia diagnosis.
A study used secondary data from the UK’s Millennium Cohort Study to examine the socio-demographic factors that predict whether a child’s teacher identifies them as dyslexic at age 11.
Gender, season of birth, socio-economic class and parental income are found to be significant predictors of the dyslexia label.
Therefore, factors seemingly unrelated to the clinical aspects of dyslexia influence whether a child is identified as dyslexic in England and Wales. This suggests that identification may not be evenly distributed across a population. Furthermore, it may indicate that resources for support may not be fairly allocated.
Sources
- Dyslexia – British Dyslexia Association
- Specific learning difficulties framework
- Millennium Cohort Study analysis on predictors of dyslexia identification
4.4 Dyscalculia
According to the British Dyslexia Association, an estimated 6% of all children, adolescents and adults have dyscalculia.
However, the school censuses (PLASC, EOTAS and independent school censuses) show that less than 0.1% of pupils had dyscalculia and SEN or ALN provision in academic year 2024 to 2025.
This may mean that many pupils with dyscalculia are not being recognised.
Source
4.5 Dyspraxia
It is thought dyspraxia affects up to 6% of the UK population (equating to 191,000 people in Wales), with up to 2% being severely affected.
Males are 4 times more likely to be affected than females.
The school censuses (PLASC, EOTAS and independent school censuses) show that 0.1% of pupils had dyspraxia and SEN or ALN provision in academic year 2024 to 2025.
This may mean that many pupils with dyspraxia are not being recognised.
However, dyspraxia is recognised as a significant condition affecting both children and adults in the UK, including Wales.
Source
5. Conclusion
The prevalence of specific neurodevelopmental conditions across Wales is difficult to accurately determine.
There is not one universal data source, such as a relevant question in a census for Wales or a national survey, that can (or necessarily should) be used in isolation to estimate the number of people in Wales with each NDC.
Instead, prevalence of NDCs can only be estimated using numerous sources.
Each source shows slightly different metrics. For example, one source may relate only to pupils based on the school census, while another may relate to the wider population based on healthcare records. These sources have been detailed throughout the paper.
Taken together, they can be used to estimate a range for the number or percentage of people in Wales with an NDC.
By understanding the prevalence of NDCs in Wales, including prevalence within particular regions and among people with different characteristics, such as age and gender, suitable policy recommendations can be made to help ensure the best outcomes for individuals with NDCs in Wales.
6. Appendix
6.1 Data sources used within the report:
This report draws on a number of sources including official statistics, management information, administrative data and research (described below). The sources used within this report are summarised below:
Pupil Level Annual School Census (PLASC) and Independent School Census
Pupils with a recognised need (ALN or SEN) for their type of neurodivergence from the annual census of maintained schools in Wales (including data from independent schools).
Type: Official statistics
Producer: Welsh Government
Educated Other than at School (EOTAS)
Pupils receiving Education Other than at School (EOTAS), including at Pupil Referral Units (PRU) with a recognised need for their type of neurodivergence.
Type: Official statistics
Producer: Welsh Government
Annual Population Survey
Prevalence of autism among people with a long-term health condition aged 16 to 64 years.
Type: Official statistics
Producer: Office for National Statistics (ONS)
Lifelong Learning Wales Record (LLWR)
The LLWR data provides the official source of statistics on learners in further education, apprentices and in the adult learning sector including those with self-identified neurodivergence.
Type: Official statistics
Producer: The Commission for Tertiary Education and Research (Medr)
Higher Education Statistics Agency (HESA)
Data about higher education (HE) in the UK including student enrolments for those with permanent Wales addresses and neurodivergence
Type: Official statistics
Producer: Higher Education Statistics Agency (HESA)
Healthcare records within the SAIL Databank
A study using data in SAIL to determine ASD prevalence in Wales.
A study using data from the Welsh Secure Anonymised Information Linkage Databank in Wales, UK. Routinely collected data from primary care, emergency department and hospital admissions were linked at person level.
Type: Administrative data
Producer: Cardiff University using existing administrative data
Health of children receiving care and support
The Census collected individual records on all children receiving care and support, including those looked after by a local authority. Data is collected that measures the characteristics and attributes of children receiving care and support.
Type: Official statistics in development
Producer: Welsh Government
Neurodevelopmental services waitlist size
The number of people in Wales on an NHS waiting list for neurodevelopmental services.
Type: Management information
Producer: Local health boards
Autism prevalence
A statement on the National Autistic Society website stating the prevalence of people on the autism spectrum.
Type: Not applicable
Producer: National Autistic Society
ADHD estimates
The estimate of the percentage of people (all ages) Wales. This is estimated using UK studies on children and on adults and by using the prevalence within the studies and the populations of the UK nations (using ONS population estimates from 2022)
Type: Not applicable
Producer: ADHD UK
Dyslexia and dyscalculia prevalence
The percentage of people in the population with dyslexia or dyscalculia.
Type: Not applicable
Producer: British Dyslexia Association
Dyspraxia prevalence
The percentage of people in the population with dyspraxia.
Type: Not applicable
Producer: Foundation for People with Learning Disabilities (part of London South Bank University)
Review of the Demand, Capacity and Design of Neurodevelopmental Services: Full Report
The current position, including demand for neurodevelopmental services and their capacity to meet demand.
Type: Management information
Producer: Holtom, D and S Lloyd-Jones (2022). Full Report. Cardiff: Welsh Government, GSR report number 47/2022.
Official statistics
Official statistics are statistics produced by Crown bodies and other organisations listed within an Official Statistics Order, on behalf of the UK government or devolved administrations.
They provide a factual basis for assessment and decisions on economic, social and environmental issues at all levels of society.
Official statistics in development
Official statistics in development are official statistics that are undergoing development. They may be new or existing statistics and will be tested with users, in line with the standards of trustworthiness, quality and value in the Code of Practice for Statistics.
Until September 2023, they were known as experimental statistics.
Administrative data
Administrative data is information created when people interact with public services, such as schools, the NHS, the courts or the benefits system, and collated by government.
These public bodies must keep records of these interactions for operational purposes, to:
- enable them to carry out their day-to-day work
- monitor and improve their performance
- continue providing services effectively
Management information
Management information is data or statistics collected and used to measure performance in given areas of a business, and drive change for improvement where needed.