Mid year estimates of the population: 2025
Mid-year population estimates for Wales by local authority, age and components of population change.
In this page
Introduction
The Office for National Statistics (ONS) has published mid-2025 population estimates for Wales and England. This bulletin refers specifically to estimates for Wales.
All data in this report are from mid-year estimates taken on 30 June of the relevant year. When we refer to estimates for 2025, for example, this means mid-2025 estimates, or estimates as at 30 June 2025. Data in this release mainly refer to 30 June 2025, with comparisons to the previous year (30 June 2024).
Estimates for 2022 to 2024 have been revised by the ONS to incorporate improved international migration data.
More information about the impact of the revisions are in the ONS bulletin 'Population estimates for England and Wales: mid-2025'.
The population estimates for Wales have been revised downwards to:
- 3,132,700 in 2022, a decrease of 1,500 (0.05%) from the previously published estimate
- 3,165,100 in 2023, a decrease of 2,300 (0.07%) from the previously published estimate
- 3,177,900 in 2024, a decrease of 8,600 (0.27%) from the previously published estimate
Main points
- Around 3,175,200 people were living in Wales, a small decrease of 0.1%, around 2,800 fewer people; this is the first decrease in population since between 2014 and 2015.
- The recent population decrease has been driven by negative natural change and decreasing net international migration.
- Over a fifth of people were aged 65 or older (22.2%, or 705,100 people).
- Newport saw the largest percentage population increase (up 0.7%).
- There was a population increase of 0.4% in England for the same period.
Figure 1: population estimates for Wales, 1995 to 2025 [Note 1] [Note 2]
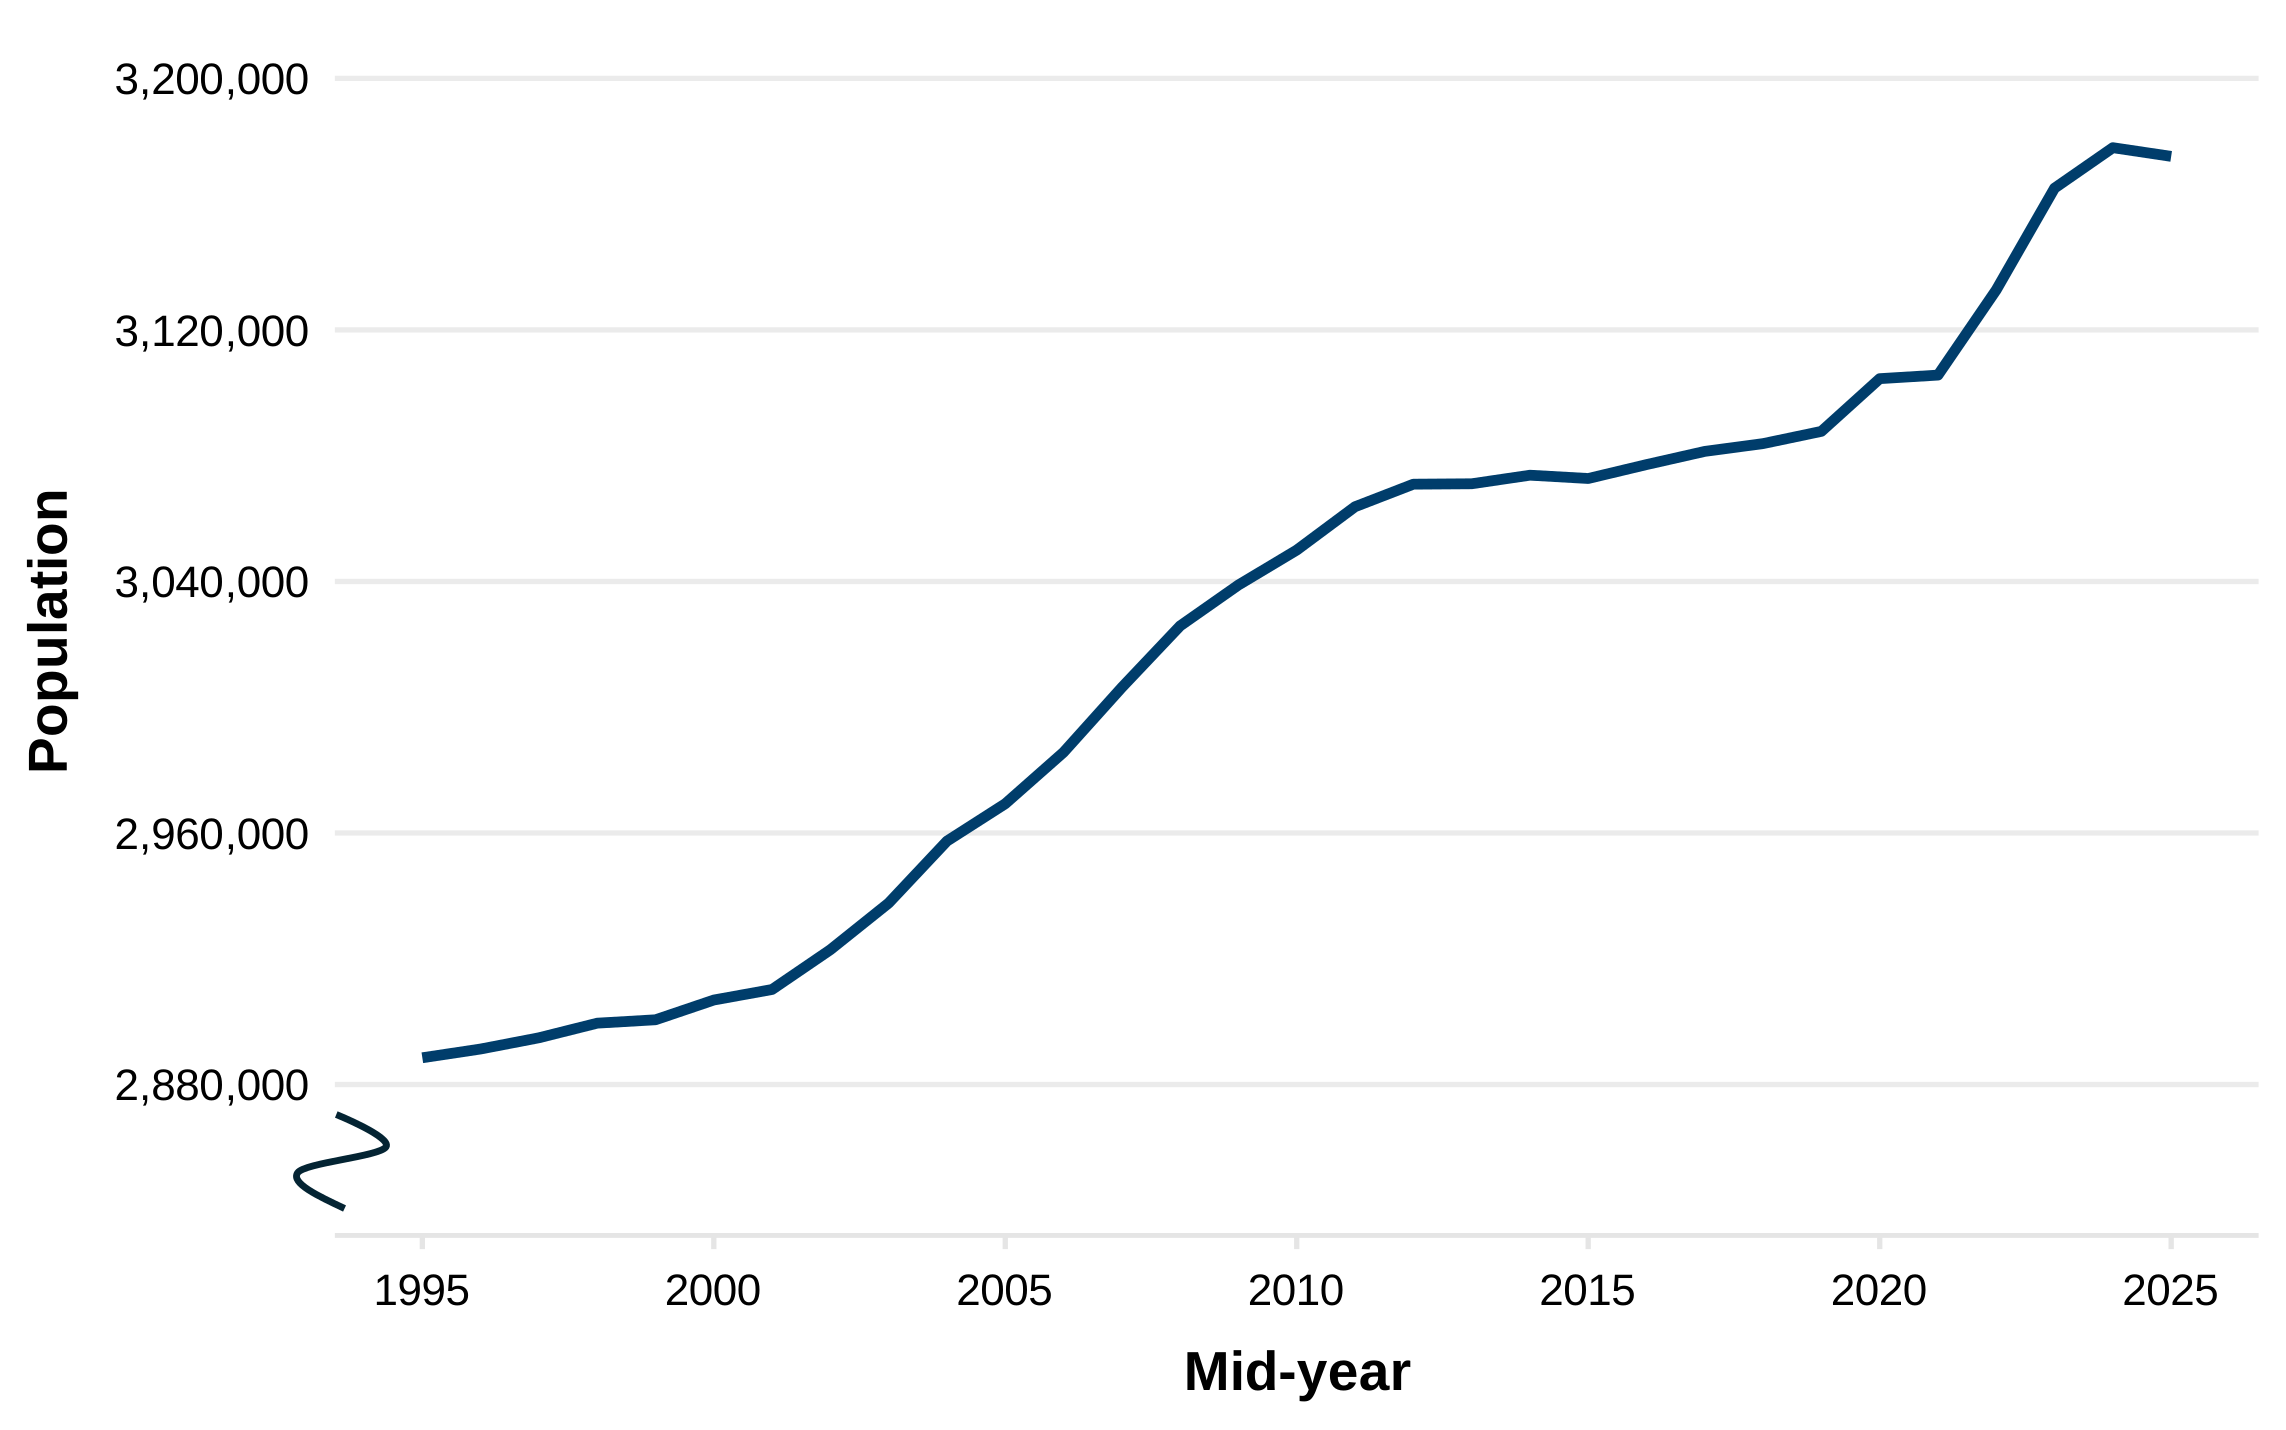
Description of figure 1: this line chart shows that, since 1995, the population of Wales is estimated to have increased from 2.89 million to 3.18 million by 2025. Since 2021, the population has risen more sharply before decreasing in the latest year.
Source: Population estimates from the ONS.
[Note 1] The figures for 2022 to 2024 have been revised.
[Note 2] The y axis on this chart does not start at zero.
Components of population change
Components of population change are the factors that contribute to population change. This includes births and deaths, commonly referred to as natural change, and net migration.
Net migration
Net migration is the difference between the number of people coming to live in an area (immigration) and the number of people leaving to live elsewhere (emigration).
When more people are coming into the area than leaving, net migration is above zero and so adds to the population.
Net migration takes account of both international and internal migration.
Internal migration
Internal migration is movements between local authorities in the UK.
International migration
International migration is movements between Wales and the other countries of the world outside the UK.
Figure 2: net internal and international migration estimates for Wales, 2005 to 2025 [Note 1]
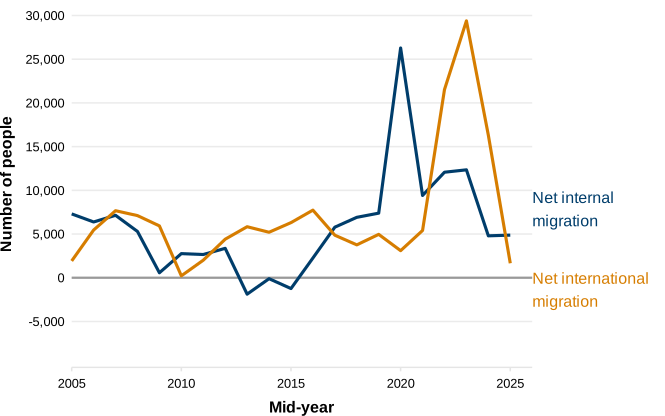
Description of figure 2: this line chart shows that net international migration has decreased by nearly 90% in 2025 compared with the previous year. Net internal migration increased slightly in 2025 compared with the previous year. Since 2020, migration patterns have changed. Net internal migration peaked during the start of the COVID-19 pandemic, while net international migration has been greater than net internal migration in the years since 2021 to 2024. In the latest year, net international migration was lower than net internal migration.
Source: Population estimates from the ONS.
[Note 1] The figures for 2022 to 2024 have been revised.
Net international migration to Wales was around 1,700 between 2024 and 2025. This is a decrease of nearly 90% compared with the previous year. It is at its lowest level since 2010.
The 'long-term international migration, provisional: year ending December 2025' release from the ONS explains how, at the UK level, net migration has declined. This is because fewer non-EU+ nationals arrived on work-related visas.
Net internal migration to Wales from the other UK nations, was around 4,900 between 2024 and 2025. This is a slight increase (up by 1.6%) from the previous year (4,800).
Figure 3: births and deaths in Wales, 2005 to 2025 [Note 1]
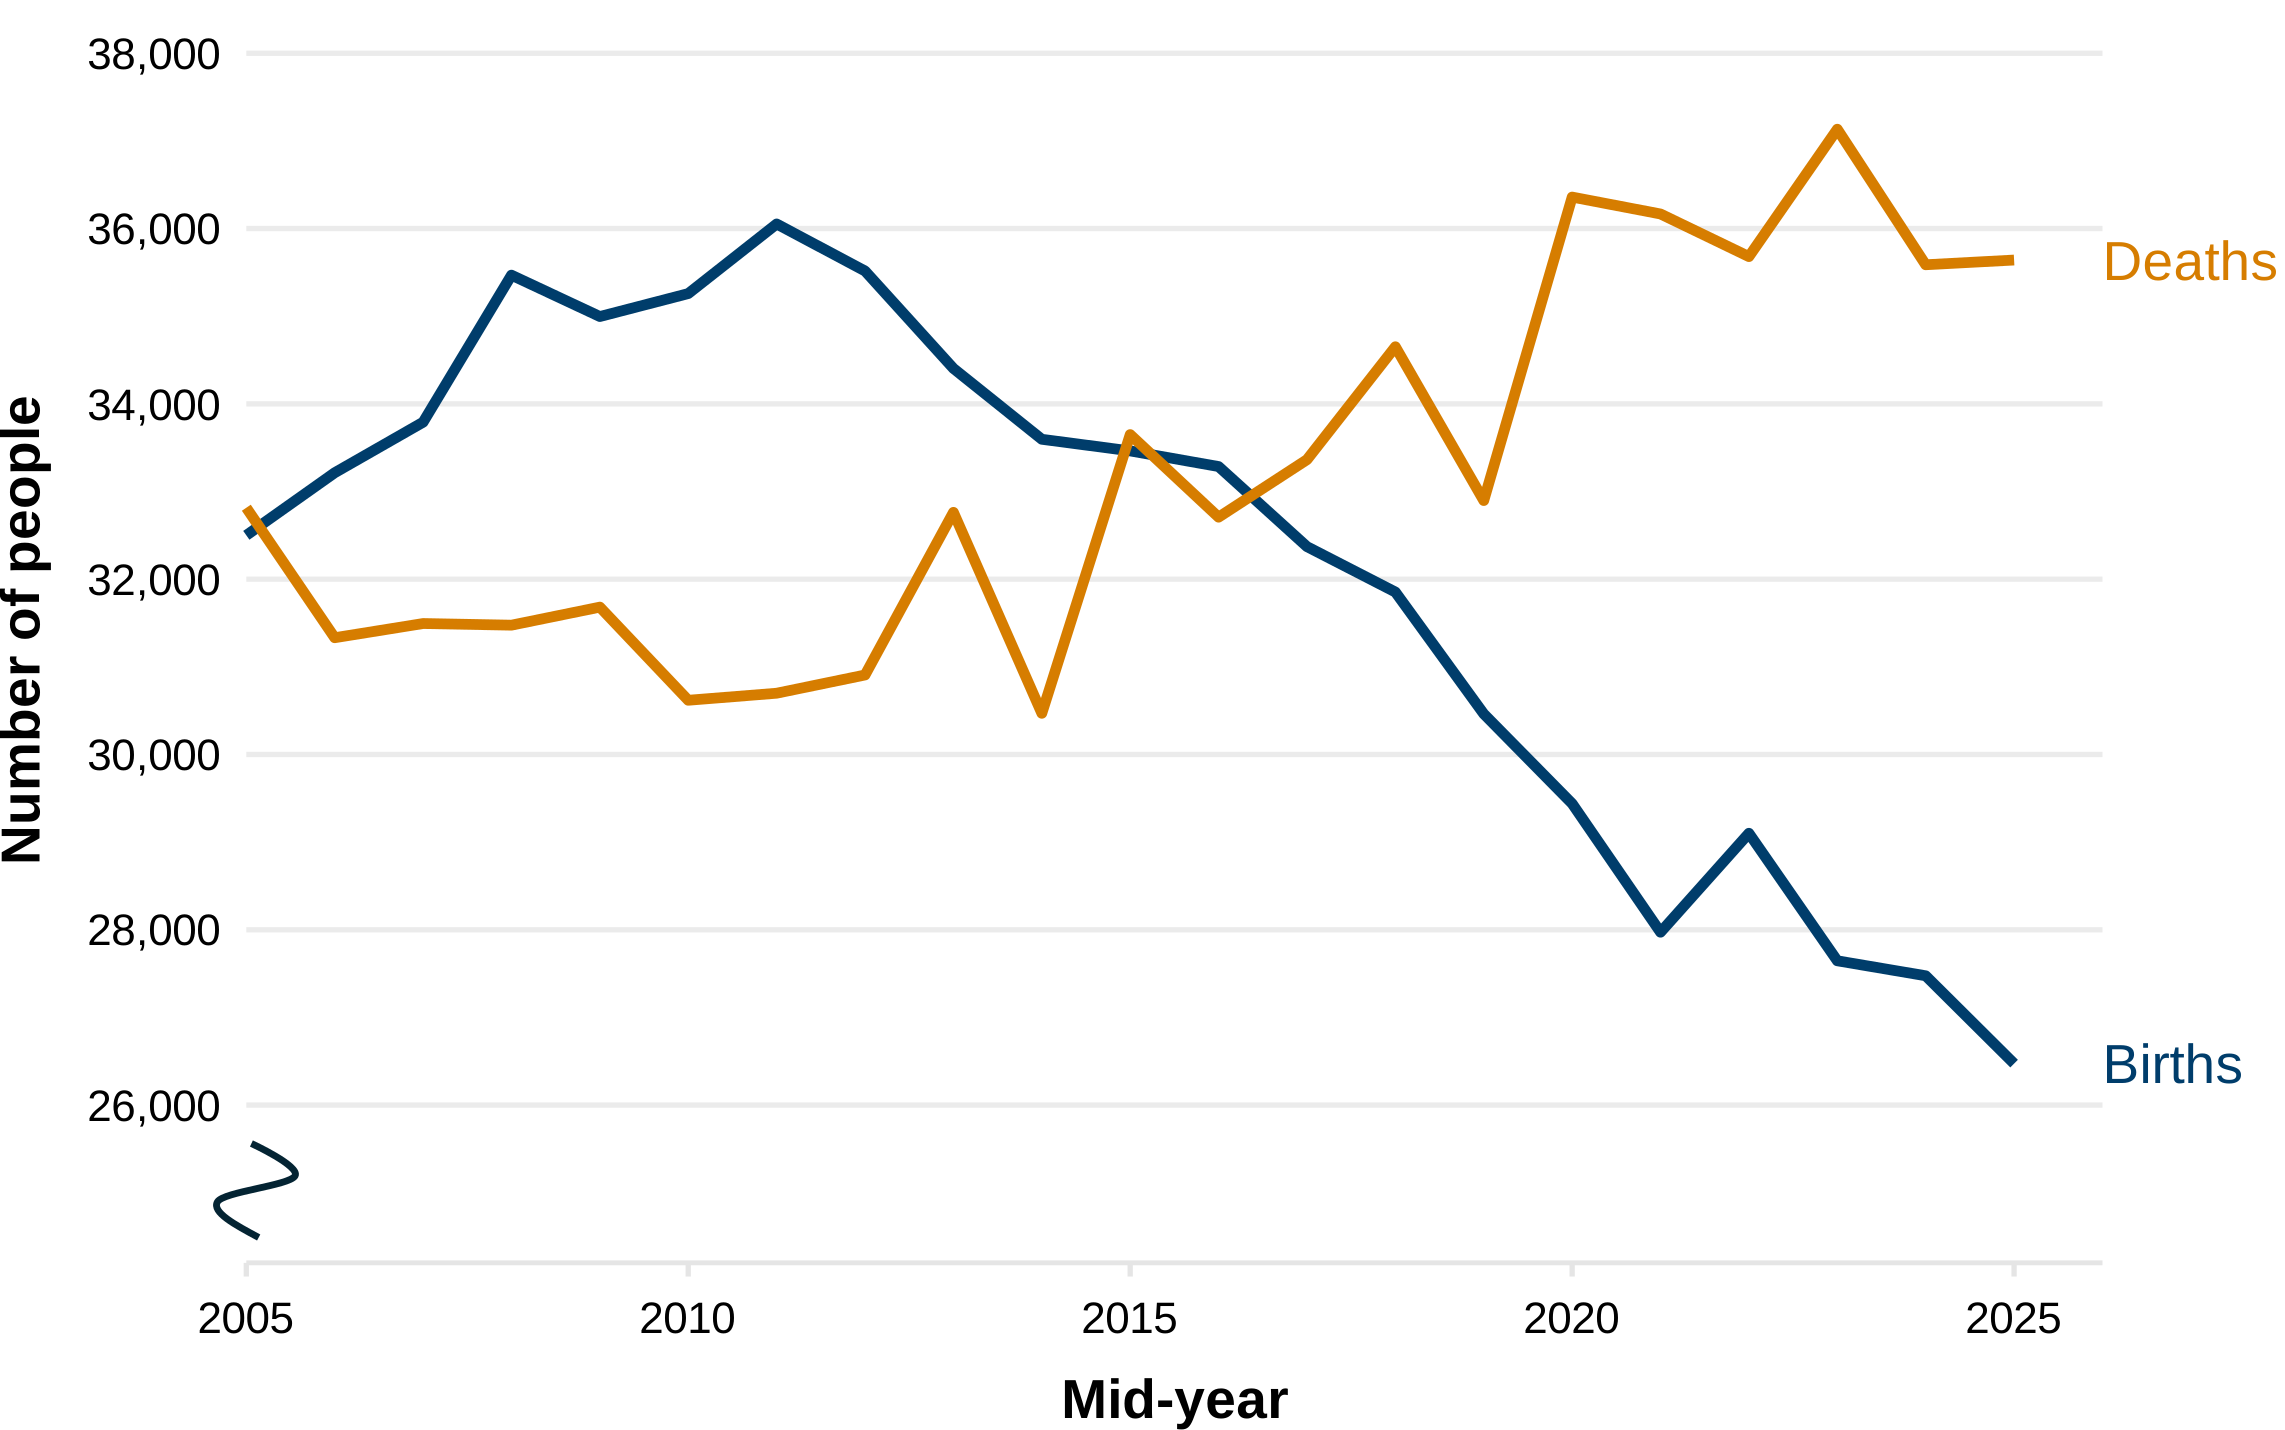
Description of figure 3: this line chart shows that, between 2006 and 2017, the number of births was higher than the number of deaths. Since that period, the number of deaths has outnumbered the number of births. Since 2011, the number of births has steadily decreased. The number of deaths has been increasing generally during the same period.
Source: Population estimates from the ONS.
[Note 1] The y axis on this chart does not start at zero.
Between 2024 and 2025, there continued to be more deaths than births, or negative natural change. There were around 35,600 deaths between 2024 and 2025.
The number of births between 2024 and 2025 was around 26,500, a decrease of around 1,000 compared with the previous year.
Population by age
Figure 4: population broad age group, 2005 to 2025 [Note 1]
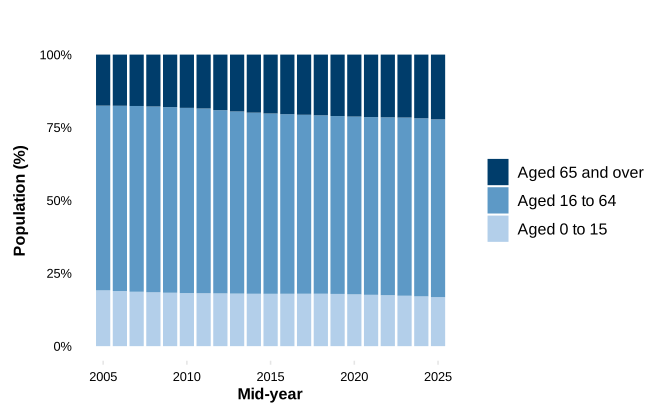
Description of figure 4: this stacked bar chart shows that, since 2005, the percentage of the population aged 65 years or older has increased, while the percentage of children and young people aged 0 to 15 years old has decreased slightly. The percentage of people aged 16 to 64 years old has also decreased slightly during the same period.
Source: Population estimates from the ONS.
[Note 1] The figures for 2022 to 2024 have been revised.
Over a fifth of people were aged 65 or older (22.2%, or 705,100 people) in 2025. Since 2015, the number of people aged 65 or older has increased by 13.6%. The number of people aged 75 years or older has increased by over a quarter during the same period, up 26.0%. This increased from around 276,400 people in 2015 to around 348,300 people in 2025.
61.0% of the population were aged 16 to 64 years old in 2025, around 1,936,200 people. This number has increased by 1.9% since 2015.
The remaining 16.8% of the population were children and young people aged 0 to 15 (around 533,900). This has decreased by 3.2% since 2015.
Population by local authority
These estimates are subject to statistical uncertainty, particularly for smaller geographic areas and detailed age-sex breakdowns. The ONS has published research-based measures of statistical uncertainty alongside the estimates, which can be found in the accompanying datasets.
You can use the interactive tool on the ONS website to view the latest population estimates, and measures of statistical uncertainty, for your local area.The population decreased in all but 7 of the 22 local authorities between 2024 and 2025. The largest increases were in:
- Newport (0.7% increase)
- Denbighshire (0.4% increase)
- Monmouthshire (0.2% increase)
The largest decreases were in:
- Merthyr Tydfil (0.6% decrease)
- Swansea (0.5% decrease)
- Neath Port Talbot (0.4% decrease)
Cardiff and Newport were the only local authorities who saw more births than deaths between 2024 and 2025.
7 out of the 22 local authorities saw positive net international migration between 2024 and 2025. 16 out of 22 local authorities saw positive net internal migration.
Figure 5: percentage population change in Wales between 2024 and 2025, by local authority
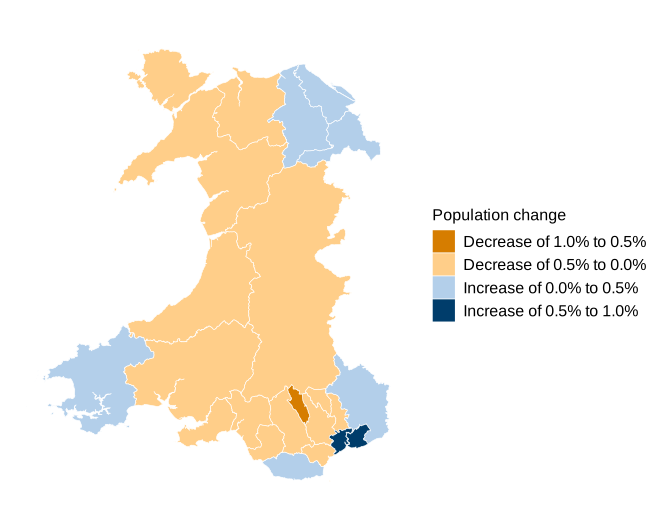
Description of figure 5: this map shows that Newport and Denbighshire have seen the largest percentage increase in their population between 2024 and 2025.
Source: Population estimates from the ONS.
Admin-based population estimates
On 4 March, the ONS published its quarterly update on population and migration statistics. Within this article, it said that admin-based population estimates were not being adopted as official estimates of the population.
It concluded that established methods for the mid-year population estimates should continue to be used, following a review against the published decision criteria and the announcement of a census in 2031. These methods are outlined in the population estimates for England and Wales, mid-2025: methods guide (ONS). Using the established methods will ensure that population estimates can be produced reliably, with efficient and sustainable systems and processes.
The ONS will be moving to a model of continuous improvement of the population estimates, drawing on the research and experiences of developing ABPEs. They will make iterative improvements to the data and methods that underpin the components of population change, with a focus on internal migration and disaggregation of long-term international migration estimates to local authority level. More information can be found in the quarterly update on population and migration statistics (ONS).
Population estimates for the UK
UK population estimates, mid-2025
The ONS aims to publish a full set of UK population estimates (ONS) for 2025 in autumn 2026. This will include estimates for Northern Ireland, produced by the Northern Ireland Statistics and Research Agency, and estimates for Scotland, produced by National Records of Scotland. Scotland’s population estimates for 2025 (National Records of Scotland) were published on 14 July. Northern Ireland’s population estimates for 2025 are due to be published in September to October.
Quality and methodology information
Mid-year population estimates
Population estimates are produced using the cohort component method. This is a standard demographic method that estimates the size of the population using the components of population change, like the census estimate, to update a population base. These are accredited official statistics (Office for Statistics Regulation (OSR)).
A limitation of the cohort component method used to produce population estimates is that they are subject to statistical uncertainty related to:
- the measurement of the census base they are rolled forward from
- the measurement of each component of population change
Statistical uncertainty is lowest immediately following a census, and greatest immediately before the next census. This is because errors accumulate over time as estimates are rolled forward onto the following year. To find out more see population estimates for England and Wales quality and methods guide (ONS).
Usually resident population
These data estimate the ‘usually resident population’. This is the standard United Nations definition outlined on page 40 in the Principles and Recommendations for Population and Housing Censuses (UN). It only includes people who reside in a country for 12 months or more, making them usually resident in that country. Visitors and short-term migrants are excluded.
Official statistics status
All official statistics should show the standards of the Code of Practice for Statistics (UK Statistics Authority).
The mid-year estimates of the population are accredited official statistics, published by the ONS. They comply with the standards of trustworthiness, quality and value in the Code of Practice for Statistics. On 11 May 2026, the OSR published a compliance check of mid-year population estimates for England and Wales.
It is the Welsh Government’s responsibility to maintain compliance with the standards expected of accreditation. If we become concerned about whether these statistics are still meeting the appropriate standards, we will discuss any concerns with OSR promptly. Accreditation can be cancelled or suspended at any point when the highest standards are not maintained, and reinstated when standards are restored.
Accredited official statistics are called National Statistics in the Statistics and Registration Service Act 2007.
Statement of compliance with the Code of Practice for Statistics
Our statistical practice is regulated by the OSR. OSR sets the standards of trustworthiness, quality and value in the Code of Practice for Statistics that all producers of official statistics should adhere to.
All of our statistics are produced and published in accordance with a number of statements and protocols to enhance trustworthiness, quality and value. These are set out in the Welsh Government’s Statement of Compliance.
These accredited official statistics (OSR) demonstrate the standards expected around trustworthiness, quality and public value in the following ways.
Quality
Mid-year estimates of the population are produced by the Office for National statistics. Quality assurance of the population estimates for Wales is performed by Welsh Government statisticians. The statistical bulletin is then drafted, signed off by senior statisticians and published in line with the statement on confidentiality and data access which is informed by the trustworthiness pillar contained in the Code of Practice for Statistics (UK Statistics Authority).
For further information about how these accredited official statistics, published by the ONS, demonstrate the standards expected around trustworthiness, quality and public value, see the Population estimates for England and Wales quality and methods guide (ONS).
You are welcome to contact us directly with any comments about how we meet these standards. Alternatively, you can contact OSR by emailing regulation@statistics.gov.uk or via the OSR website.
Well-being of Future Generations Act (WFG)
The Well-being of Future Generations Act 2015 is about improving the social, economic, environmental, and cultural wellbeing of Wales. The Act puts in place seven wellbeing goals for Wales. These are for a more equal, prosperous, resilient, healthier, and globally responsible Wales, with cohesive communities and a vibrant culture and thriving Welsh language. Under section (10)(1) of the Act, the Welsh Ministers must (a) publish indicators (“national indicators”) that must be applied for the purpose of measuring progress towards the achievement of the wellbeing goals, and (b) lay a copy of the national indicators before Senedd Cymru. Under section 10(8) of the Well-being of Future Generations Act, where the Welsh Ministers revise the national indicators, they must as soon as reasonably practicable (a) publish the indicators as revised and (b) lay a copy of them before the Senedd. These national indicators were laid before the Senedd in 2021. The indicators laid on 14 December 2021 replace the set laid on 16 March 2016.
Information on the indicators, along with narratives for each of the wellbeing goals and associated technical information is available in the Wellbeing of Wales report.
As a national indicator under the Act, they must be referred to in the analyses of local wellbeing produced by public services boards when they are analysing the state of economic, social, environmental, and cultural wellbeing in their areas.
The Act states national milestones must be set that “…the Welsh Ministers consider would assist in measuring whether progress is being made towards the achievement of the wellbeing goals.” In doing so Welsh Ministers must specify how we know that a national milestone has been achieved and the time by which it is to be achieved.
National milestones are not performance targets for any individual organisation but are collective measures of success for Wales.
Some of the national indicators and national milestones use the mid-year estimates of the population as denominators, to calculate rates, for example.
Further information on the Well-being of Future Generations (Wales) Act 2015.
The statistics included in this release could also provide supporting narrative to the national indicators and be used by public services boards in relation to their local wellbeing assessments and local wellbeing plans.
Contact details
Population and census statistics
Email: stats.popcensus@gov.wales
Media: 0300 025 8099
SFR 64/2026