
Science Research Evidence: winter modelling 2026 to 2027 - Part 7: annex
This paper provides modelled scenarios for influenza, COVID-19 and respiratory syncytial virus (RSV) for the upcoming winter season.
In this page
Retrospective analysis of scenarios
The admissions projections published in the Science Research Evidence: winter modelling 2025 to 2026 were compared with the recent admissions data received for the 2025 to 2026 winter period from DHCW to assess the performance of the models.
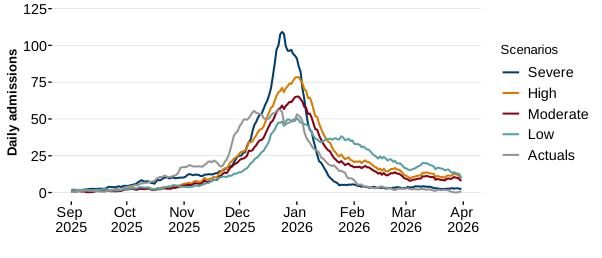
Overall, the analysis suggests the scenarios tracked closely with:
- the ‘High Season, VU = 60%’ scenarios for RSV
- the ‘Moderate’ scenarios for COVID-19 and flu
The modelled peaks for these scenarios were extremely close to the observed admissions (‘Actuals’).
However, the observed flu season did begin earlier than expected.
Figure A1: Comparison of daily influenza admissions scenarios vs actuals in Wales between September 2025 and March 2026
Source: Digital Health and Care Wales and SRE calculations
The Influenza admissions Severe scenario estimated a peak of 109 admissions in the last week of December while the High, Moderate and Low scenarios estimated a peak of 78, 65 and 51 admissions respectively during the first week of January 2026. The actual admissions showed an early rise compared to previous seasons and a peak of 56 admissions in the third week of December (22 to 23 December 2025).
Figure A2: Comparison of paediatric (ages 0 to 4 years) daily RSV admissions scenarios vs actuals between September 2025 and March 2026
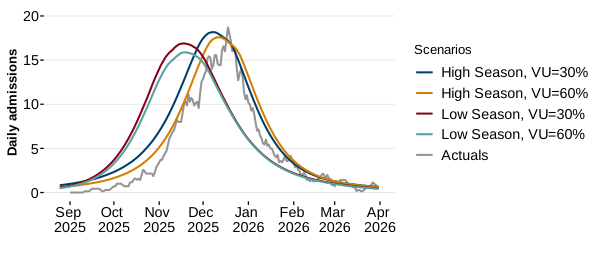
RSV admissions scenarios for ages 0 to 4 years old indicated a projected peak of 16 to 18 admissions between 18 November and 11 December 2025. The actuals peak showed 19 admissions on 18 December 2025.
Figure A3: Comparison of daily RSV admissions in older adults (ages 75 to 79 years) scenarios vs actuals between September 2025 and March 2026
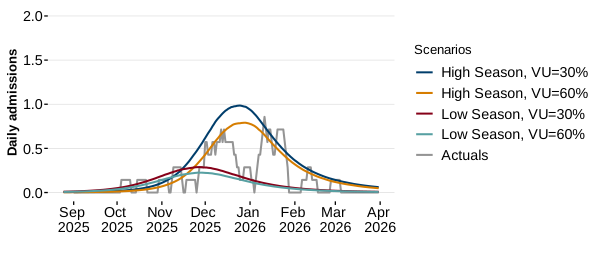
RSV admissions scenarios for ages 75 to 79 years indicated a projected peak of 1 admission late December 2025. The actuals peaked at 3 daily admissions on 15 January 2026.
Figure A4: Comparison of COVID-19 daily admissions scenarios vs actuals between September 2025 and March 2026
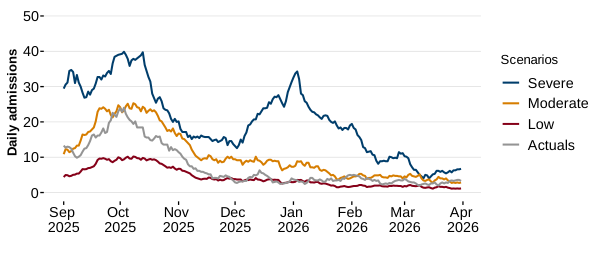
The Severe COVID-19 admissions scenario projected a peak of 40 admissions on 3 October, while the Moderate and Low scenarios projected peaks of 25 and 10 admissions, respectively, on 8 October 2025. Actual admissions showed a peak at of 24 admissions on 3 October 2025, before declining steadily throughout the winter.
Figure A5: Comparison of combined daily admissions scenarios vs actuals between September 2025 and March 2026
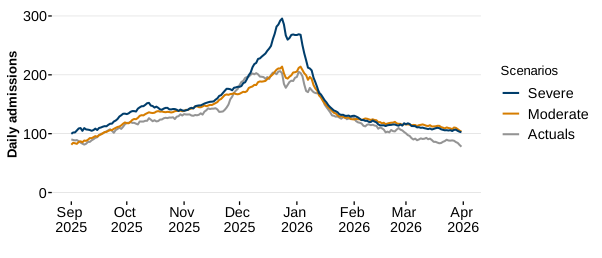
The combined scenarios assess the collective impact of influenza, RSV, COVID-19 and other viral infections. The Severe scenario projected a peak of 296 admissions on 24 December 2025, while the Moderate scenario projected a peak of 214 admissions on the same date. The actuals tracked closely with the Moderate scenario peaking at 209 admissions on 24 December 2025.
Data Sources
Table A1
| Data source | Definition | Data Provider |
| PEDW dataset (hospital admissions) | The primary source for hospital admissions and bed occupancy data, derived from the Patient Episode Database for Wales (PEDW). ICD-10-coded; includes day cases. Subject to coding lag of several months, meaning 2025 to 2026 figures may be underestimated at the time of publication. In this report, the analysis uses: hospital admissions for flu, RSV, COVID-19 or other infections (See Tables A10-A13 for ICD-10 codes used in any diagnosis position) between 1 April 2018 and 31 March 2026. | DHCW (Digital Health and Care Wales) |
| ICNET (hospital admissions) | Public Health Wales laboratory-confirmed multiplex PCR testing data. Inpatients only; excludes day cases. Used as the observed data (‘actuals’) comparator during the live winter period due to lower data lag than PEDW. In this report, the analysis uses: hospital admissions for flu, RSV, COVID-19 or other infections with a confirmed lab test between 1 April 2018 and 31 March 2026. | Public Health Wales (PHW) |
| GP Sentinel Surveillance | A monitoring programme covering a subset of GP practices in Wales, reporting ARI consultation rates weekly. Results are standardised per 100,000 practice population. Not a census, individual practices report voluntarily, and rates should be interpreted as indicators rather than precise prevalence estimates. In this report, the analysis uses: Daily GP consultation rates due to all acute respiratory infections between 1 April 2018 and 31 March 2026 for those aged 0 to 14 years and those aged 15 years and above. | Public Health Wales |
| 111 calls | Daily number of 111 calls, breathing difficulties, and cardiac or respiratory arrest that were answered between 1 July 2021 and 31 March 2026 | Welsh Ambulance Service University Trust (WAST) |
| Emergency Department (ED) attendances | In this report, the analysis uses daily ED attendances due to respiratory problems. | DHCW (Digital Health and Care Wales) |
| Ambulance (999) calls | Daily number of verified incidents due to breathing problems between 1 April 2021 and 31 March 2026. | Welsh Ambulance Service University Trust (WAST) |
| Flu virology (testing) data | Daily number of samples (in a sentinel and hospital setting) between 1 April 2018 and 31 March 2026 for Flu A (H3N2), Flu A (H1N1), Flu B, Influenza A (untyped) | Public Health Wales |
Descriptions of Modelling Scenarios used throughout the report
Combined ARI admissions and occupancy scenarios descriptions (Figures 2 to 5)
Table A2: details of scenarios used in the creation of combined MLS admissions and occupancy scenarios.
| Infection | Scenario and season | Description |
|---|---|---|
| Influenza | Scenario C (2024 to 2025 winter, baseline vaccine coverage) | Model fit to 2024 to 2025 winter season (which was H1N1 dominant) with baseline vaccine uptake assumptions |
| RSV | Scenario B (Baseline coverage) | Model fit to data between 1 April 2023 and 31 March 2026, with baseline vaccine uptake assumptions in pregnant women and older adults |
| COVID-19 | Scenario B (Repeat of Winter 2025 to 2026) | Repeat data from the 2025 to 2026 winter season |
| Other infections | Three-year average | Average of 2023 to 2024, 2024 to 2025, and 2025 to 2026 winter season |
Table A3: details of scenarios used in the creation of combined reasonable worst case (RWC) admissions and occupancy scenarios.
| Infection | Scenario | Description |
|---|---|---|
| Influenza | Scenario A (2022 to 2023 winter, low vaccine coverage) | Model fit to 2022 to 2023 winter season (when both H1N1 and H3N2 were dominant) with baseline vaccine uptake assumptions |
| RSV | Scenario A (Low coverage) | Model fit to data between 1 April 2023 and 31 March 2026, with low vaccine uptake assumptions in pregnant women and older adults |
| COVID-19 | Scenario A (Repeat of Winter 2023/24) | Repeat data from the 2023 to 2024 season |
| Other infections | Three-year average | Average of 2023 to 2024, 2024 to 2025, and 2025 to 2026 winter season |
Flu admissions and occupancy scenarios descriptions (Figures 6 to 9)
A flu compartmental transmission model was constructed to generate projections of medium-term flu hospital admissions in Wales.
The model was calibrated using historical admissions data from previous seasons and used to simulate various scenarios that incorporate different assumptions about vaccine uptake.
An age‑stratified deterministic compartmental transmission model with a fixed population size and non-random age-specific mixing was used to simulate transmission and associated hospital admissions in Wales.
The model structure was based on a modified SEIR framework and is designed to capture both infection dynamics and vaccination effects across heterogeneous age groups. Further information can be found in the flu compartment model technical report.
Table A4: Descriptions for flu admission and occupancy scenarios
| Scenario name | Scenario | Description |
|---|---|---|
| Scenario A | Repeat of 2022 to 2023 data, low vaccine coverage | 2022 to 2023 winter season (when both H1N1 and H3N2 were dominant) with low vaccine uptake assumptions (20% lower than observed uptake) |
| Scenario B | Repeat of 2022 to 2023 data, baseline vaccine coverage | 2022 to 2023 winter season (when both H1N1 and H3N2 were dominant) with baseline vaccine uptake assumptions (observed vaccine uptake) |
| Scenario C | Repeat of 2024 to 2025 data, baseline vaccine coverage | 2024 to 2025 winter season (when H1N1 was dominant) with baseline vaccine uptake assumptions (observed vaccine uptake) |
| Scenario D | Repeat of 2023 to 2024 data, high vaccine coverage | 2023 to 2024 winter season (when H1N1 was dominant) with high vaccine uptake assumptions (20% higher than observed vaccine uptake) |
Descriptions of RSV scenarios
To generate admissions and occupancy scenarios, the previously published compartment transmission model was updated and calibrated to three seasons of admissions data (2023 to 2024, 2024 to 2025 and 2025 to 2026 winters, two of which included seasons after the vaccination campaign started).
An update was published by the Welsh Government in February 2026 stating that the RSV vaccination programme was to be expanded.
The effects of vaccinating adults over the age of 80 were also included from April 2026 assuming they will show similar uptake rates as ages 75 to 79 during the first year of vaccination.
The vaccine uptake rates among target groups (pregnant women and older adults) were varied between 20% above and below the observed coverage and the scenarios were created.
RSV admissions and occupancy scenarios descriptions (Figures 10 to 17)
Table A5: Descriptions of RSV admission and occupancy scenarios
| Scenario name | Scenario | Description |
|---|---|---|
| Scenario A | Low vaccine coverage | Model fit to data between 1 April 2023 and 31 March 2026. Vaccine uptake rate assumed to be 20% higher than baseline vaccine coverage |
| Scenario B | Baseline vaccine coverage | Model fit to data between 1 April 2023 and 31 March 2026. Baseline vaccine coverage assumes a repeat of from the uptake rates during 2025/26. |
| Scenario C | High vaccine coverage | Model fit to data between 1 April 2023 and 31 March 2026. Vaccine uptake rate assumed to be 20% higher than baseline vaccine coverage |
Descriptions of COVID-19 Scenarios (Figures 18 to 21)
Statistical modelling techniques were used to project future COVID-19 admission and occupancy scenarios for the winter of 2026 to 2027.
Scenarios C and B correspond to repeats of data from the 2023 to 2024 and 2024 to 2025 winters. respectively, whilst Scenario A is based on SARIMA modelling.
Table A6: Description of COVID-19 admission and occupancy scenarios
| Scenario name | Scenario | Description |
|---|---|---|
| Scenario A | SARIMA | Model fit to SARIMA modelling |
| Scenario B | Repeat of 2025 to 2026 data | Model fit to 2025 to 2026 winter season |
| Scenario C | Repeat of 2023 to 2024 data | Model fit to 2023 to 2024 winter season |
GP consultation rate scenarios descriptions (Figures 22 to 25)
To make the data comparable between GP practices of different sizes, consultation numbers are standardised: that is, adjusted so that a large practice and a small one can be placed side by side fairly.
This is done by dividing the number of consultations by the practice population, the number of patients registered with those practices, and scaling the result to a common denominator.
The resulting measure is the consultation rate, expressed as consultations per 100,000 registered patients.
Rates are reported separately for 2 age categories:
- children (ages 0 to 14)
- adults (15 years and above)
Expressing the data in this way also allows the 2 age groups to be compared directly, despite there being far more adults than children in the population.
To create scenarios for GP consultation rates, the following statistical techniques were used.
The same 3 techniques are applied to both groups, allowing the children’s and adults scenarios to be read on a common basis.
Table A7: Descriptions of GP consultation rate scenarios
| Scenario name | Scenario | Description |
|---|---|---|
| Scenario A | Repeat of 2022 to 2023 data | Model fit to 2022 to 2023 winter season |
| Scenario B | Prophet | Model fit to Prophet modelling using data from September 2023 to March 2026 |
| Scenario C | SARIMA | Model fit to SARIMA modelling using data from September 2023 to March 2026 |
Scenario A applies the observed 2022/23 winter profile, the highest in the available series, to the 2026 to 2027 period and represents a reasonable worst case.
Scenarios B and C are statistical forecasts fitted to the full September 2023 to March 2026 series and reflect a continuation of the recent downward trend.
The three scenarios are not predictions of what will happen; they describe a plausible range within which the coming winter is likely to fall and are intended to support planning across that range.
Note that, the consultation rate between 15 April 2022 and 18 April 2022 is not available.
Stepped values have been imputed for those days, stepping from the 14 April 2022 average to the 19 April 2022 average.
111 call scenarios descriptions (Figures 26 and 27)
Table 8a: Descriptions of 111 calls due to respiratory problems
| Scenario name | Scenario | Description |
|---|---|---|
| Scenario A | Repeat of 2023 to 2024 data | Model fit to 2023 to 2024 winter season |
| Scenario B | Mean of past five winters | Model fit to past five winters (2021 to 2022 to 2025 to 2026) |
| Scenario C | Prophet | Model fit to Prophet modelling |
ED attendance scenarios descriptions (Figures 28 and 29)
Table A8: Descriptions of ED attendance scenarios
| Scenario name | Scenario | Description |
| Scenario A | Repeat of 2022 to 2023 data | Model fit to 2022 to 2o23 winter season |
| Scenario B | Prophet | Model fit to Prophet modelling |
| Scenario C | Exponential smoothening | Model fit to Exponential smoothening |
Ambulance (999 calls) scenarios descriptions (Figures 30 and 31)
Descriptions of Ambulance (999 calls) Scenarios (Figures 30 and 31)
The three scenarios are not predictions of what will happen, rather they describe a plausible range within which the coming winter is likely to fall and are intended to support planning across that range.
Table A9: Descriptions of ambulance calls due to breathing problems scenarios
| Scenario name | Scenario | Description |
|---|---|---|
| Scenario A | Repeat of 2022 to 2023 data | Model fit to 2022 to 2023 winter season |
| Scenario B | Average of 2024 to 2025 and 2025 and 2026 data | Model fit to average of 2024 to 2025 and 2025 to 2026 winter seasons |
| Scenario C | SARIMA | Model fit to SARIMA modelling using data from April 2022 to March 2026 |
ICD-10 codes used
This report uses the same pathogen-specific ICD-10 codes as used in the previous 2025 to 2026 winter modelling report.
These codes are narrower than those used in previous winter modelling reports (from before the 2025 to 2026 winter modelling report), to improve concordance with the ICNET multiplex testing dataset (which uses PCR testing to confirm the causative pathogen).
Pneumonia (J12 to J18) and acute bronchitis/bronchiolitis (J20 to J22, excluding RSV codes), previously included under influenza, are now categorised under 'Other infections'.
The following ICD-10 codes along with their description are included in the following tables (Table A10 toA13)):
Table A10: Descriptions of ICD-10 Codes used for flu
| ICD-10 code | Description |
|---|---|
| J09.X1 | flu due to identified novel flu A virus with pneumonia |
| J09.X2 | flu due to identified novel flu A virus with other respiratory manifestations |
| J09.X3 | flu due to identified novel flu A virus with gastrointestinal manifestations |
| J09.X9 | flu due to identified novel flu A virus with other manifestations |
| J10.00 | flu due to other identified flu virus with unspecified type of pneumonia |
| J10.01 | flu due to other identified flu virus with the same other identified flu virus pneumonia |
| J10.08 | flu due to other identified flu virus with other specified pneumonia |
| J10.1 | flu due to other identified flu virus with other respiratory manifestations |
| J10.2 | flu due to other identified flu virus with gastrointestinal manifestations |
| J11.00 | flu due to unidentified flu virus with unspecified type of pneumonia |
| J11.08 | flu due to unidentified flu virus with other specified pneumonia |
| J11.1 | flu due to unidentified flu virus with other respiratory manifestations |
| J11.2 | flu due to unidentified flu virus with gastrointestinal manifestations |
Table A11: Descriptions of ICD-10 Codes used for RSV
| ICD-10 code | Description |
|---|---|
| J12.1 | Respiratory syncytial virus pneumonia |
| J20.5 | Acute bronchitis due to respiratory syncytial virus |
| J21.0 | Acute bronchiolitis due to respiratory syncytial virus |
| B97.4 | Respiratory syncytial virus as the cause of diseases classified elsewhere |
Table A12: Descriptions of ICD-10 Codes used for COVID-19
| ICD-10 code | Description |
|---|---|
| U07.1 | COVID-19, virus identified. |
| U07.2 | COVID-19, virus not identified. |
| U09.9 | Post COVID-19 condition, unspecified |
| U10.9 | Multisystem inflammatory syndrome associated with COVID-19, unspecified |
Table A13: Descriptions of ICD-10 Codes used for ‘Acute LRI not classified as due to flu, RSV or COVID-19 (in the combined scenarios modelling)
| ICD-10 code | Description |
| J12.0 | Adenoviral pneumonia |
| J12.2 | Parainfluenza virus pneumonia |
| J12.3 | Human metapneumovirus pneumonia |
| J12.8 | Other viral pneumonia |
| J12.9 | Viral pneumonia, unspecified |
| J13 | Pneumonia due to Streptococcus pneumoniae |
| J14 | Pneumonia due to Haemophilus influenzae |
| J15 | Bacterial pneumonia, not elsewhere classified |
| J16.0 | Chlamydial pneumonia |
| J16.8 | Pneumonia due to other specified infectious organisms |
| J17 | Pneumonia in diseases classified elsewhere |
| J18 | Pneumonia, unspecified organism |
| J20.0 | Acute bronchitis due to Mycoplasma pneumoniae |
| J20.1 | Acute bronchitis due to Haemophilus influenzae |
| J20.2 | Acute bronchitis due to streptococcus |
| J20.3 | Acute bronchitis due to coxsackievirus |
| J20.4 | Acute bronchitis due to parainfluenza virus |
| J20.6 | Acute bronchitis due to rhinovirus |
| J20.7 | Acute bronchitis due to echovirus |
| J20.8 | Acute bronchitis due to other specified organisms |
| J20.9 | Acute bronchitis, unspecified |
| J21.1 | Acute bronchiolitis due to human metapneumovirus |
| J21.8 | Acute bronchiolitis due to other specified organisms |
| J21.9 | Acute bronchiolitis, unspecified |
| J22 | Unspecified acute lower respiratory infection |
Table A14: Descriptions of ICD-10 Codes used for ‘Other infections of interest’ (in the combined scenarios modelling)
| ICD-10 code | Description |
| B05 | Measles |
| B06 | Rubella (German measles) |
| A08.1 | Acute gastroenteropathy due to Norovirus |
| A37 | Whooping cough |
| B95.0 | Streptococcus, group A, as the cause of diseases classified elsewhere |
| A40.0 | Sepsis due to Streptococcus, group A |
| A38.9 | Scarlet fever, uncomplicated. |
| B97.8 | Other viral agents as the cause of diseases classified elsewhere |