NHS activity and performance summary: July and August 2026
Includes data on NHS waiting times, emergency departments, cancer services, and ambulance services.
In this page
Introduction
A monthly summary of NHS Wales activity and performance. Long term trends are explored in our annual reports, Trends in NHS urgent and emergency care activity and Trends in NHS planned care activity.
Data are provided by Digital Health and Care Wales (DHCW) and Welsh Ambulance Services University NHS Trust (WAST). Data for each topic area are also available in more detail on StatsWales.
Many of the statistics presented here are based on targets and performance standards established by the previous government. We will continue to report on this basis until those targets and standards are replaced or revised.
Analysis of trends at health board level is provided in a separate data dashboard which is published alongside this report.
Main points
Emergency services (August)
In August there were 947 purple calls to the ambulance service, around 2.6% of all calls, and 4,710 red calls, around 13.0% of all calls.
For patients in cardiac arrest for whom resuscitation was attempted, 19.7% had a return of spontaneous circulation (ROSC) at the time of arrival to hospital, a decrease compared with the previous month.
The median response time for purple calls was 7 minutes 24 seconds, shorter than the previous month. The median response times for red calls was 9 minutes 2 seconds, shorter than the previous month. The target for median response to both purple and red calls is 6 to 8 minutes, meaning the target for purple calls was met and the target for red calls was not.
In August there were just under 97,700 attendances to all emergency departments, an average of 3,151 attendances per day; this was 204 fewer attendances per day on average than in the previous month.
Performance against the four-hour target worsened but improved against the twelve-hour target when compared with the previous month.
The average time spent in emergency departments was longer than the previous month at 2 hours and 58 minutes.
Treatment waiting lists (July)
There were just under 709,700 referral to treatment (RTT) patient pathways waiting to start treatment, an increase of around 11,300 since June. This is the fourth consecutive monthly increase. The number of patient pathways is not the same as the number of individual patients, because some people have multiple open pathways. More information is available in the 'Chief statistician’s update: explaining NHS activity and performance statistics'.
Management information suggests there were about 555,200 individual patients on treatment waiting lists.
The proportion of pathways waiting less than 26 weeks decreased to 65.7% in July. The number of pathways waiting longer than 36 weeks increased to just over 172,400.
Just over 4,700 pathways were waiting more than two years, 93.3% lower than the peak and an increase of 649 (15.9%) from the previous month.
The average time patients had been waiting for treatment at the end of July was 0.4 weeks longer than the previous month at 16.3 weeks.
Provisional data for August indicate an increase in total pathways waiting and an increase in pathways waiting more than 2 years.
There were just over 12,500 pathways waiting longer than one year for their first outpatient appointment, an increase from the previous month, and 87.8% less than the peak in August 2022.
Diagnostics and therapies (July)
Diagnostics patient pathways waiting decreased to just under 118,700 in July. The number waiting longer than 8 weeks (the target maximum wait) decreased to just under 37,500.
For therapies, pathways waiting increased to just under 65,800, the highest figure on record, and the number waiting longer than 14 weeks (the target maximum wait) increased to just over 6,800.
Cancer services (July)
2,248 people started their first definitive treatment in July, 119 more than the previous month. The number of patients informed they did not have cancer decreased to 15,052. Performance against the 62 day target improved in July, rising to 60.1%.
Ambulance calls
Until July 2025, 999 ambulance calls were categorised as red (immediately life-threatening), amber (serious but not life-threatening) or green (non-urgent).
On 1 July a new response model was implemented, and 2 new response categories were introduced to replace the previous red category. The new categories are:
- purple: Arrest, for cardiac and respiratory arrests
- red: Emergency, for major trauma and other incidents where patients are at significant risk of cardiac or respiratory arrest if they do not receive a rapid response
On 2 December 2025, 3 new categories replaced the previous amber and green categories. These are:
- orange: Now, for serious conditions
- yellow: Soon, for people who need to be assessed first
- green: Planned, for less urgent calls
Data up to June 2025 based on the previous response model will remain available on StatsWales, however they are not comparable with the new measures. A wider range of quality indicators will be published by the NHS Wales Joint Commissioning Committee. The 'Chief Statistician’s update: explaining NHS activity and performance statistics' provides more information on the background to the new ambulance performance measures.
Activity
Figure 1: number of purple and red emergency ambulance calls, by month [Note 1]
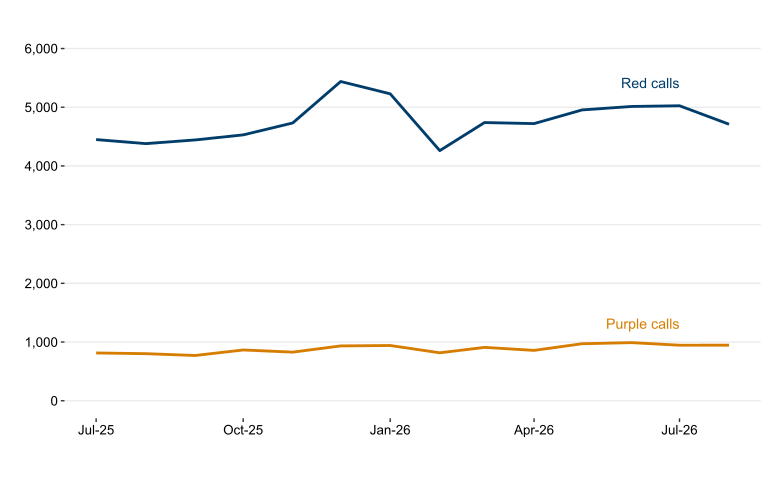
Description of figure 1: a line chart showing the number of purple calls is relatively stable but red calls have been more changeable over time.
Source: Welsh Ambulance Services University NHS Trust
[Note 1]: Detailed definitions for the measures are provided in the accompanying quality report.
Ambulance activity and performance measures, on StatsWales
In August, 947 purple calls were received by the ambulance service (around 2.6% of all calls), a slight increase compared with July. 4,710 red calls were received (around 13.0% of all calls), a decrease compared with July.
There were:
- 12,566 orange calls
- 5,456 yellow calls
- 1,482 green calls
Performance
Figure 2: return of spontaneous circulation (ROSC) rate, by month [Note 1]
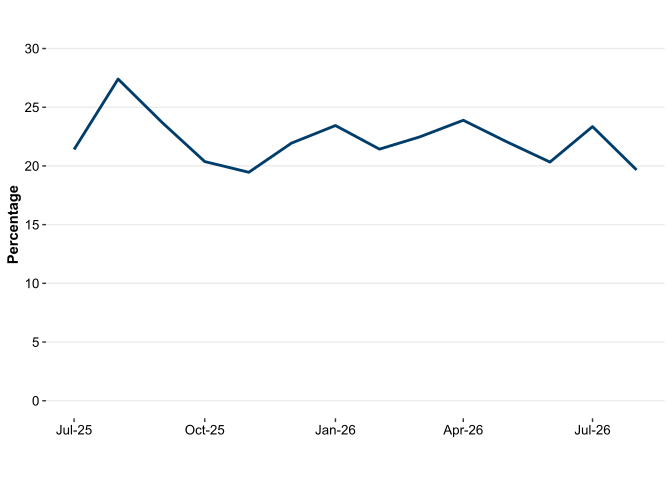
Description of figure 2: a line chart showing return of spontaneous circulation rates has generally fluctuated between 20% and 30%.
Source: Welsh Ambulance Services University NHS Trust
[Note 1]: Detailed definitions for the measures are provided in the accompanying quality report.
Ambulance activity and performance measures, on StatsWales
For patients in cardiac arrest for whom resuscitation was attempted, 19.7% had a return of spontaneous circulation (ROSC) at the time of arrival to hospital, a decrease compared with the previous month.
Targets
- For purple and red calls the median and 90th percentile response time targets are 6-8 minutes and under 20 minutes respectively.
Figure 3: median and 90th percentile response times for purple and red emergency ambulance calls (minutes and seconds), by month [Note 1]
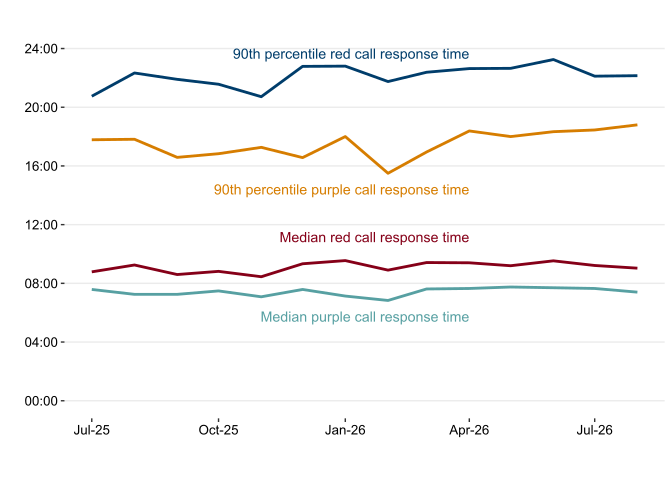
Description of figure 3: a line chart showing median and 90th percentile response times are shorter for purple calls than red calls, and all are relatively stable recently.
Source: Welsh Ambulance Services University NHS Trust
[Note 1]: Detailed definitions for the measures are provided in the accompanying quality report.
Ambulance activity and performance measures, on StatsWales
The median response time for purple calls was 7 minutes 24 seconds, slightly shorter than in July. The 90th percentile (the point at which 90% of responses were quicker and 10% were slower) was 18 minutes 48 seconds, longer than in July. The response time targets for purple calls were both met.
For red calls, the median decreased to 9 minutes 2 seconds and the 90th percentile increased slightly to 22 minutes 9 seconds. This means the response time targets for red calls were not met.
Figure 4: median response time for orange ambulance calls (hours, minutes and seconds), by month
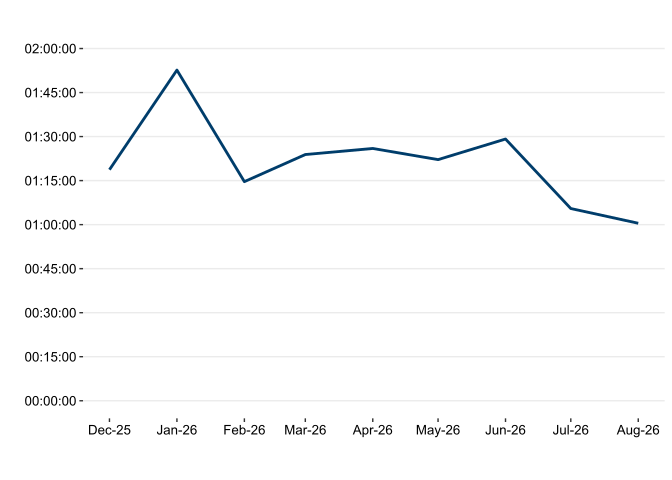
Description of figure 4: a line chart showing the median response time for orange calls was 1 hour and 53 minutes in January, but has been under 1 hour and 30 minutes since.
Source: Welsh Ambulance Services University NHS Trust
Ambulance activity and performance measures, on StatsWales
Figure 5: median time for defibrillator arrival, to commence CPR instruction, and to identify cardiac arrest (minutes and seconds), by month [Note 1]
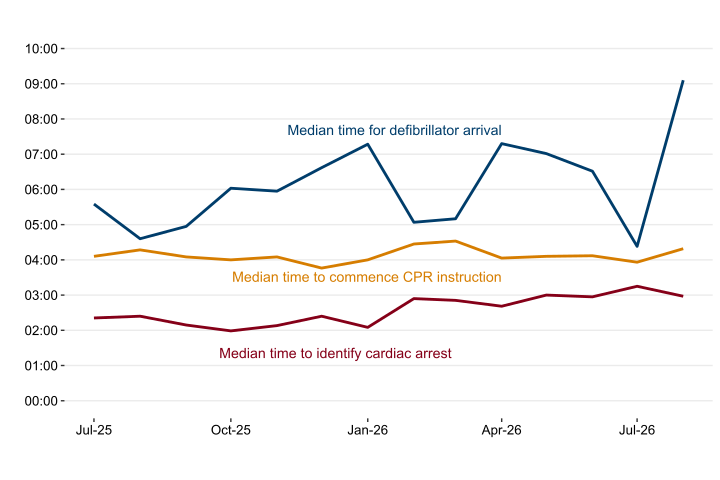
Description of figure 5: a line chart showing the median time for defibrillator arrival has fluctuated, while the median times to commence CPR instruction and to identify cardiac arrest have been more stable.
Source: Welsh Ambulance Services University NHS Trust
[Note 1]: Detailed definitions for the measures are provided in the accompanying quality report.
Ambulance activity and performance measures, on StatsWales
The median time for the arrival of a Public Access Defibrillator (PAD) was 9 minutes and 6 seconds, the longest on record. The median time to commence CPR instruction was 4 minutes and 19 seconds, and the median time to identify cardiac arrest was 2 minutes and 58 seconds.
Ambulance handovers
Performance
Patient handover times between ambulance crews and hospital staff are monitored because they affect the experience of ambulance patients themselves, as well as the ambulance service's ability to respond promptly to other emergency calls.
Targets
- People arriving at hospital by ambulance should be handed over to hospital staff within 15 minutes, in line with clinical priority. Where this is not achievable, handovers should not exceed 45 minutes.
Figure 6: percentage of ambulance handovers completed within 15 minutes and 45 minutes, by month
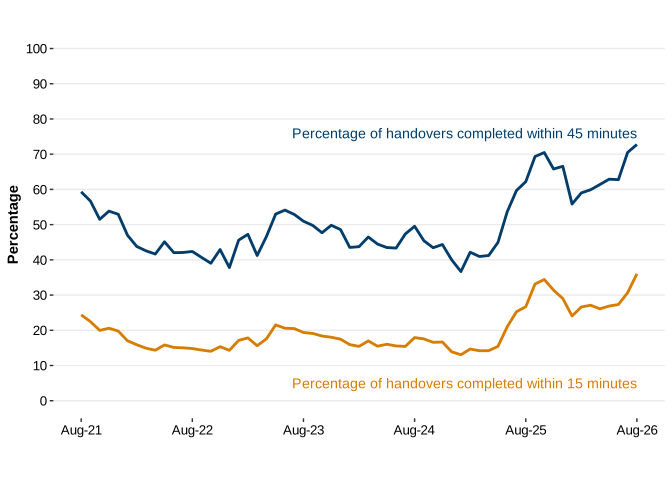
Description of figure 6: a line chart showing the percentages of ambulance handovers completed within 15 minutes and 45 minutes have increased recently.
Source: Welsh Ambulance Services University NHS Trust
Emergency departments
Activity
Figure 7: average attendances in emergency departments, and admissions to hospital resulting from attendances at major emergency departments per day, by month [Note 1]
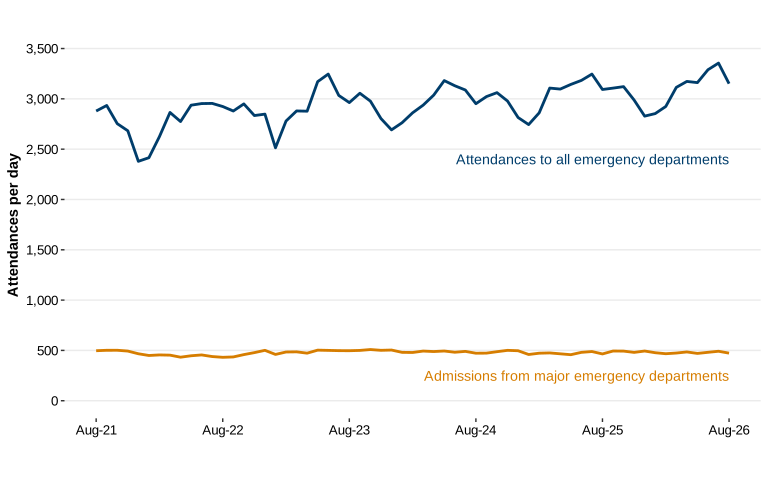
Description of figure 7: a line chart showing no discernible trend in attendances to emergency departments.
Source: Emergency department data set, DHCW
Emergency departments: attendances by age and sex, April 2016 onwards, on StatsWales
[Note 1]: Chart shows number of attendances at both major emergency departments and minor injuries units, and the number of admissions resulting from attending major emergency departments only.
In August there were just under 97,700 attendances to all emergency departments, an average of 3,151 attendances per day; this was 204 fewer attendances per day on average than in the previous month.
Just under 14,700 patients were admitted to hospital following attendance at major emergency departments. This was 3.8% lower than the previous month.
Performance
Targets
- 95% of new patients should spend less than 4 hours in emergency departments from arrival until admission, transfer or discharge.
- No patient waiting more than 12 hours in emergency departments from arrival until admission, transfer or discharge.
Figure 8: percentage of patients admitted, transferred or discharged within 4 hours at emergency departments, by month
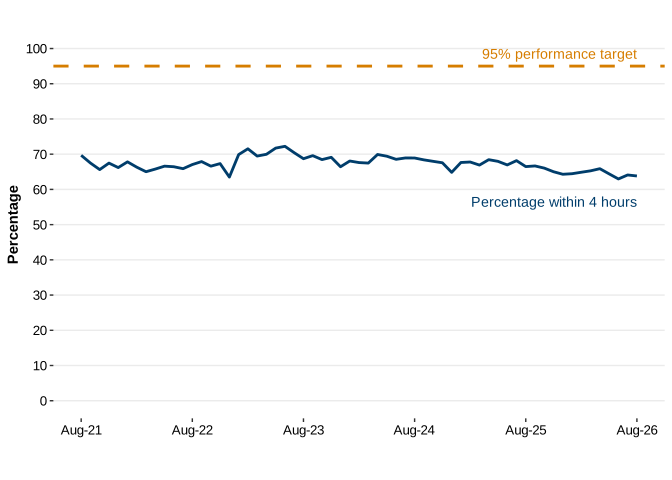
Description of figure 8: a line chart showing the percentage of patients admitted, transferred or discharged within 4 hours at emergency departments has been relatively stable in recent years, between 60 and 70%.
Source: Emergency department data set, DHCW
In August, 63.8% of patients spent less than 4 hours in emergency departments from arrival until admission, transfer or discharge. This was lower than the previous month.
The median waiting time was 2 hours and 58 minute, up 1 minute from the previous month. Waiting times vary by age, time of day and day of the week, with further detail available in the Trends in NHS urgent and emergency care activity report.
Figure 9: patients waiting more than 12 hours to be admitted, transferred or discharged at NHS emergency departments, by month
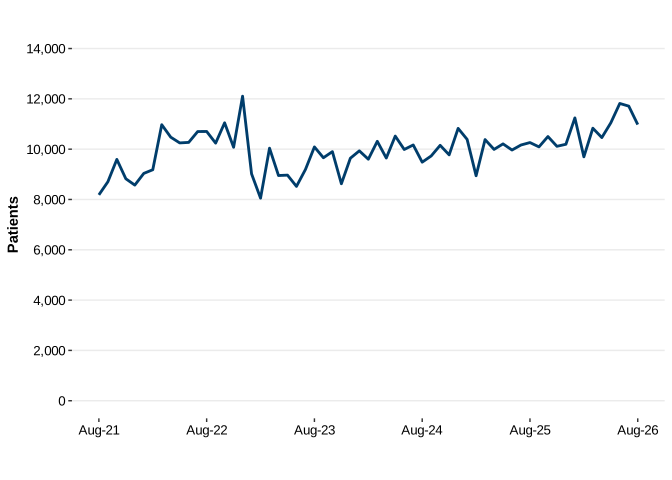
Description of figure 9: a line chart showing the number of patients waiting longer than 12 hours to be admitted, transferred or discharged at emergency departments has been relatively stable in the past few years.
Source: Emergency department data set, DHCW
In August, 10,977 patients waited 12 hours or more. This was 733 (6.3%) lower than in the previous month.
Outpatient appointments
Activity
Figure 10: average daily referrals for first outpatient appointment, by month
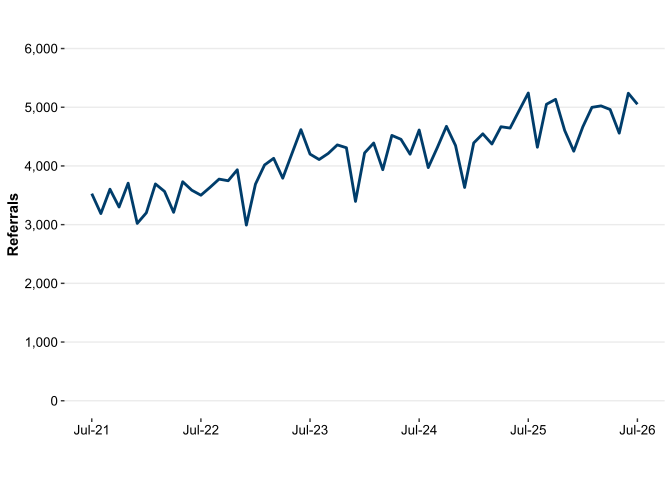
Description of figure 10: a line chart showing outpatient referrals, which has been fluctuating with an upwards trend.
Source: Outpatient Referral Dataset, DHCW
Outpatient referrals, April 2012 onwards, on StatsWales
An average of 5,051 referrals for first outpatient appointments were made per day in July. This is a decrease of 3.6% (187 fewer referrals per day on average) compared to June.
Performance
Targets
- No one waiting for longer than a year for their first outpatient appointment by the end of 2022 (a target established in the planned care recovery plan).
Figure 11: pathways waiting more than a year for their first appointment, by month
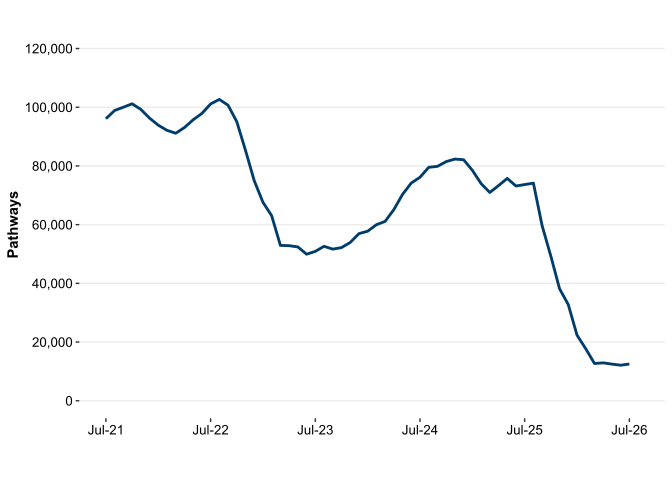
Description of figure 11: a line chart showing the number of patient pathways waiting longer than a year has fallen considerably recently.
Source: Referral to treatment times, DHCW
In July, the number of pathways waiting longer than one year for their first outpatient appointment increased by 3.4% compared to the previous month to just over 12,500. This was 87.8% lower than the peak in August 2022.
Diagnostics and therapies
Activity
Figure 12: patient pathways waiting for diagnostic and therapy services, by month [Note 1]
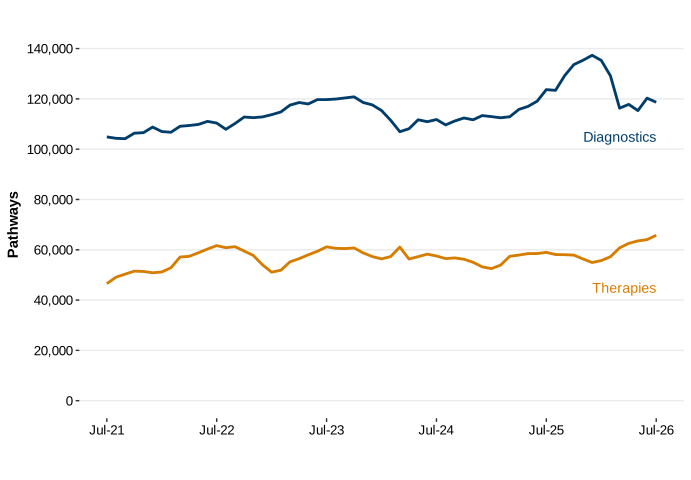
Description of figure 12: a line chart showing a recent fall in pathways waiting for diagnostics, and a recent increase for therapy services.
Source: Diagnostic and therapy services waiting times, DHCW
Therapy services: pathway waiting times, grouped weeks waiting, October 2009 onwards, on StatsWales
[Note 1]: From April 2024 audiology and weight management pathways were no longer reported in the therapies data.
In July there were just under 118,700 patient pathways waiting for diagnostics, a decrease of 1.4% compared with the previous month.
In July there were just under 65,800 patient pathways waiting for therapies, an increase of 2.7% compared with the previous month and the highest figure on record.
Performance
Targets
- The maximum wait for access to specified diagnostic tests is 8 weeks.
- The maximum wait for access to specified therapy services is 14 weeks.
- The planned care recovery plan established a target date of Spring 2024 to reach these targets.
Figure 13: patient pathways waiting over the target time for diagnostic and therapy services, by month [Note 1]
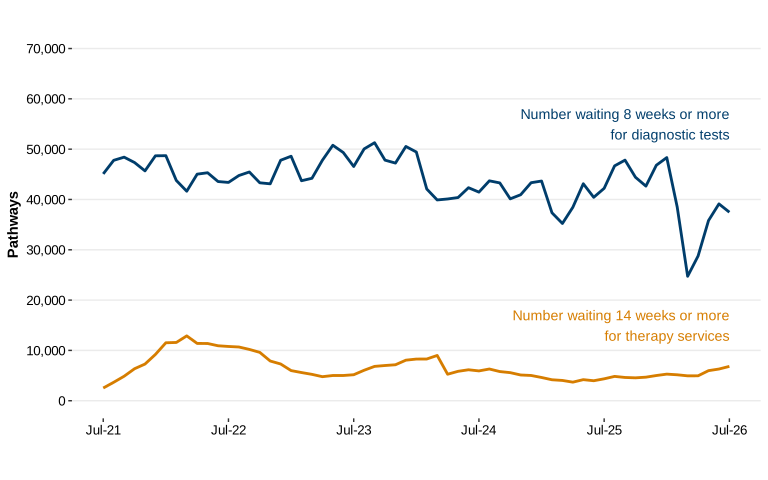
Description of figure 13: a line chart showing a fluctuating trend in diagnostics pathways waiting longer than 8 weeks and a stable trend in therapies pathways waiting longer than 14 weeks.
Source: Diagnostic and therapy services waiting times, DHCW
Therapy services: pathway waiting times, grouped weeks waiting, October 2009 onwards, on StatsWales
[Note 1]: From April 2024 audiology and weight management pathways were no longer reported in the therapies data, meaning they are not directly comparable with data up to March 2024.
In July, just under 37,500 pathways were waiting longer than the target time for diagnostics, a decrease of 4.2% compared to June.
There were just over 6,800 therapies pathways waiting longer than the target time, an increase of 8.4% compared to the previous month.
The median waiting time for diagnostic tests was 4.9 weeks, 0.4 weeks shorter than in June, and for therapy services it was 4.6 weeks, 0.1 weeks longer than in June.
Referral to treatment waiting times
Referral to treatment statistics cover open and closed pathways following referral by a GP or other medical practitioner to hospital for treatment. Open pathways are those that remain on the waiting list for treatment, whereas closed pathways are those removed.
Activity is measured by patient pathways, which differs to the number of patients. More information on this difference is available in the Welsh Government’s 'Chief statistician’s update: explaining NHS activity and performance statistics'.
Performance
Targets and objectives
- Eliminate waits longer than 2 years.
- 95% of patients should wait less than 26 weeks from referral.
- No patients should wait more than 36 weeks for treatment from referral.
Figure 14: patient pathways waiting to start treatment, by month [Note 1]
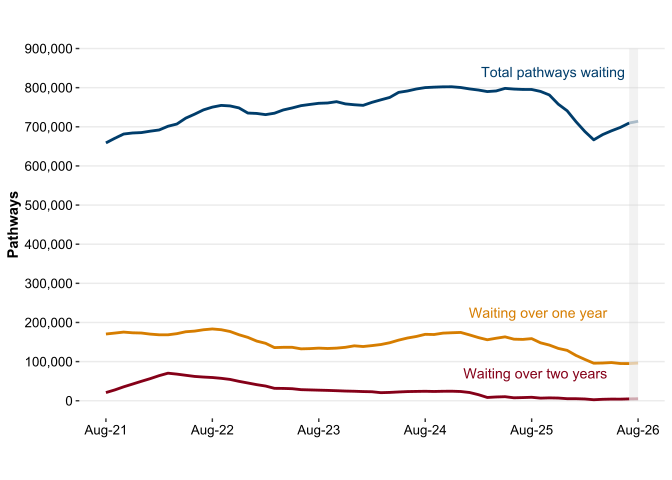
Description of figure 14: a line chart showing that after peaking in late 2024, total pathways started to fall before rising again in recent months. Pathways waiting longer than one year have been stable in recent months and two year waits started falling in early 2022.
Source: Referral to treatment times, DHCW
[Note 1]: Figures in the shaded area for the most recent month in this chart are provisional and are subject to change. The official data series ends in the previous month.
In July there were just under 709,700 patient pathways waiting to start treatment, an increase from June (698,400). Just over 94,900 pathways were waiting more than one year in July, a decrease of 0.2% from last month. Just over 4,700 were waiting more than two years, 15.9% higher than last month and 93.3% lower than the peak in March 2022.
These official statistics are published with a lag of around 7 weeks from the end of the reference period. However, given the interest in referral to treatment (RTT) waiting lists and the Welsh Government’s commitment to reducing the longest waits, there is public value in making data on this topic available earlier. We are therefore providing provisional estimates for the month ahead.
Provisional data indicate there were around 714,200 total pathways waiting at the end of August, of which:
- 96,200 were waiting more than 1 year
- 5,100 were waiting more than 2 years
These provisional estimates are subject to change before the official figures for August are released in October.
Headline measures for open pathways across the UK are not comparable. There are large differences in coverage between Wales, Scotland and Northern Ireland statistics, meaning they should not be compared at all. With England, a broadly comparable number can be produced for Wales by removing some known non-consultant led pathways which are not counted in England.
On that basis, there are around 627,200 open pathways on consultant-led pathways in Wales, equivalent to 20 pathways for every 100 people. For England, the figure in July was 12 pathways for every 100 people. These comparisons are explored further in the 'Chief Statistician’s update: comparing NHS performance statistics across the UK'.
The number of patient pathways is not the same as the number of individual patients, because some people have multiple open pathways. Management information suggests there were around 555,200 individual patients on treatment waiting lists in Wales. Estimates for the number of individual patients waiting to start treatment by health board can be found in the NHS waiting lists: estimate of unique patients dataset on StatsWales.
Figure 15: percentage of patient pathways waiting less than 26 weeks, by month
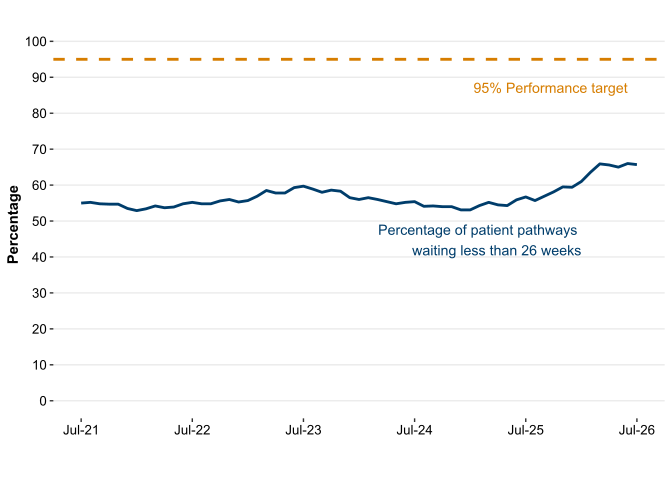
Description of figure 15: a line chart showing the percentage of patient pathways waiting less than 26 weeks has increased recently.
Source: Referral to treatment times, DHCW
Of the just under 709,700 patient pathways waiting to start treatment, by the end of July, 65.7% had been waiting less than 26 weeks. This was lower than the previous month.
Figure 16: patient pathways waiting more than 36 weeks, by month
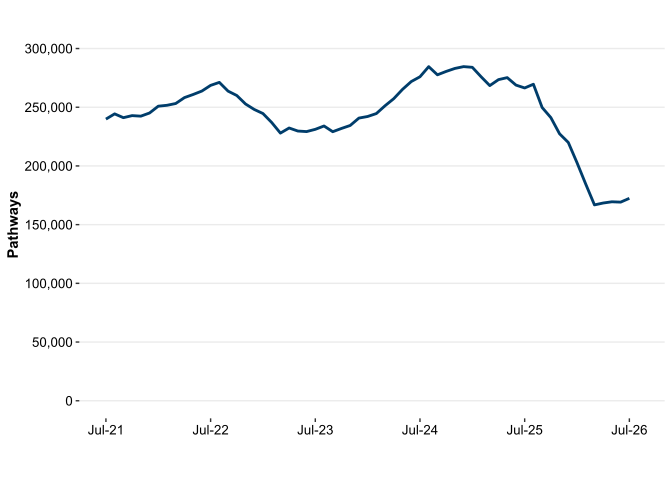
Description of figure 16: a line chart showing the number of pathways waiting more than 36 weeks has fallen recently.
Source: Referral to treatment times, DHCW
In July, just over 172,400 patient pathways had been waiting more than 36 weeks. This was around 3,200 higher than in the previous month, This figure represents 24.3% of all pathways waiting to start treatment.
The median time waiting to start treatment in July was 16.3 weeks, 0.4 weeks longer than the previous month.
Figure 17: closed patient pathways, by month
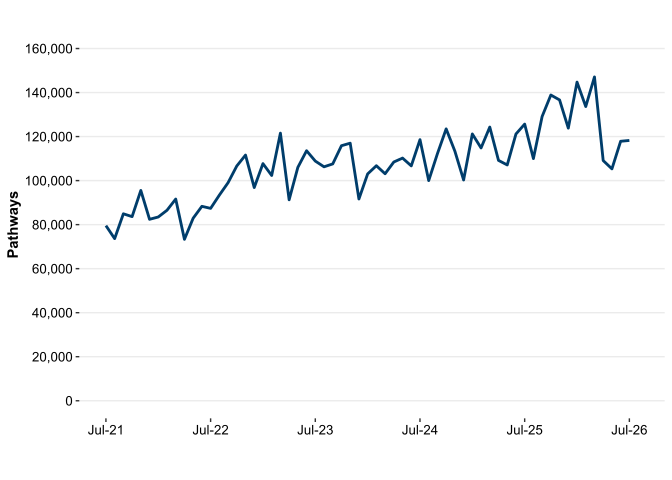
Description of figure 17: a line chart showing that despite falling considerably recently, the number of patient pathways closed is generally trending upwards.
Source: Referral to treatment times, DHCW
NHS waiting lists: closed referral to treatment pathways, September 2011 onwards
The number of patient pathways closed in July was just over 118,200. This was an average of 5,141 pathways closed per working day, a decrease of 217 patient pathways closed per working day from the previous month.
Hospital discharge delays
Hospital discharge delays occur when patients who are clinically ready for discharge cannot leave hospital because the necessary ongoing care and support or suitable accommodation is not yet accessible. The figures represent the number of adults who were ready to return home or move on to the next stage of care, that experienced a delay in their transfer of more than 48 hours. The data are a snapshot of delays on a given day each month, meaning they do not tell us the total number of delays over the month. Figures are available for the number of individual delays and the corresponding total number of days delayed experienced by those patients.
Figure 18: number of pathway of care delays and the total days delayed, by month [Note 1]
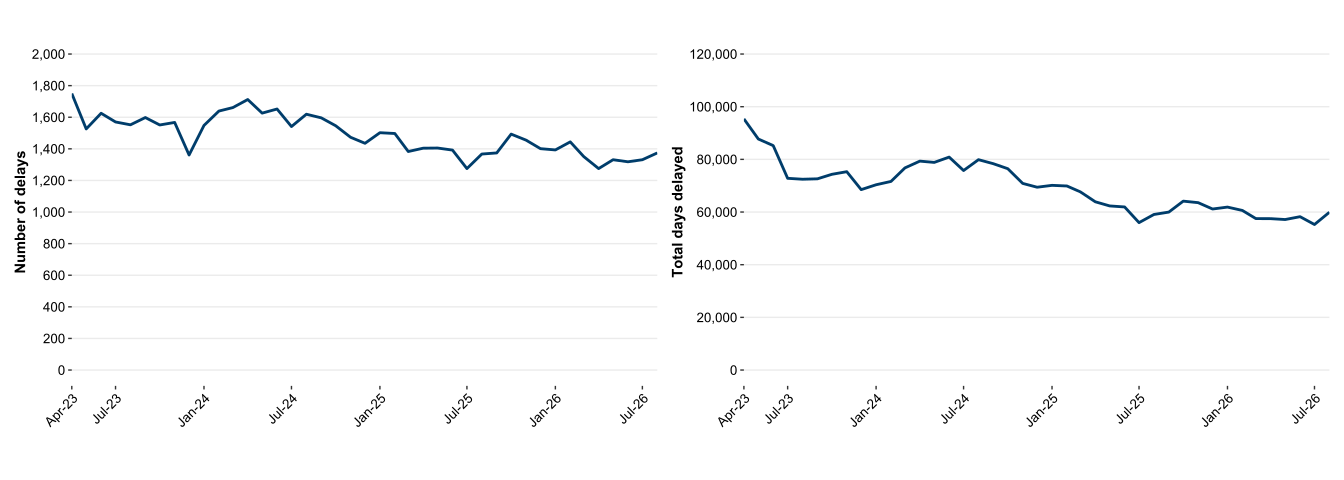
Description of figure 18: line charts showing the number of delays and the total days delayed are both showing a downward trend.
Source: Pathway of Care Delays, DHCW
Delayed hospital discharges: total pathway of care delays and total days delayed, on StatsWales
[Note 1] The vertical axes of these charts are on different scales.
In August there were just under 1,400 pathway of care delays on the day the data were collected, a slight increase compared to the figure in July. The total cumulative days delayed for those patients was just over 59,900, an increase compared to the figure in July.
Cancer services
A number of wider measures from the suspected cancer pathway are produced by Digital Health and Care Wales.
Activity
Figure 19: closed suspected cancer pathways in the month, by month and outcome
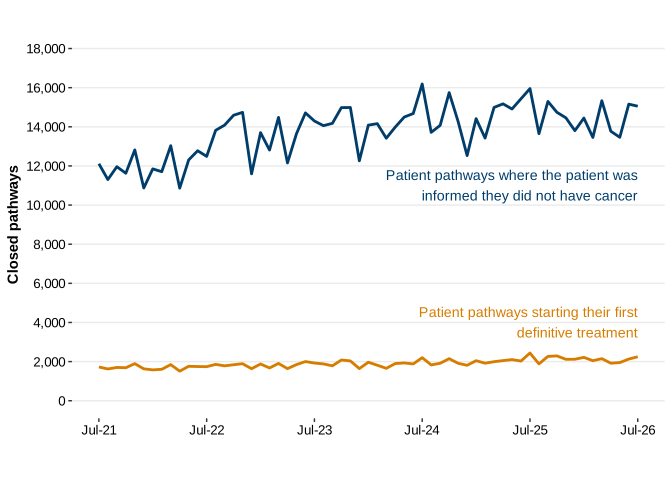
Description of figure 19: a line chart showing the number of patient pathways informed they do not have cancer, which fluctuates, and the number starting their first definitive treatment, which is relatively stable.
Source: Suspected Cancer Pathway, DHCW
In July, 2,248 pathways started cancer treatment, 119 more than in June. 15,052 pathways were closed after patients were informed they did not have cancer, a decrease of 0.7%. There were 18,429 new suspected cancer pathways, an increase of 234 (1.3%) from June and the second highest figure since records began. In recent years the number of new pathways opened has been relatively stable.
Performance
Target
- At least 75% of patients should start treatment within 62 days (without suspensions) of first being suspected of cancer.
Figure 20: percentage of pathways where the patient started their first definitive treatment within the target time, by month
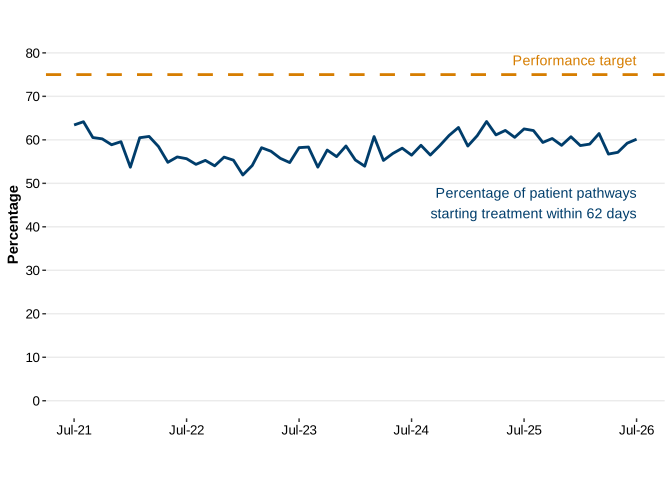
Description of figure 20: a line chart showing the percentage of patients starting treatment within 62 days of a suspicion of cancer has generally fluctuated between 50% and 65% in recent years, with no discernible trend.
Source: Suspected Cancer Pathway, DHCW
In July, 60.1% of pathways started their first definitive treatment within 62 days of first being suspected of cancer. This was an increase compared with the previous month.
Focus on local health boards
A new monthly dashboard has been developed to replace the quarterly release NHS performance for Welsh local health boards. Summary analyses are provided in this section. These analyses are on a health board provider basis, not health board of residence. This means patients resident in one health board but on waiting lists provided by other health boards are counted in those organisations’ figures. This is consistent with the performance management framework in Wales, in that standards and targets are assessed on a provider basis.
Of the measures covered in this report:
- all health boards except Betsi Cadwaladr have either no pathways waiting longer than 2 years or less than 1%
- Swansea Bay currently has no one-year waits for a first outpatient appointment, while Cwm Taf Morgannwg and Hywel Dda have less than 1%
- Swansea Bay has no therapies pathways waiting over 14 weeks while Cwm Taf Morgannwg and Powys have less than 1%
Ambulance service
A range of new ambulance performance metrics were introduced in July 2025. Health board figures are published on StatsWales. However, it is not possible to summarise these in the format of the main measures for the other topics as below.
Emergency departments
- Aneurin Bevan has the best 4-hour performance (71.9% attendances under 4 hours) and Betsi Cadwaladr has the worst (57.2%).
- Aneurin Bevan has the best 12-hour performance (8.1% attendances over 12 hours) and Betsi Cadwaladr has the worst (17.0%).
RTT pathways
- Betsi Cadwaladr has the highest proportion of RTT pathways waiting longer than one and 2 years (16.7% and 1.2%).
- Powys has the lowest proportion over one year (1.9%) and Powys and Swansea Bay have no pathways waiting longer than 2 years.
Outpatient appointments
- For first outpatient waits over one year, Cardiff and Vale has the highest proportion at 9.8% of pathways, while Swansea Bay has no pathways waiting.
Diagnostics and therapies
- Cardiff and Vale has the highest proportion of diagnostic breaches over 8 weeks (50.4%) while Powys has the lowest (5.7%).
- For therapies, Hywel Dda has the highest proportion over 14 weeks (27.7%), while Swansea Bay has no pathways waiting over 14 weeks.
Cancer services
- Cwm Taf Morgannwg has the highest proportion of patients starting treatment within 62 days (67.5%), and Swansea Bay has the lowest (44.7%).
More detailed data is available on StatsWales: health and social care.
Figure 21: local health board performance summary, July and August 2026 [Note 1]
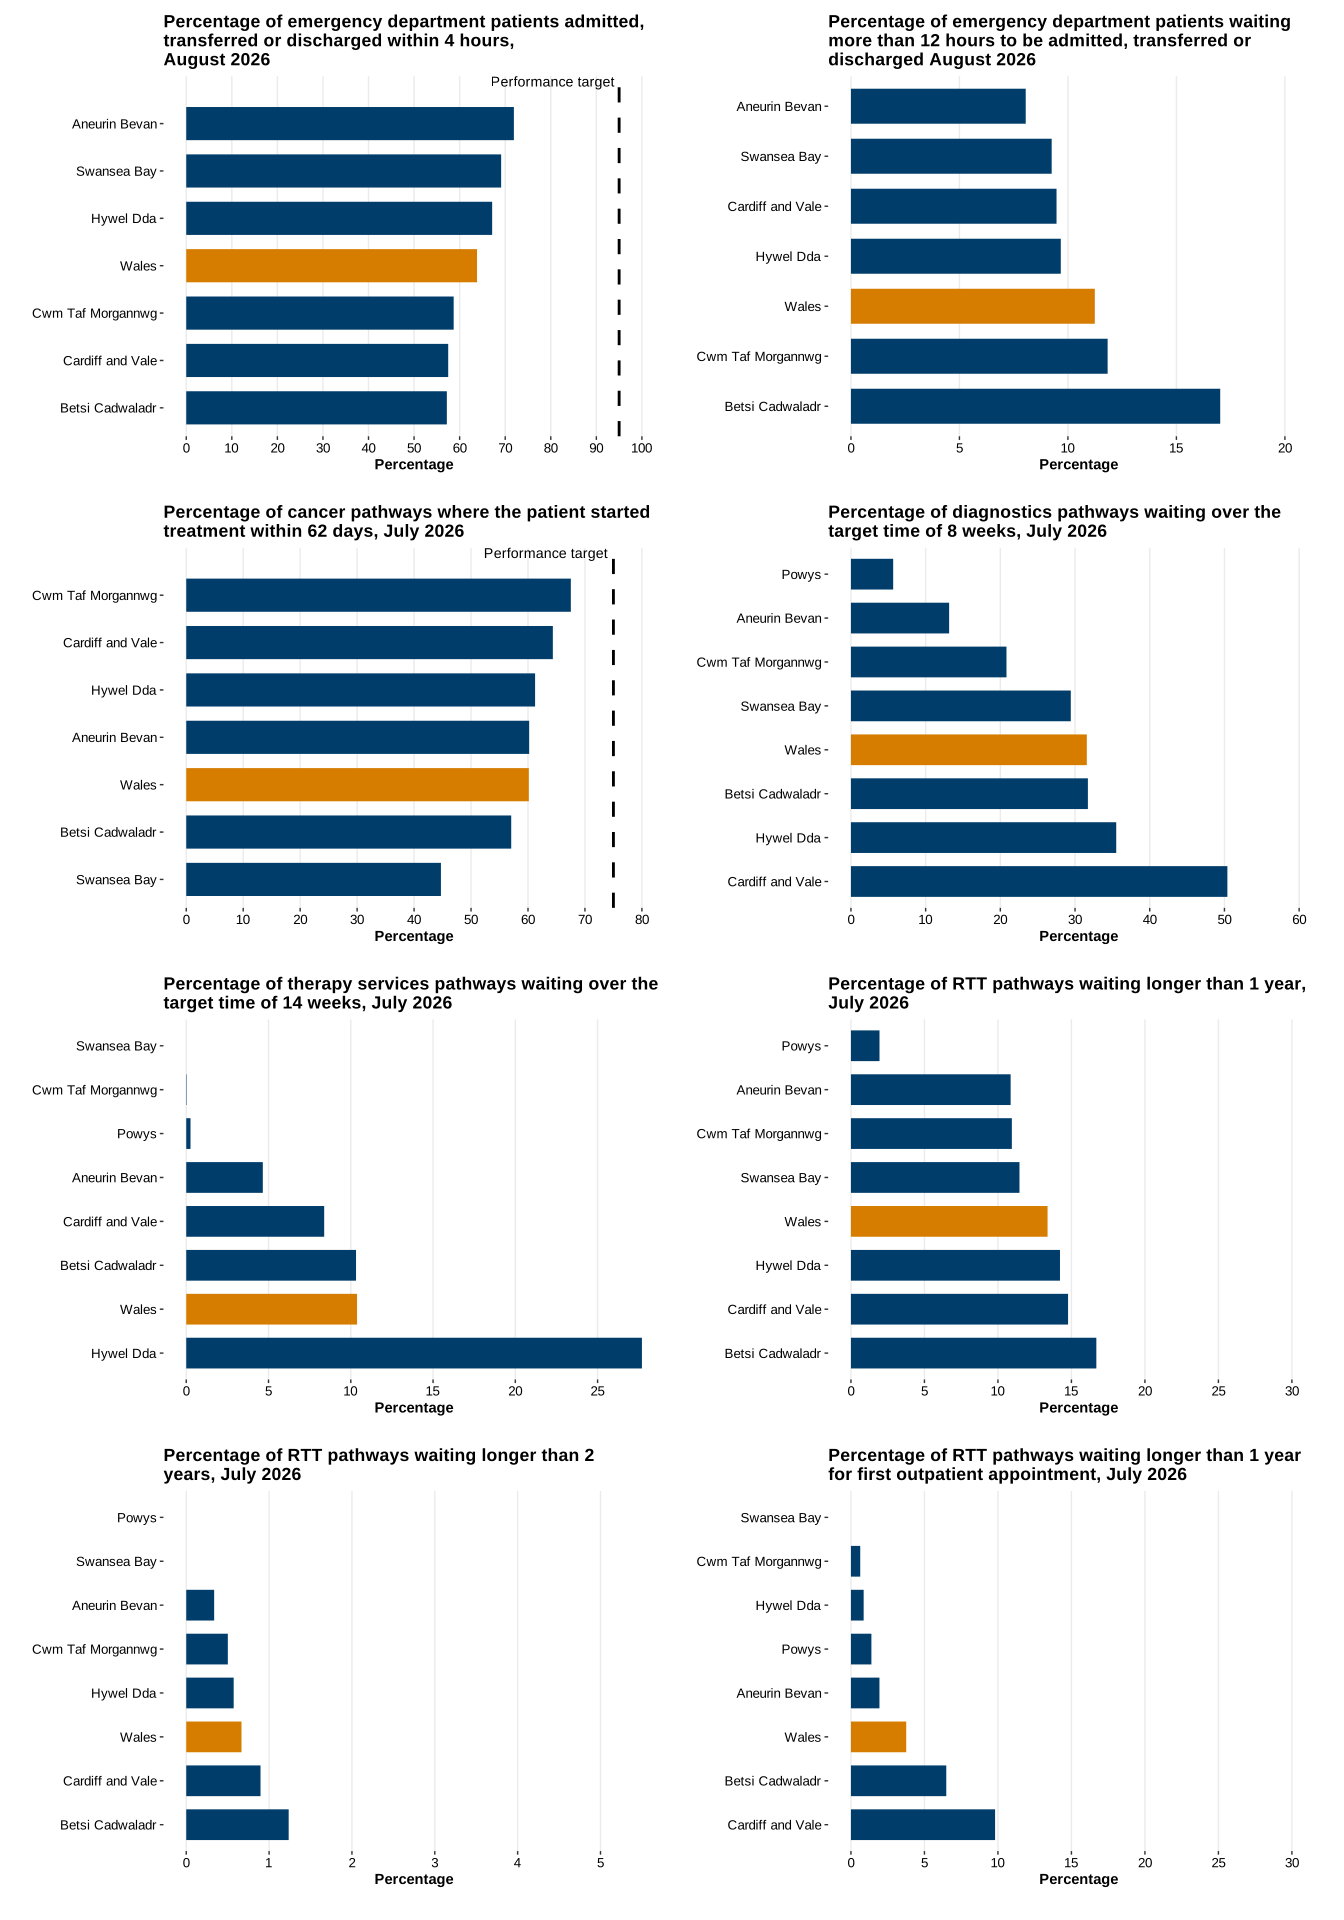
Description of figure 21: a series of charts showing comparative performance for the health boards for selected measures across emergency and planned care in Wales. The main points are summarised in the narrative section above.
Source: Wales Ambulance Services NHS Trust, DHCW
Health and Social Care statistics, on StatsWales
[Note 1]: The percentage axes of these charts are on different scales and care should be taken when looking at the size of differences between health boards.
Quality and methodology information
All quality and methodology information in relation to this statistical release can be found in the NHS activity and performance summary: quality report
Official statistics status
All official statistics should show the standards of the Code of Practice for Statistic (UK Statistics Authority).
These are accredited official statistics. They were independently reviewed by the Office for Statistics Regulation (OSR) in July 2012. They comply with the standards of trustworthiness, quality, and value in the Code of Practice for Statistics.
It is Welsh Government’s responsibility to maintain compliance with the standards expected of accreditation. If we become concerned about whether these statistics are still meeting the appropriate standards, we will discuss any concerns with OSR promptly. Accreditation can be cancelled or suspended at any point when the highest standards are not maintained, and reinstated when standards are restored.
Accredited official statistics (OSR) are called National Statistics in the Statistics and Registration Service Act 2007.
Statement of compliance with the Code of Practice for Statistics
Our statistical practice is regulated by the OSR. OSR sets the standards of trustworthiness, quality and value in the Code of Practice for Statistics that all producers of official statistics should adhere to.
All of our statistics are produced and published in accordance with a number of statements and protocols to enhance trustworthiness, quality and value. These are set out in the Welsh Government’s Statement of Compliance.
These accredited official statistics demonstrate the standards expected around trustworthiness, quality and public value in the following ways.
Trustworthiness
These statistics are compiled from a range of sources derived from administrative data systems in use across the NHS in Wales. Data on the 111 service, 999 ambulance calls and ambulance response times are provided by the Wales Ambulance Services University NHS Trust (WAST), and all other data sources are collected by the Welsh Local Health Boards and provided to Digital Health and Care Wales (DHCW) to enable them to be collated at a national level.
The data collections are overseen by the Welsh Information Standards Board (WISB), which is the custodian of the Information Standards Assurance Process. WISB mandates data collections through the NHS and local heath boards, appraises information standards and provides assurance on matters related to confidentiality and consent.
The published figures are compiled by professional analysts using the latest available data and applying methods using their professional judgement and analytical skillset.
These statistics are pre-announced on the Statistics and Research area of the Welsh Government website. Access to the data during processing is restricted to those involved in the production of the statistics, quality assurance and for operational purposes. Pre-release access is restricted to eligible recipients in line with the Code of Practice (UK Statistics Authority).
Quality
Statistics published by Welsh Government adhere to the Statistical Quality Management Strategy which supplements the Quality pillar of the Code of Practice for Statistics and the European Statistical System principles of quality for statistical outputs.
Data standards and definitions are established by the WISB. Guidance is issued to the data providing organisations and training provided to staff responsible for collecting the data at source. DHCW collates and validates health board level data and queries anomalous and missing data directly with the health boards. Before validated datasets are provided by DHCW to Welsh Government, all data are signed off by health boards. DHCW provides validated datasets to Welsh Government, where analysts process the data to produce the aggregate statistics in the format required for publication. Welsh Government undertakes final validation checks which can be queried with DHCW and the health boards before publication. The statistical release is signed off by senior statisticians before publication.
Value
The purposes of this statistical release and the accompanying data published on StatsWales are to:
- provide evidence for policy development
- inform the media and wider public about activity and performance in the Welsh NHS
- enable service providers such as local health boards and WAST to monitor their own performance
Reliable statistics on the volume of activity undertaken in the NHS, the size of waiting lists, ambulance response times and emergency department and cancer waiting times are vital to inform users about the state of NHS services and the performance of the Welsh government and the local health boards. These services have a significant impact on citizens’ lives and these topics feature prominently in media coverage and political discourse.
The information published here also supports the Welsh Government’s long term plan for health and social care: A healthier Wales.
The timeliness of the data provides the most recent update using reliable data.
You are welcome to contact us directly with any comments about how we meet these standards. Alternatively, you can contact OSR by emailing regulation@statistics.gov.uk or via the OSR website.
Well-being of Future Generations Act (WFG)
The Well-being of Future Generations Act 2015 is about improving the social, economic, environmental and cultural wellbeing of Wales. The Act puts in place seven wellbeing goals for Wales. These are for a more equal, prosperous, resilient, healthier and globally responsible Wales, with cohesive communities and a vibrant culture and thriving Welsh language. Under section (10)(1) of the Act, the Welsh Ministers must (a) publish indicators (“national indicators”) that must be applied for the purpose of measuring progress towards the achievement of the wellbeing goals, and (b) lay a copy of the national indicators before Senedd Cymru. Under section 10(8) of the Well-being of Future Generations Act, where the Welsh Ministers revise the national indicators, they must as soon as reasonably practicable (a) publish the indicators as revised and (b) lay a copy of them before the Senedd. These national indicators were laid before the Senedd in 2021. The indicators laid on 14 December 2021 replace the set laid on 16 March 2016.
Information on the indicators, along with narratives for each of the wellbeing goals and associated technical information is available in the Wellbeing of Wales report.
Further information on the Well-being of Future Generations (Wales) Act 2015.
The statistics included in this release could also provide supporting narrative to the national indicators and be used by public services boards in relation to their local wellbeing assessments and local wellbeing plans.
Next update
22 October 2026
We want your feedback
We welcome any feedback on any aspect of these statistics which can be provided by email to stats.healthinfo@gov.wales.