
Communities and local areas (National Survey for Wales): April 2024 to March 2025
This report looks at factors linked with people's views on their local area, local decision making, and community between April 2024 and March 2025.
In this page
Introduction
This report sets out results for 4 of the communities and local areas questions in the National Survey for Wales during survey year April 2024 to March 2025, based on around 6,000 interviews with people aged 16 or over.
Participants were asked to what extent they agreed with the statements:
- ‘I can influence decisions affecting my local area’
- ‘I belong to my local area’
- ‘People in the local area from different backgrounds get on well together’
Participants were also asked about how satisfied they were with their ability to get to services and facilities available in their local area.
Due to fieldwork issues encountered during April 2024 to March 2025, there were lower response rates compared with previous years, and smaller sample sizes. Therefore, confidence intervals are wider than previous years. However, these statistics are still appropriate to use. At a national level the survey continues to provide reasonable estimates, particularly when used alongside alternative sources. The smaller sample size means that some detailed breakdowns of the data on communities and local areas are not possible.
Main points
Findings include:
- 19% of people said they could influence decisions affecting their local area
- 78% were satisfied with their ability to get to local services or facilities
- 73% felt they belonged to their local area
- 80% thought that people from different backgrounds got on well together in their local area
People who said they could influence decisions affecting their local area were more likely to:
- be 65 or older
- live in a rural area
- have contacted their local councillor in the previous 12 months
- be satisfied with their ability to get to local services or facilities
- strongly agree that they belong to their local area
- not have previously served in the UK armed forces
People who were satisfied with their ability to get to local services or facilities were more likely to:
- not have a limiting long-standing illness or disability
- live in an urban area
- have a very high life satisfaction
- strongly agree that they belong to their local area
People who felt they belonged to their local area were more likely to:
- be aged 45 or older
- be white (Welsh, English, British, etc.)
- be part of an ethnic minority (excluding white minorities)
- live in a rural area
People who thought that people from different backgrounds got on well together in their local area were more likely to:
- be 65 or older
- not have a limiting long-standing illness or disability
- be satisfied with their ability to get to local services or facilities
- strongly agree that they belong to their local area
Whether feel can influence decisions affecting the local area
People were asked whether they agreed with the statement ‘I can influence decisions affecting my local area’.
19% of people agreed that they could influence decisions affecting their local area. This is down from 30% agreement in April 2021 to March 2022, the last time this question was asked, and is back to the level found in April 2016 to March 2019.
Figure 1: percentage of people who said they could influence decisions affecting their local area from 2016 to 2025
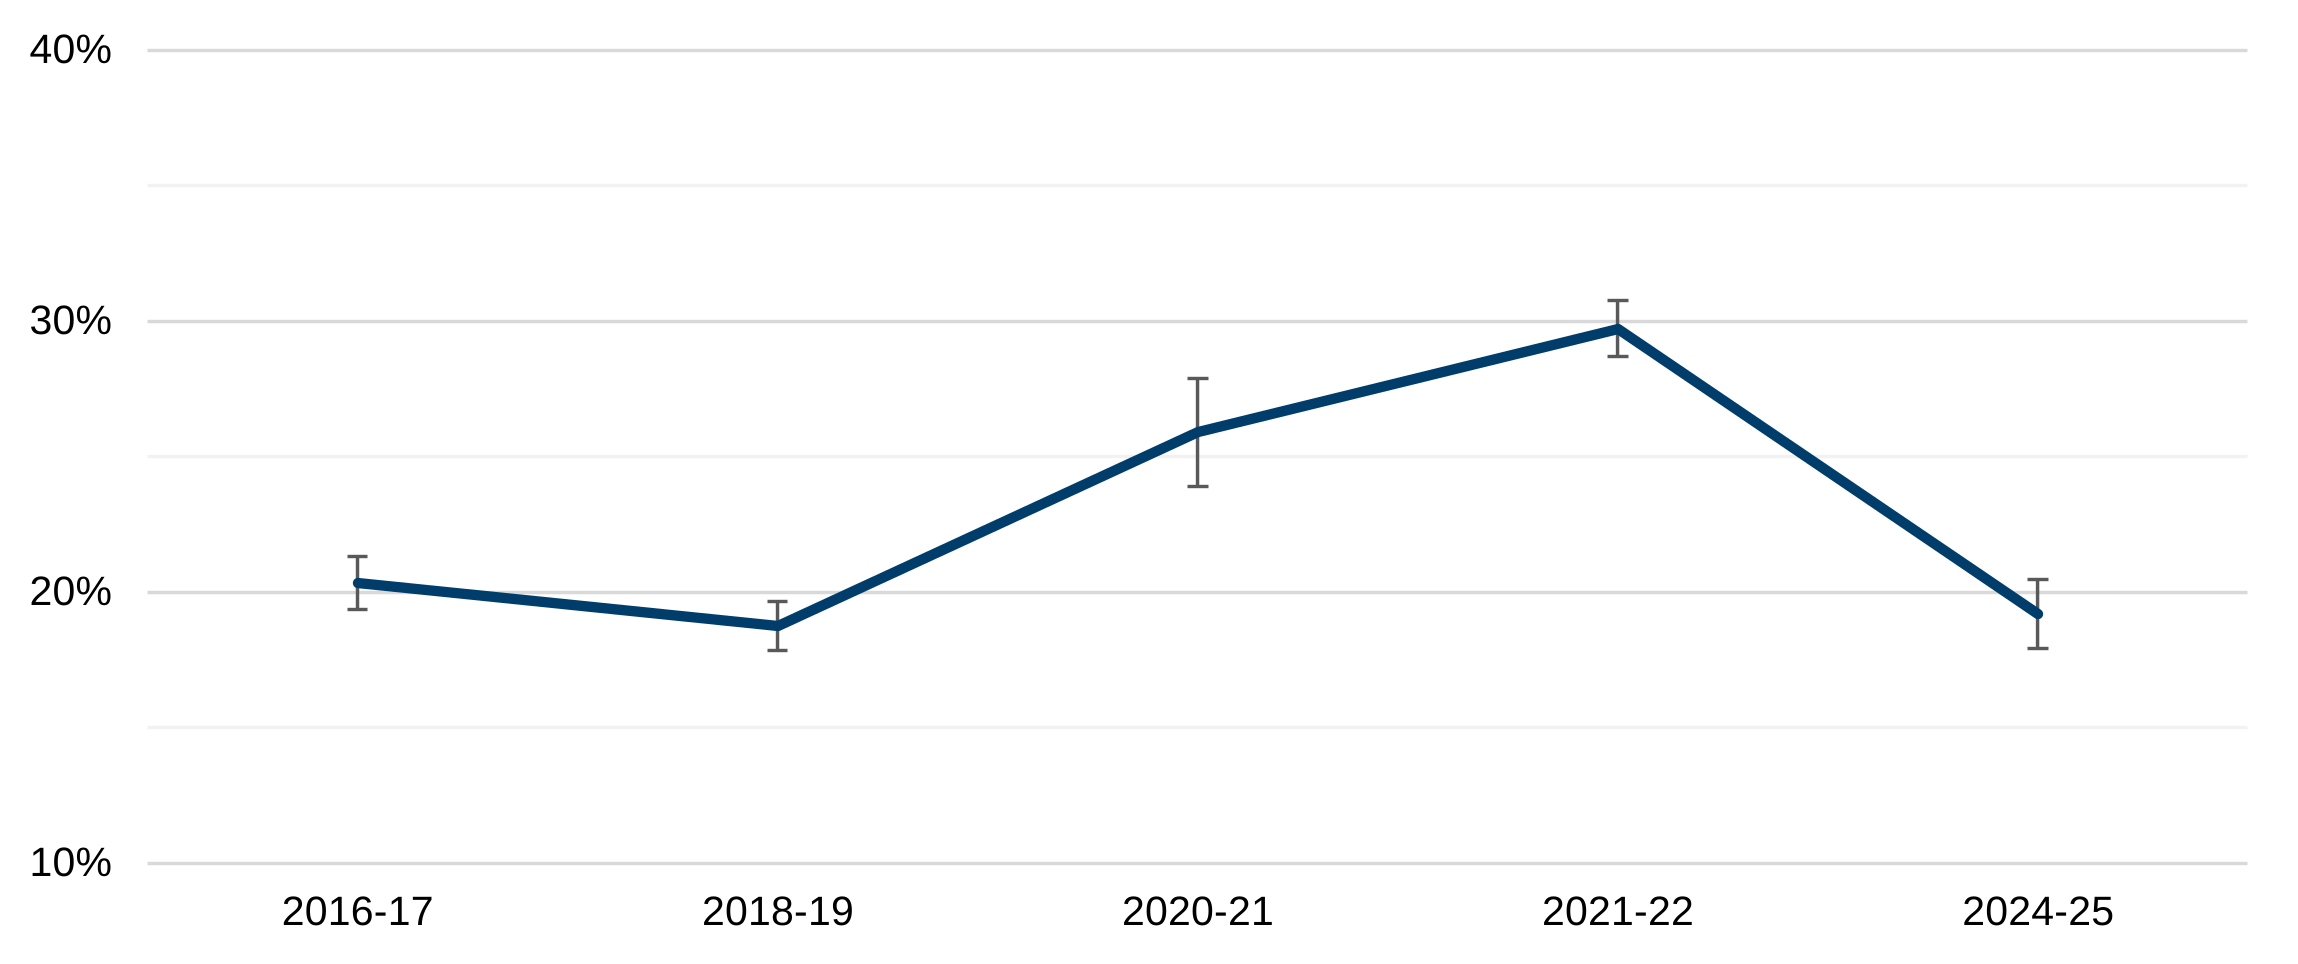
Description of figure 1: a line graph showing that similar proportions of people agreed that they could influence decisions made affecting their local area in April 2016 to March 2017 and in April 2018 to March 2019 (20% and 19%, respectively). The proportion increased in April 2020 to March 2021 (26%) and increased again in the following year. In April 2024 and March 2025, the proportion had decreased to the level as found in April 2016 to March 2019.
Source: National Survey for Wales
The factors linked with feeling able to influence decisions affecting the local area were:
- being older
- living in a rural area
- not having served in the UK armed forces
- having contacted their local councillor in the previous 12 months
- being satisfied with ability to get to local services and facilities
- feeling like they belong to local area
People aged 65 or older were more likely to feel that they could influence decisions affecting the local area than were people in other age groups. 23% of people aged 65 or older said they could influence decisions affecting their local area, compared with 18% of people aged 16 to 64.
People living in a rural area were more likely to feel that they could influence decisions affecting their local area (22%) than those living in an urban area (18%).
People who had not previously served in the UK armed forces were more likely to feel that they could influence decisions affecting their local area (19%) than people who had served (14%).
People who had contacted their local councillor in the last 12 months were more likely to feel that they could influence decisions affecting their local area than people who had not contacted their councillor. 24% of people who had contacted their local councillor in the last 12 months said they could influence decisions affecting their local area, compared with 18% of people who had not.
People who were satisfied with their ability to get to local services or facilities were more likely to feel they could influence decisions affecting their local area (21%) than people who were not satisfied (12%).
People who strongly agreed that they belonged to their local area were more likely to feel they could influence decisions affecting their local area (see figure 2).
Figure 2: percentage of people who felt they could influence decisions affecting their local area, by belonging to their local area, April 2024 to March 2025
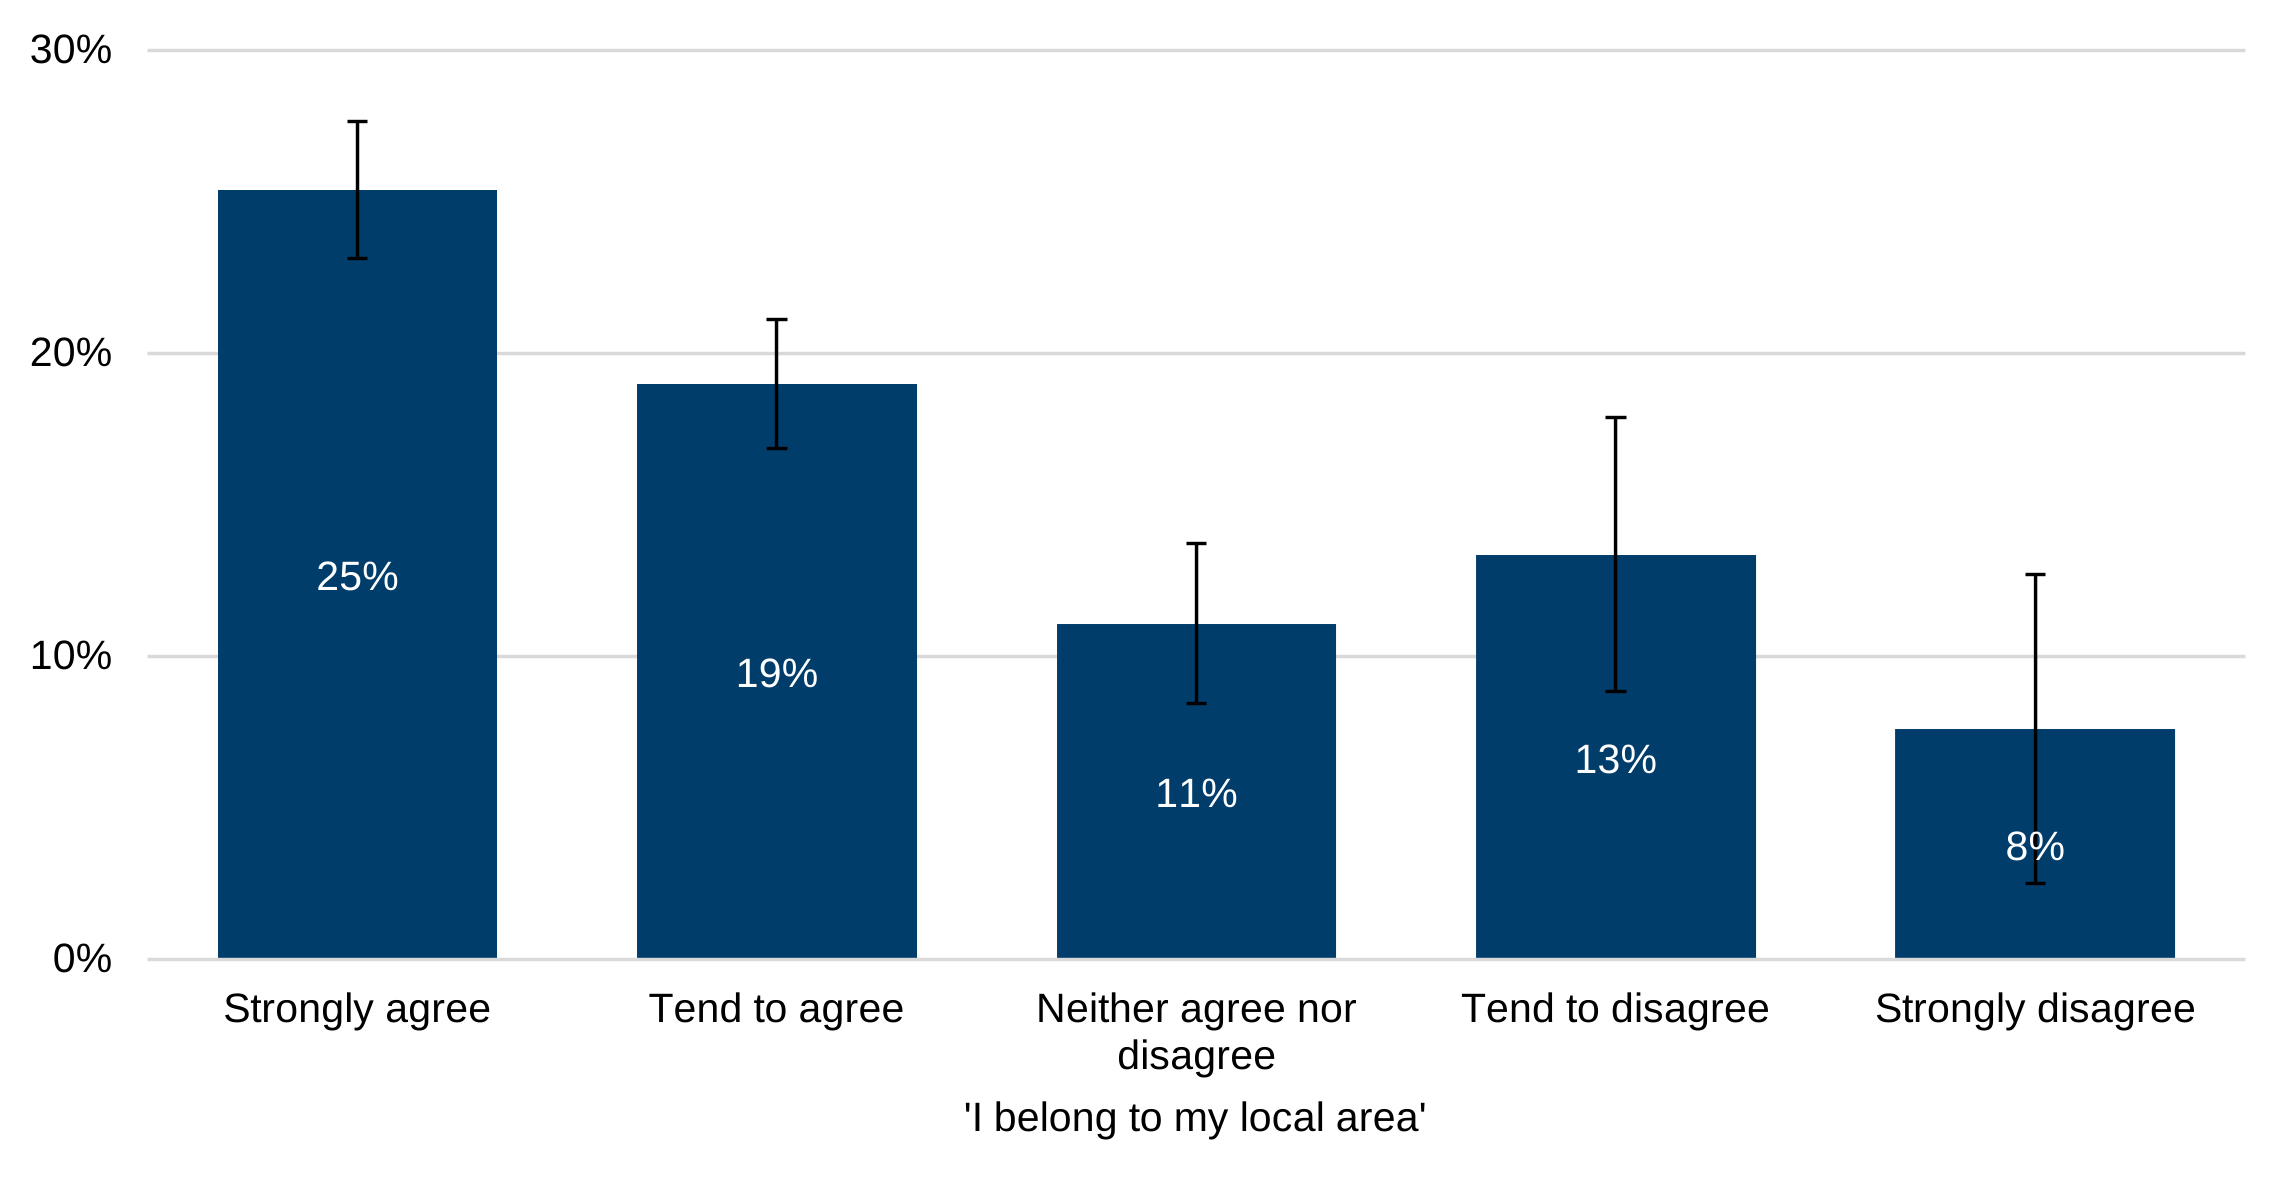
Description of figure 2: a bar chart showing that people who strongly agreed that they belong to their local area were most likely to feel they could influence decisions affecting their local area (25%). People who tended to agree that they belonged to their local area were more likely to feel they could influence decisions affecting their local area (19%) than people who neither agreed or disagreed that they belonged to their local area (11%) or who strongly disagreed that they belonged (8%).
Source: National Survey for Wales, April 2024 to March 2025.
Sexual orientation was also found to be linked with feeling able to influence decisions affecting the local area. Similar proportions of heterosexual people and people who were of any other sexual orientation felt they could influence decisions affecting their local area.
The following factors were also considered in the analysis. However, they were not found to be linked to feeling able to influence decisions affecting the local area.
- Sex
- Ethnicity
- Marital status
- Having a limiting long-standing illness or disability
- Religion
- Welsh Index of Multiple Deprivation (WIMD) quintile
- Being in material deprivation
- Being able to speak Welsh
- Life satisfaction
- Region
- Feeling that people from different backgrounds in the local area get on well together
Satisfaction with ability to get to local services or facilities
People were asked about satisfaction with their ability to get to services and facilities in the local area.
78% of people were satisfied with their ability to get to local services or facilities. This is down from 86% in April 2021 to March 2022, the last time this question was asked (see figure 3).
Figure 3: percentage of people who said they were satisfied with their ability to get to local services and facilities, from 2017 to 2025
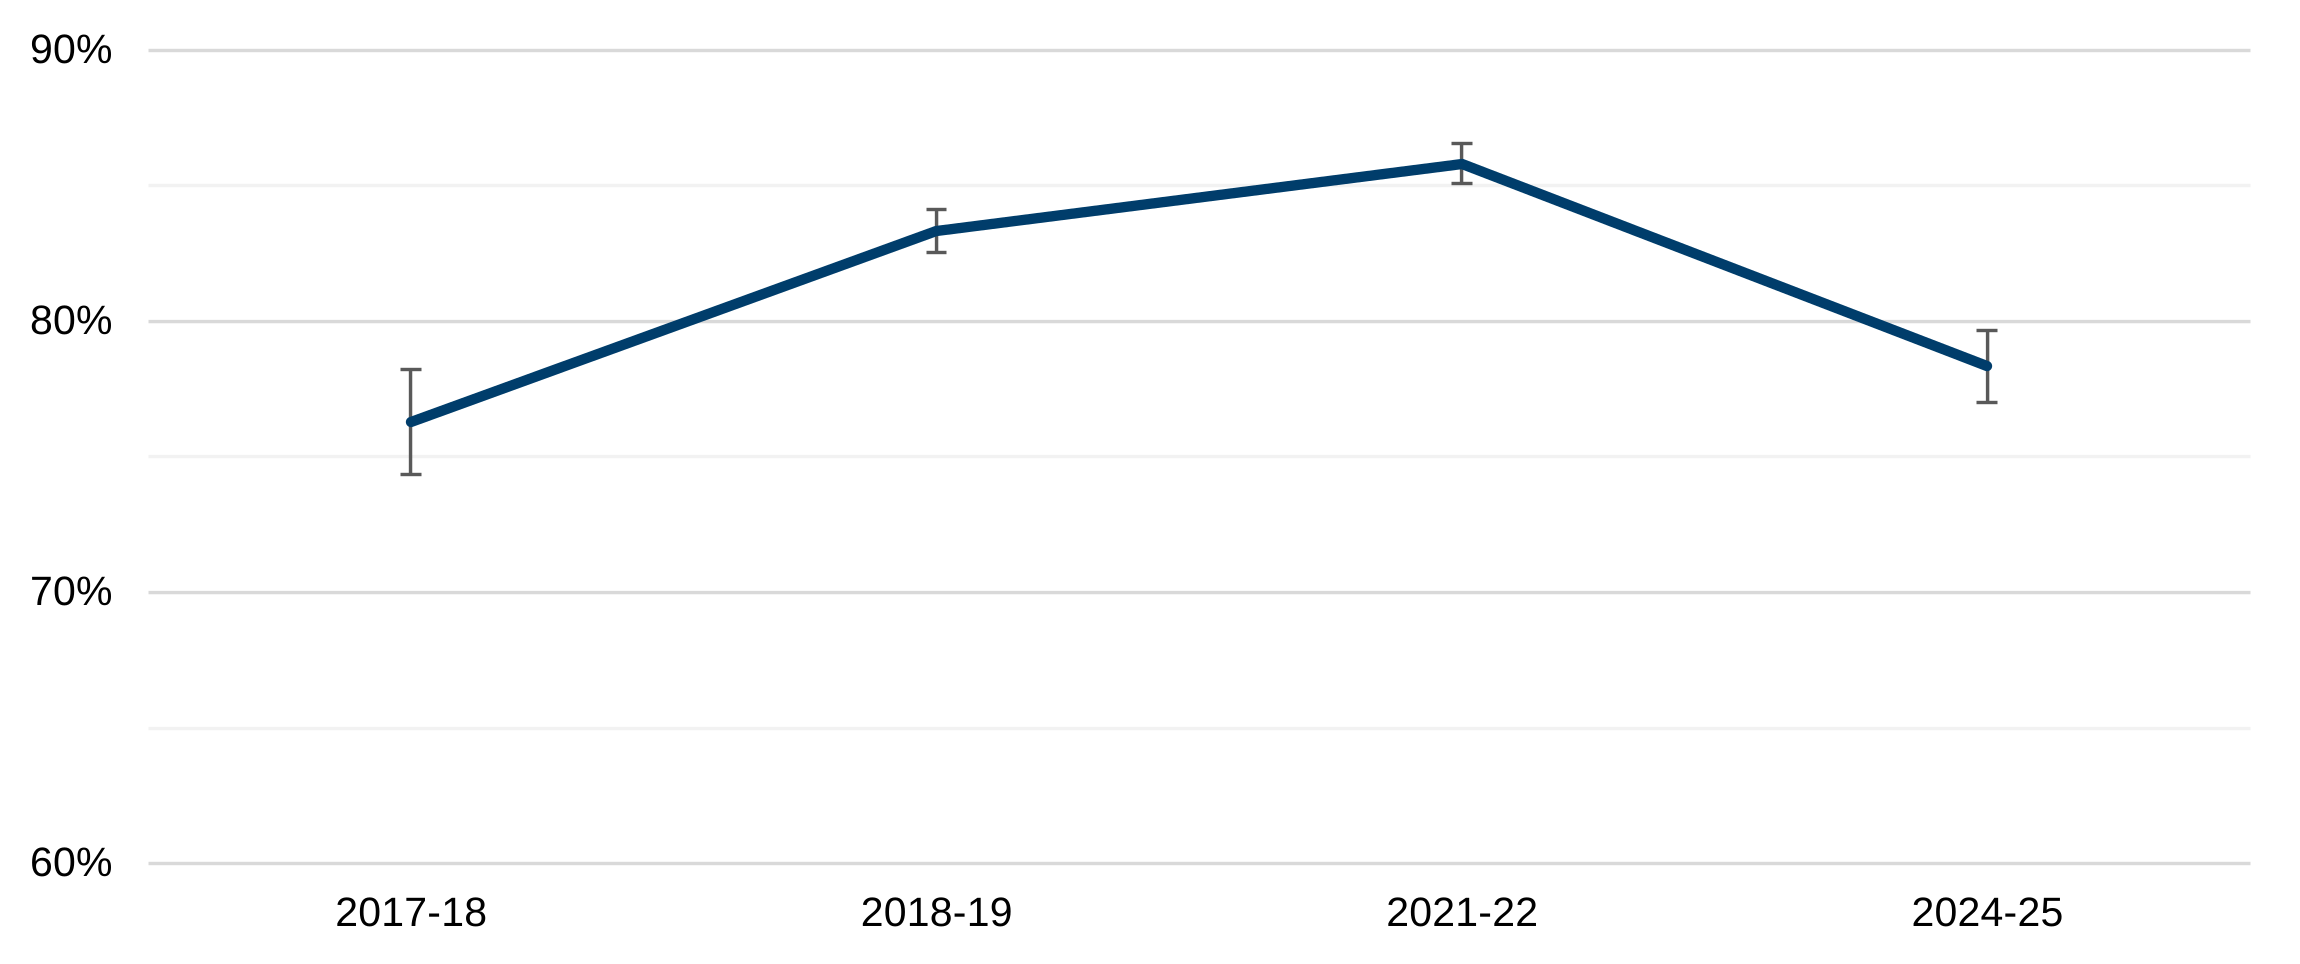
Description of figure 3: a line graph showing that the proportion of people who were satisfied with their ability to get to local services and facilities rose to a peak in 2021 to 2022 (86%). It then decreased to a similar proportion in 2024 to 2025 as in 2017 to 2018 (78%).
Source: National Survey for Wales.
The factors found to be linked with being satisfied with the ability to get to local services or facilities were:
- being married or in a civil partnership, or being single
- not having a limiting long-standing illness or disability
- living in an urban area
- having a high life satisfaction
- not having contacted their local councillor in the previous 12 months
- feeling like they belong to the local area
- feeling people from different backgrounds in the local area get on well together
People who were single, or who were married or in a civil partnership, were more likely to be satisfied with their ability to get to local services and facilities than people who were surviving partners from a marriage or civil partnership (see figure 4), even when taking factors like age and rurality into account.
Figure 4: percentage of people who were satisfied with their ability to get to local services or facilities, by marital status, April 2024 to March 2025
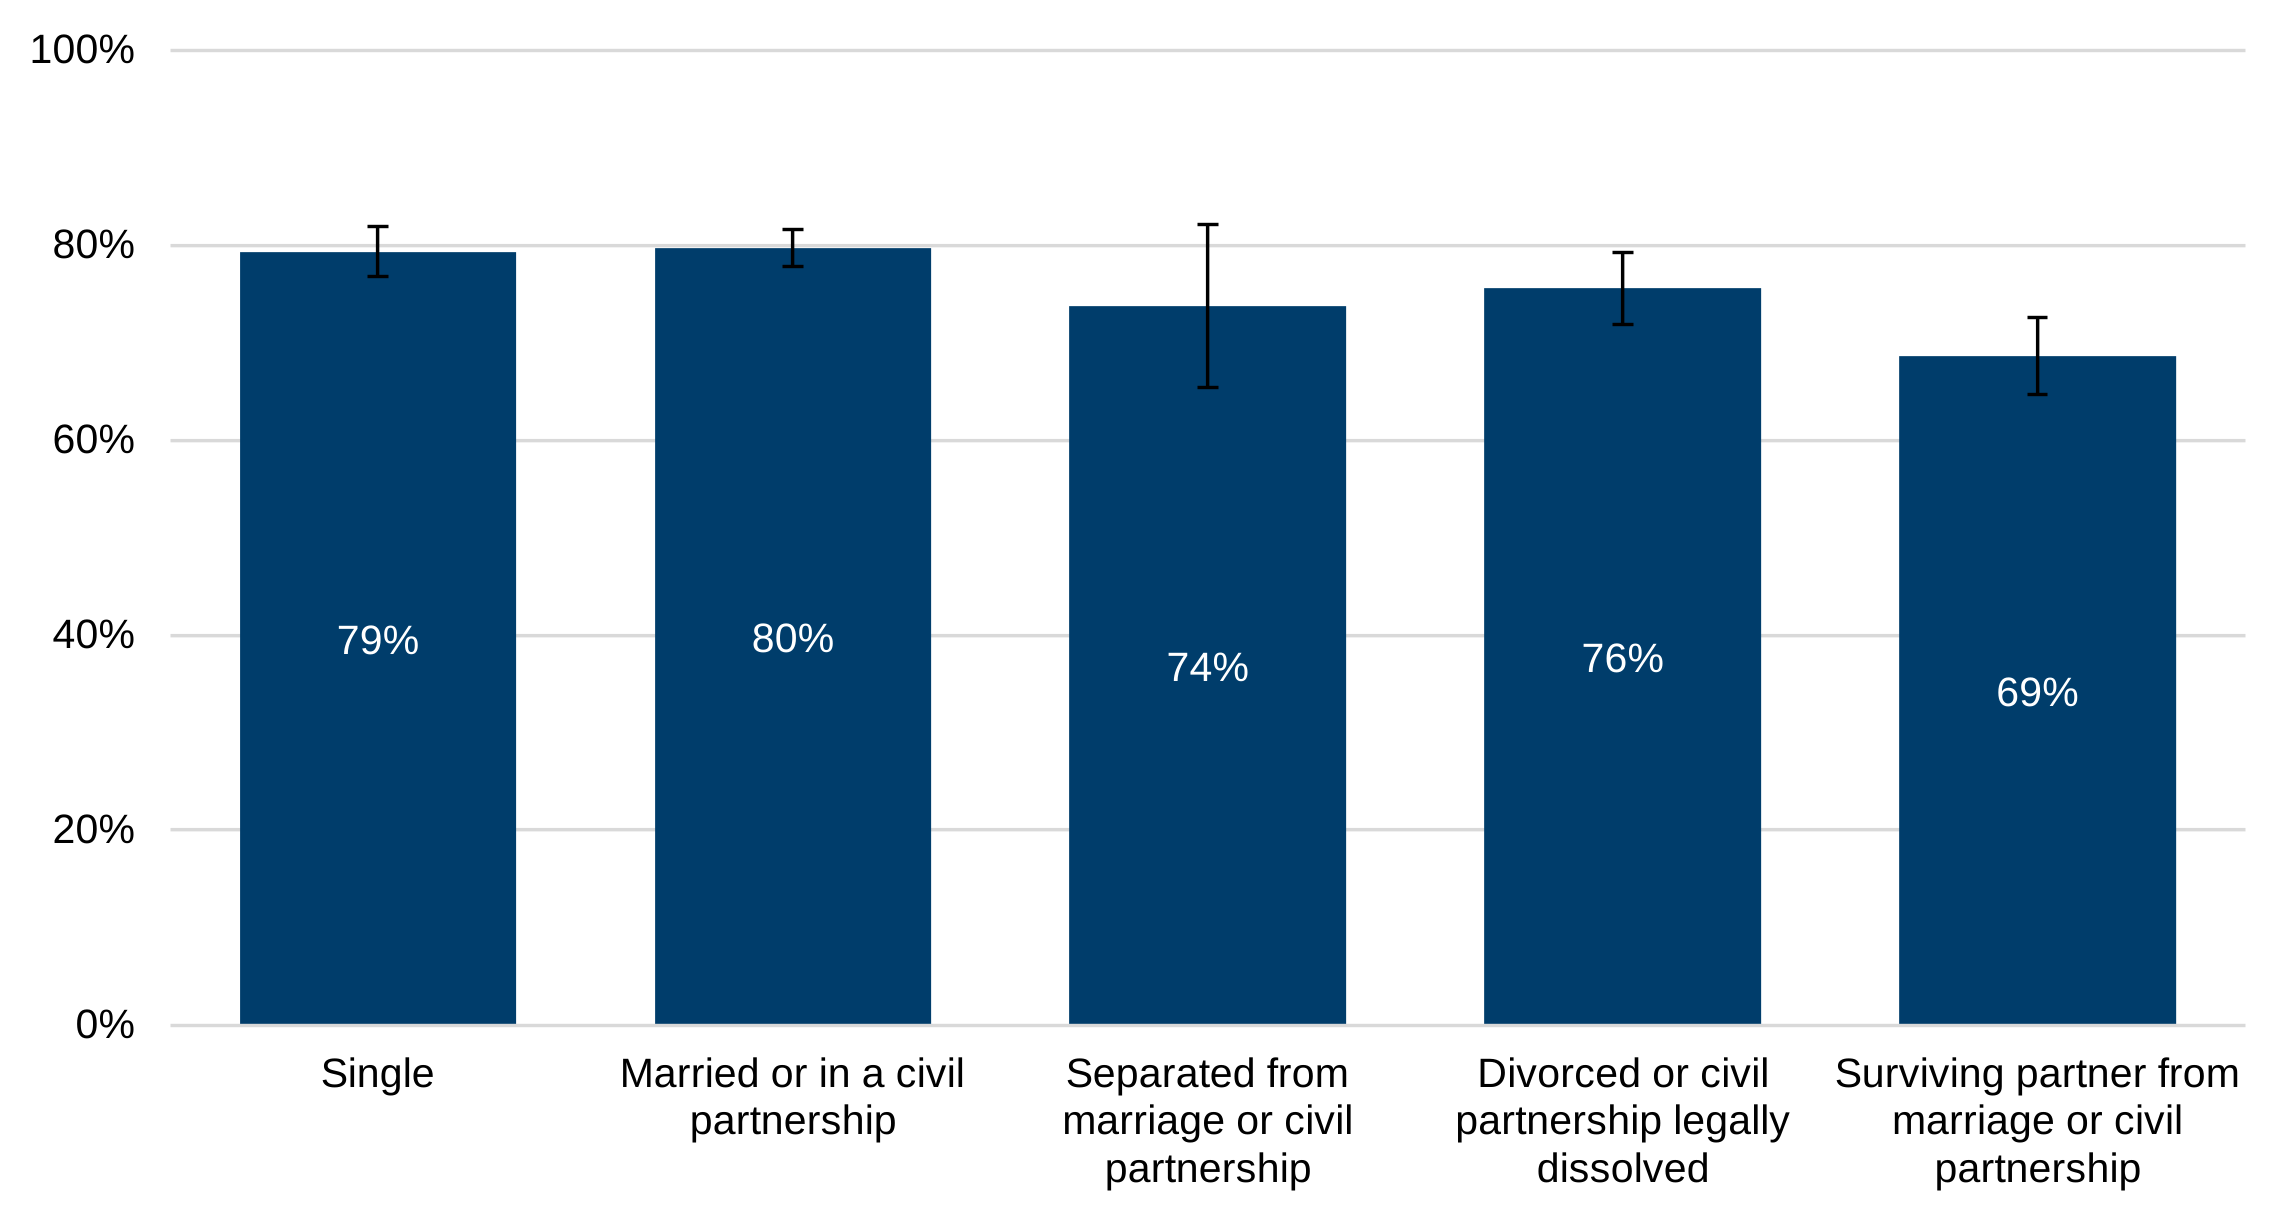
Description of figure 4: a bar chart showing that people who were single (79%) or were married or in a civil partnership (80%) were more likely to be satisfied with their ability to get to local services and facilities than people who were surviving partners from a marriage or civil partnership (69%).
Source: National Survey for Wales, April 2024 to March 2025.
People who did not have a limiting long-standing illness or disability were more likely to be satisfied with their ability to get to local services or facilities (82%) than people who did have a limiting long-standing illness or disability (72%).
People living in an urban area were more likely to be satisfied with their ability to get to local services or facilities (81%) than people living in a rural area (74%).
People with higher life satisfaction were more likely to be satisfied with their ability to get to local services and facilities. Those with a very high life satisfaction were most likely to be satisfied with their ability to get to local services (85%), followed by people with a high life satisfaction (79%). People with a medium life satisfaction were next most likely (69%), and people with a low life satisfaction were least likely (56%).
People who had not contacted their local councillor in the previous 12 months were more likely to be satisfied with their ability to get to local services and facilities (79%) than were people who had (74%).
People who strongly agreed that they belonged to their local area were the most likely to be satisfied with their ability to get to local services or facilities, as shown in Figure 5.
Figure 5: percentage of people who were satisfied with their ability to get to local services or facilities, by sense of belonging to their local area, April 2024 to March 2025
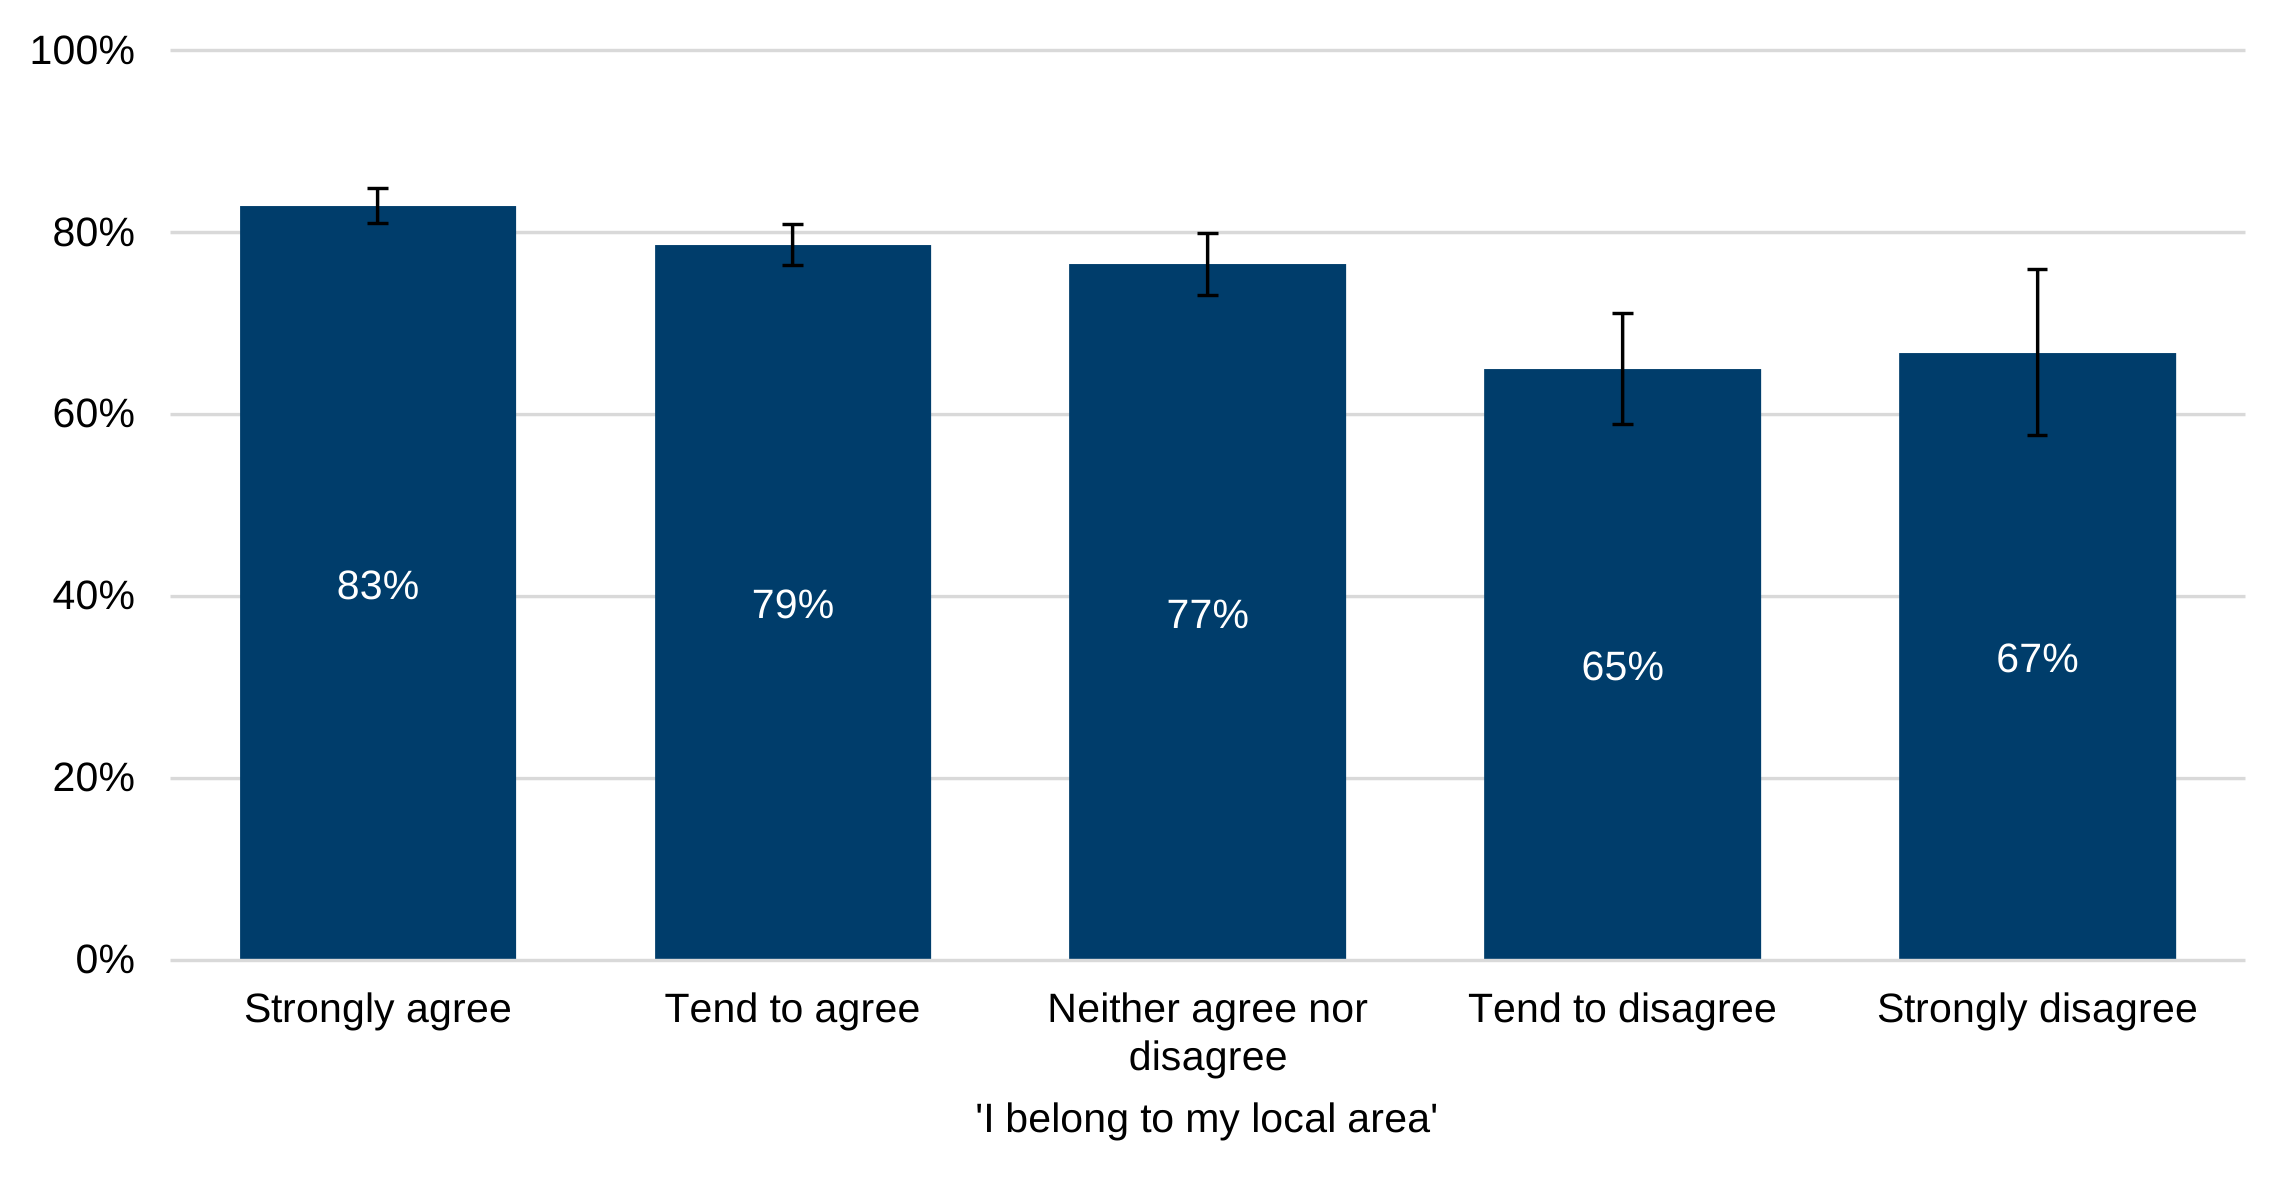
Description of figure 5: a bar chart showing people who strongly agreed (83%) or tended to agree (79%) that they belonged to their local area were more likely to be satisfied with their ability to get to local services and facilities than those who tended to disagree (65%) or strongly disagreed (67%).
Source: National Survey for Wales, April 2024 to March 2025.
Whether people from different backgrounds got on well together was also found to be linked with being satisfied with the ability to get to local services and facilities, as shown in figure 6.
Figure 6: percentage of people who were satisfied with their ability to get to local services or facilities, by agreement that people from different backgrounds in the local area got along well, April 2024 to March 2025
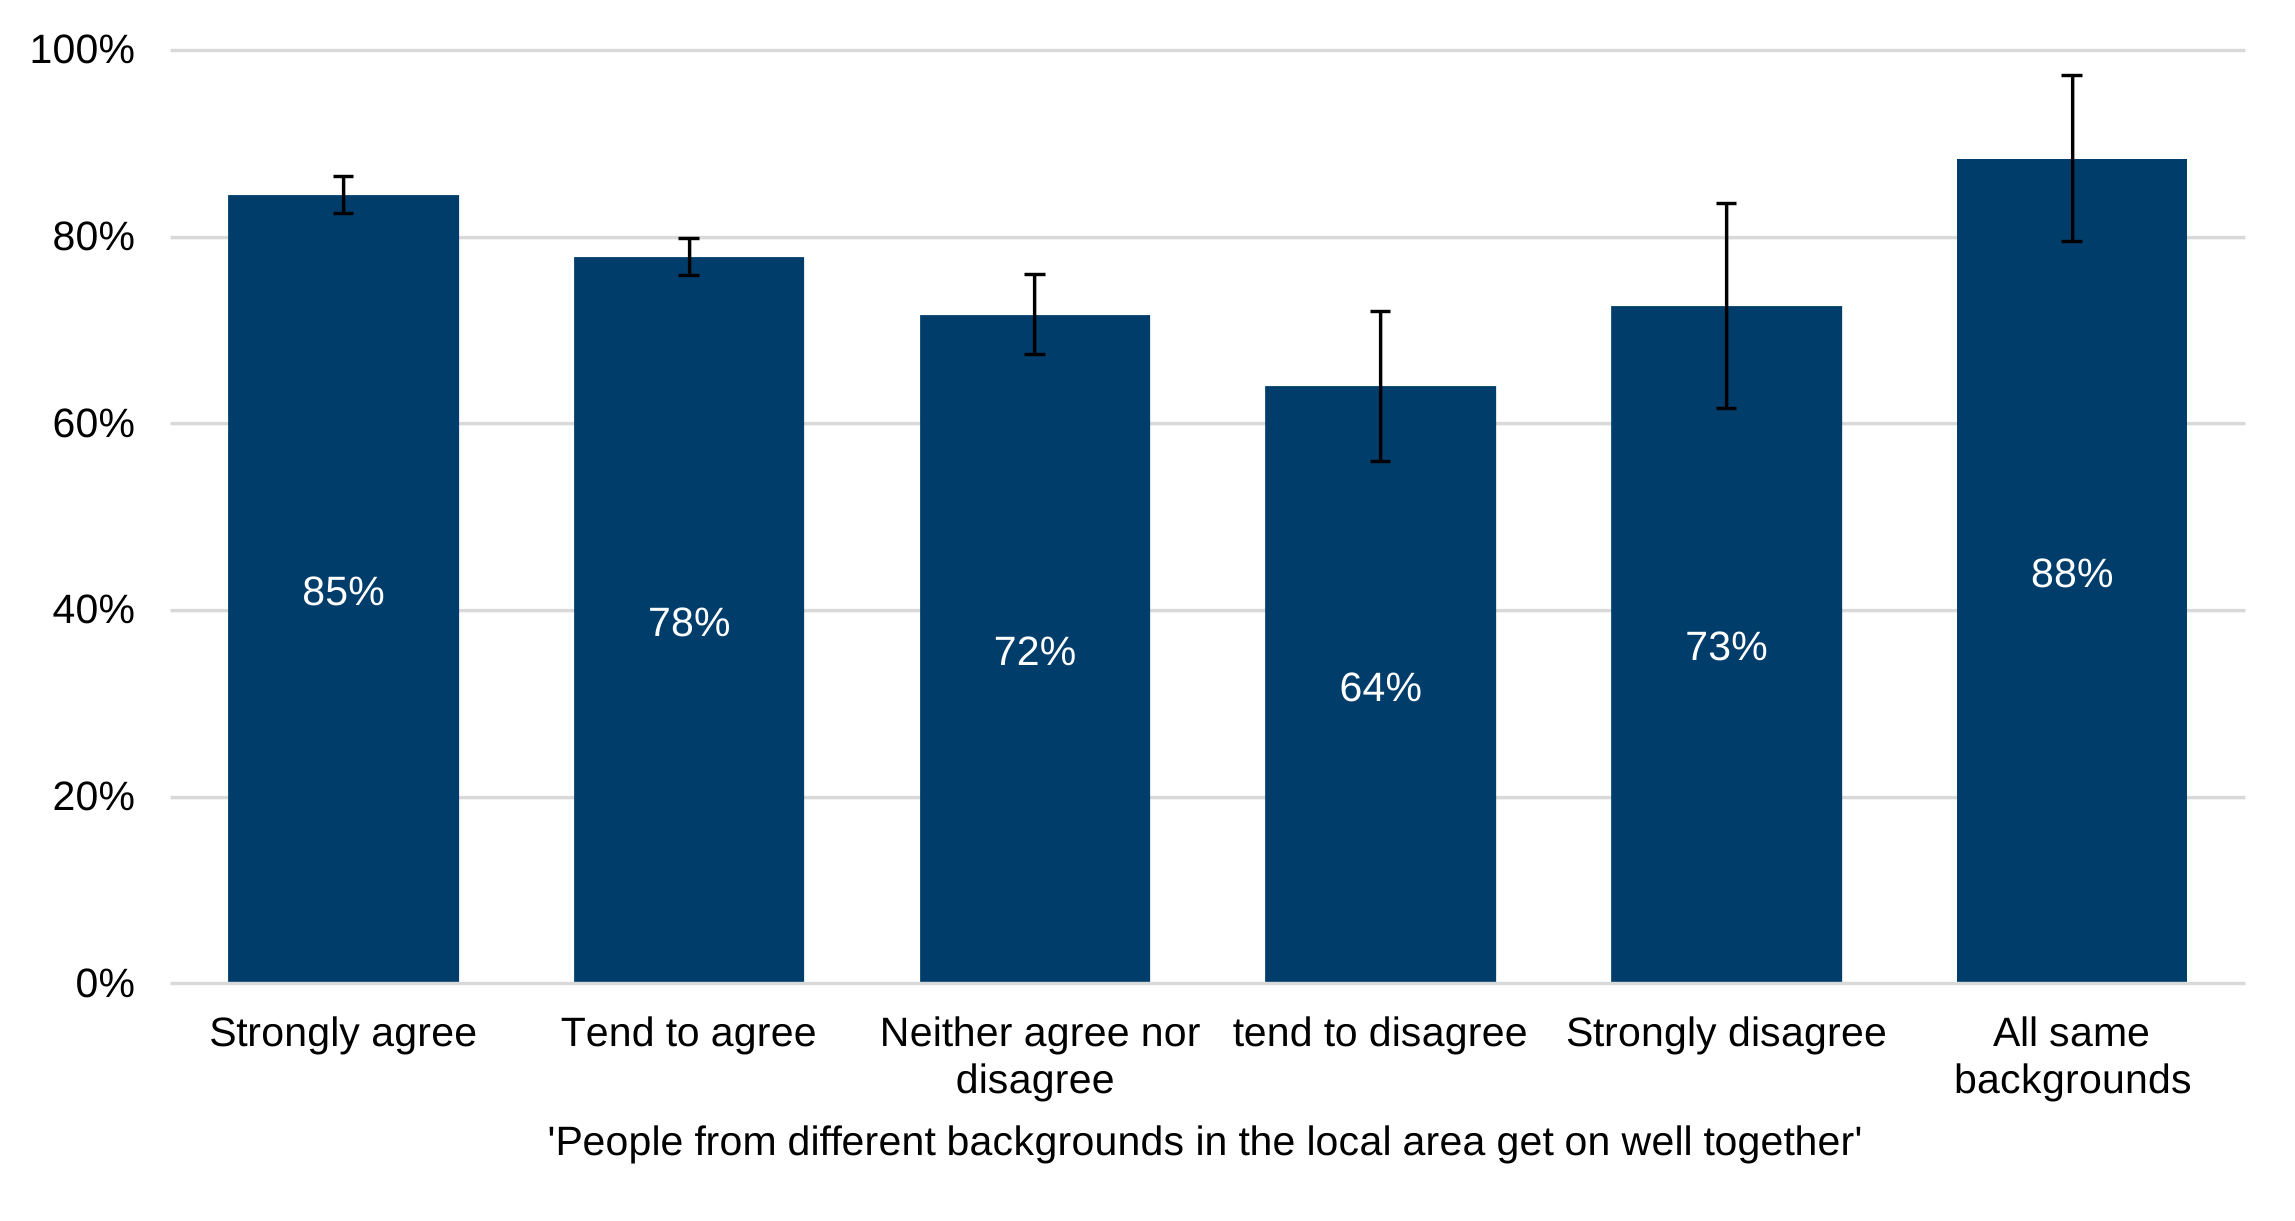
Description of figure 6: a bar chart showing that people who strongly agreed or tended to agree that people from different backgrounds in the local area got on well together (85% and 78%) were more likely to be satisfied with their ability to get to local services or facilities than those who neither agreed nor disagreed (72%), or who tended to disagree (64%). People who said that everyone in their local area was from the same background (88%) were also more likely to be satisfied with their ability to get to local services and facilities than these groups.
Source: National Survey for Wales, April 2024 to March 2025.
The following factors were also considered in the analysis. However, they were not found to be independently linked with being satisfied with the ability to get to local services or facilities.
- Sex
- Age
- Ethnicity
- Sexual orientation
- Religion
- Being able to speak Welsh
- Having previously served in the UK armed forces
- WIMD quintile
- Being in material deprivation
- Region
Belonging to the local area
People were asked whether they agreed with the statement ‘I belong to my local area’.
73% of people agreed that they belong to their local area. This is down from 79% in April 2021 to March 2022, the last time this question was asked (see figure 7).
Figure 7: percentage of people who agreed they belonged to their local area, from 2016 to 2025
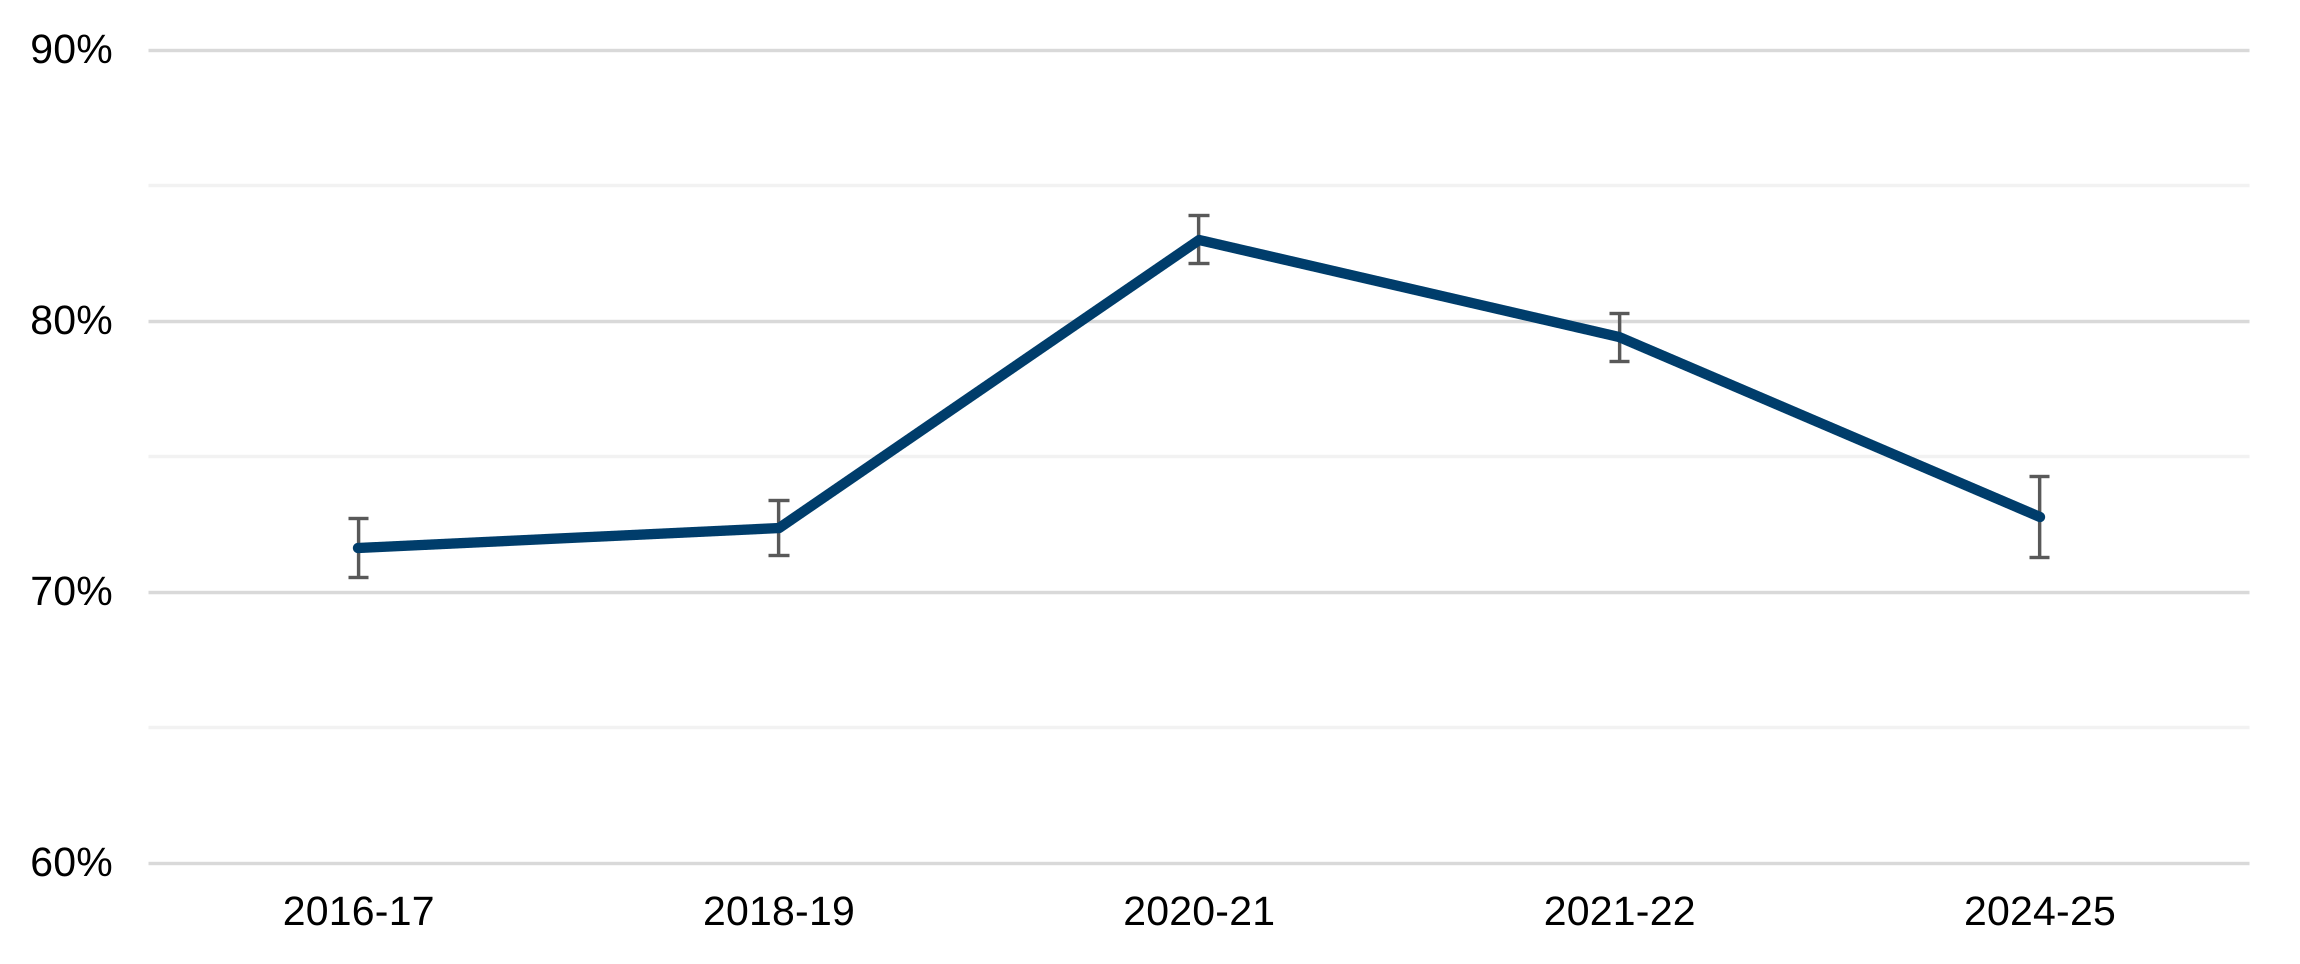
Description of figure 7: a line graph showing that the proportions of people who agreed that they belonged to their local area peaked at 83% in 2020 to 2021, before decreasing in 2024 to 2025 to similar proportions as 2016 to 2019.
Source: National Survey for Wales.
The factors found to be linked with belonging to the local area were:
- being older than 45
- being white or from an ethnic minority group (excluding white minorities)
- being Christian
- living in a rural area
- speaking Welsh
- having a very high life satisfaction
- having contacted their local councillor in the previous 12 months
- feeling that people from different backgrounds in the local area get on well together
People aged between 45 and 64, or 65 or older, were more likely to feel like they belong to their local area (77% and 80% respectively) than people aged 16 to 44 (65%).
73% of people in the white British ethnic group, and a similar proportion (77%) of people in an ethnic minority group (excluding white minorities) felt that they belonged to their local area. Both groups were more likely to agree compared with people from other white backgrounds (56%).
People who said they were Christian were more likely to feel they belonged to their local area (79%) than people who said they had no religion (68%). People who said they were part of another religion besides Christianity were not any more or less likely to feel they belong to their local area when compared with either Christians or non-religious people.
People who lived in a rural area were more likely to feel that they belong to their local area (79%) than people who lived in an urban area (70%).
People who could speak Welsh (81%) were more likely to feel they belong to their local area than people who could not (70%).
People with very high life satisfaction (83%) were most likely to feel they belonged to their local area, followed by people with high life satisfaction (72%). People with medium life satisfaction were next most likely to feel they belonged (61%), and people with low life satisfaction were least likely (50%).
People who had contacted their local councillor in the last 12 months were more likely to feel like they belonged to their local area (80%) than people who had not (72%).
People who agreed that people from different backgrounds in their local area got on well together were more likely to feel they belonged to their local area than people who did not agree with that statement (see figure 8).
Figure 8: percentage of people who felt they belonged to their local area, by whether they feel that people from different backgrounds in the local area get on well together, April 2024 to March 2025
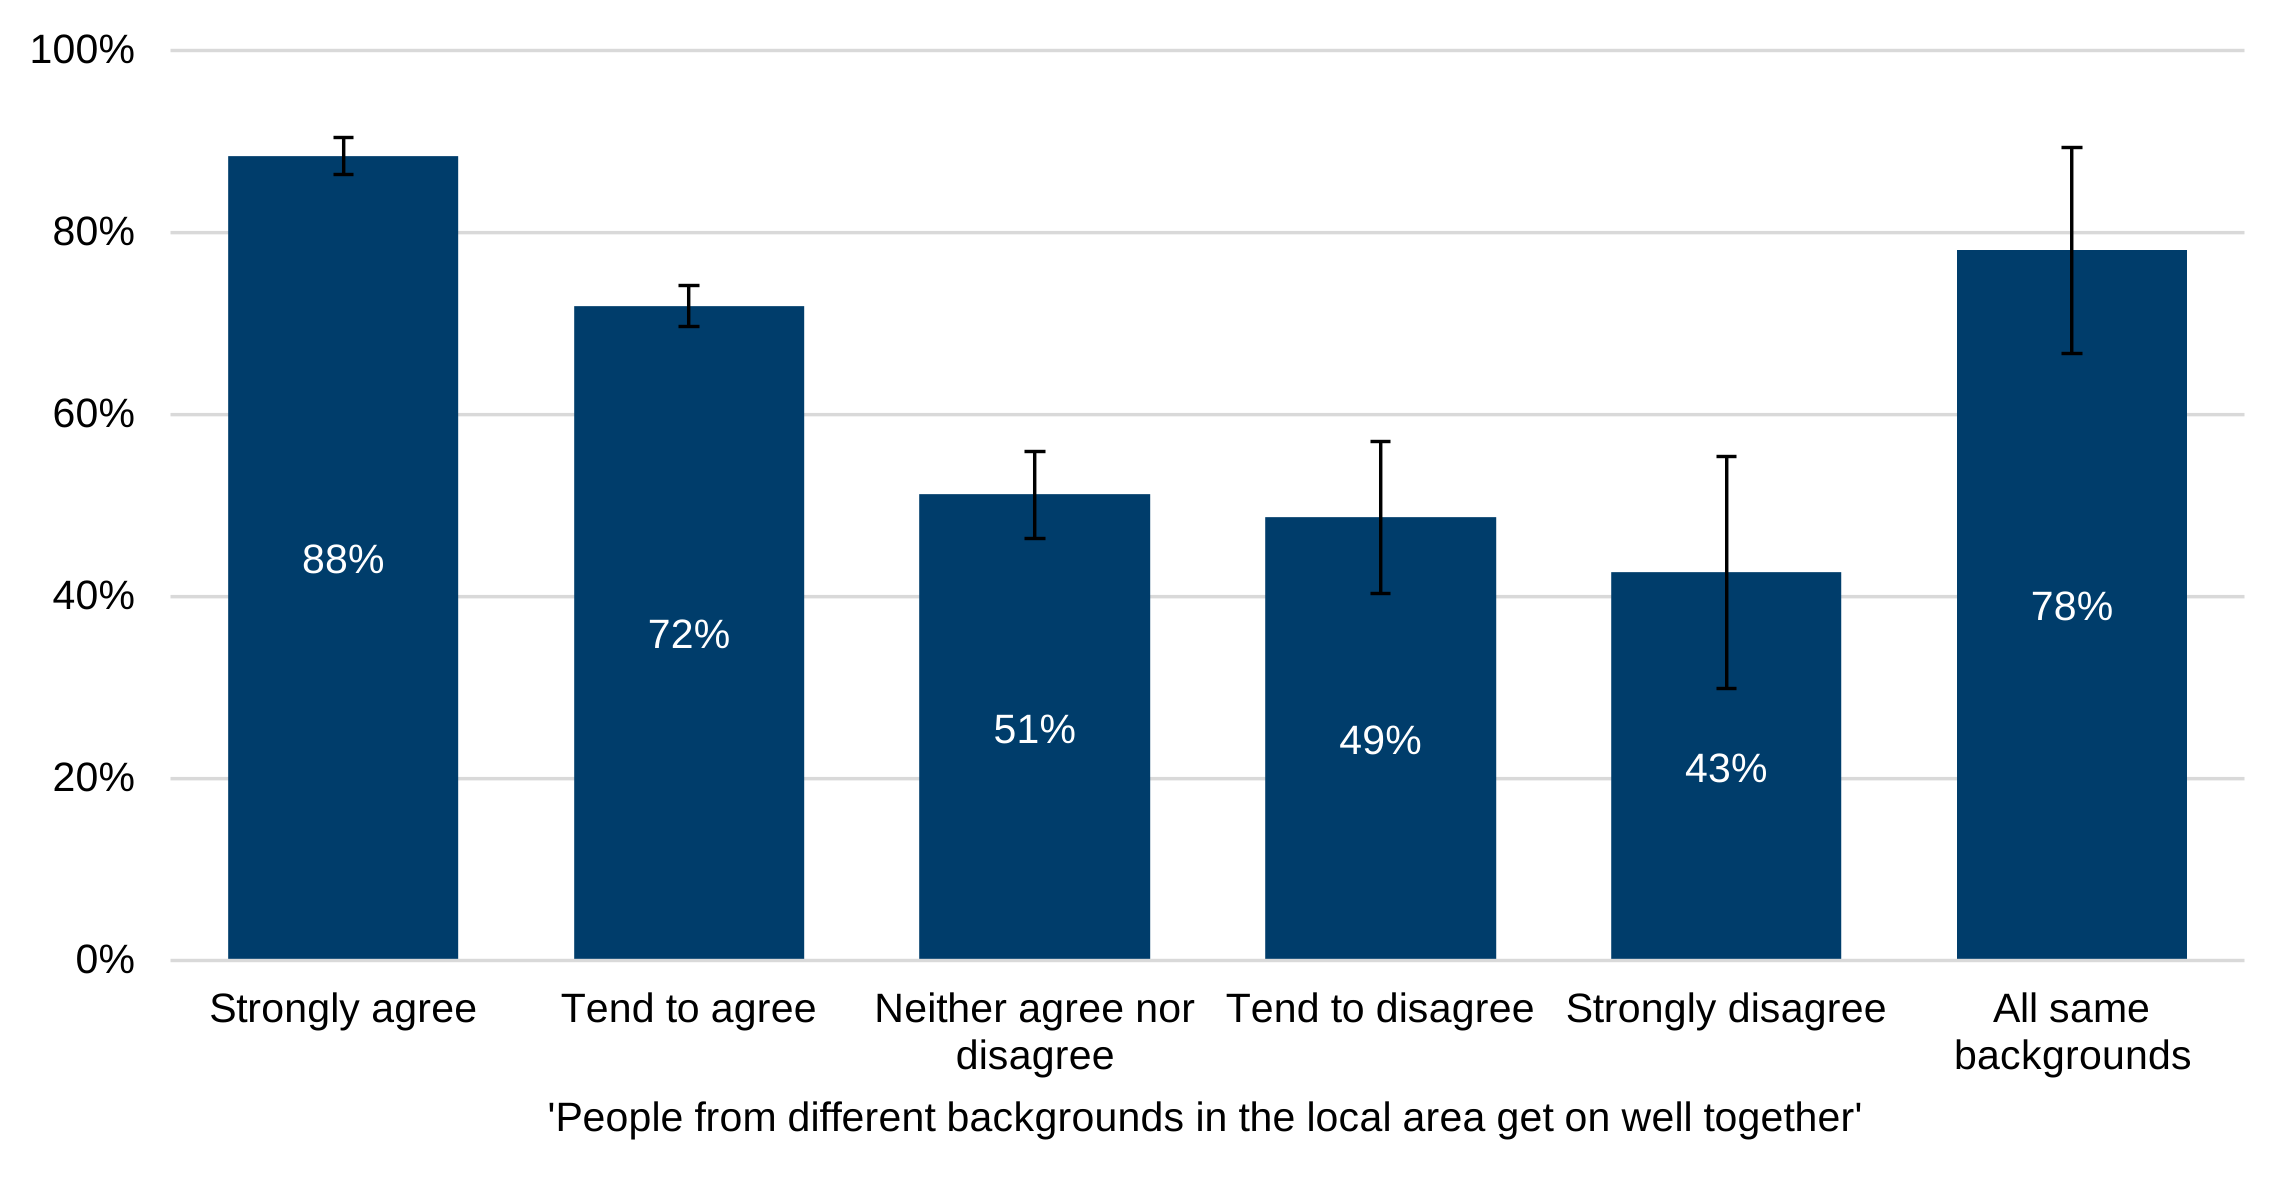
Description of figure 8: a bar chart showing that people who strongly agreed, or tended to agree that people from different backgrounds in their local area got on well together (88% and 72% respectively) were more likely to feel they belonged to their local area than people who neither agreed nor disagreed (51%), tended to disagree (49%), or strongly disagreed (43%). People who said that people in their local area were all from the same backgrounds were also more likely to feel that they belonged to their local areas than those from these groups.
Source: National Survey for Wales, April 2024 to March 2025.
Whether someone had previously served in the UK armed forces was also found to be linked with feeling of belonging to the local area. Similar proportions of veterans and non-veterans felt they belonged to their local area (69% and 73%, respectively).
Other factors were also considered in the analysis but were not found to be independently linked with belonging to the local area. These factors were:
- sex
- sexual orientation
- having a limiting long-standing illness or disability
- marital status
- WIMD quintile
- being in material deprivation
- region
- being satisfied with the ability to get to local services or facilities
People in the local area from different backgrounds get on well together
People were asked to what extent they agreed with the statement ‘people in the local area from different backgrounds get on well together’.
80% of people thought that people from different backgrounds in their local area got on well together (see figure 9). This is down from 82% in April 2021 to March 2022, the last time this question was asked.
Figure 9: percentage of people who agreed that people in their local area from different backgrounds got on well together, from 2016 to 2025
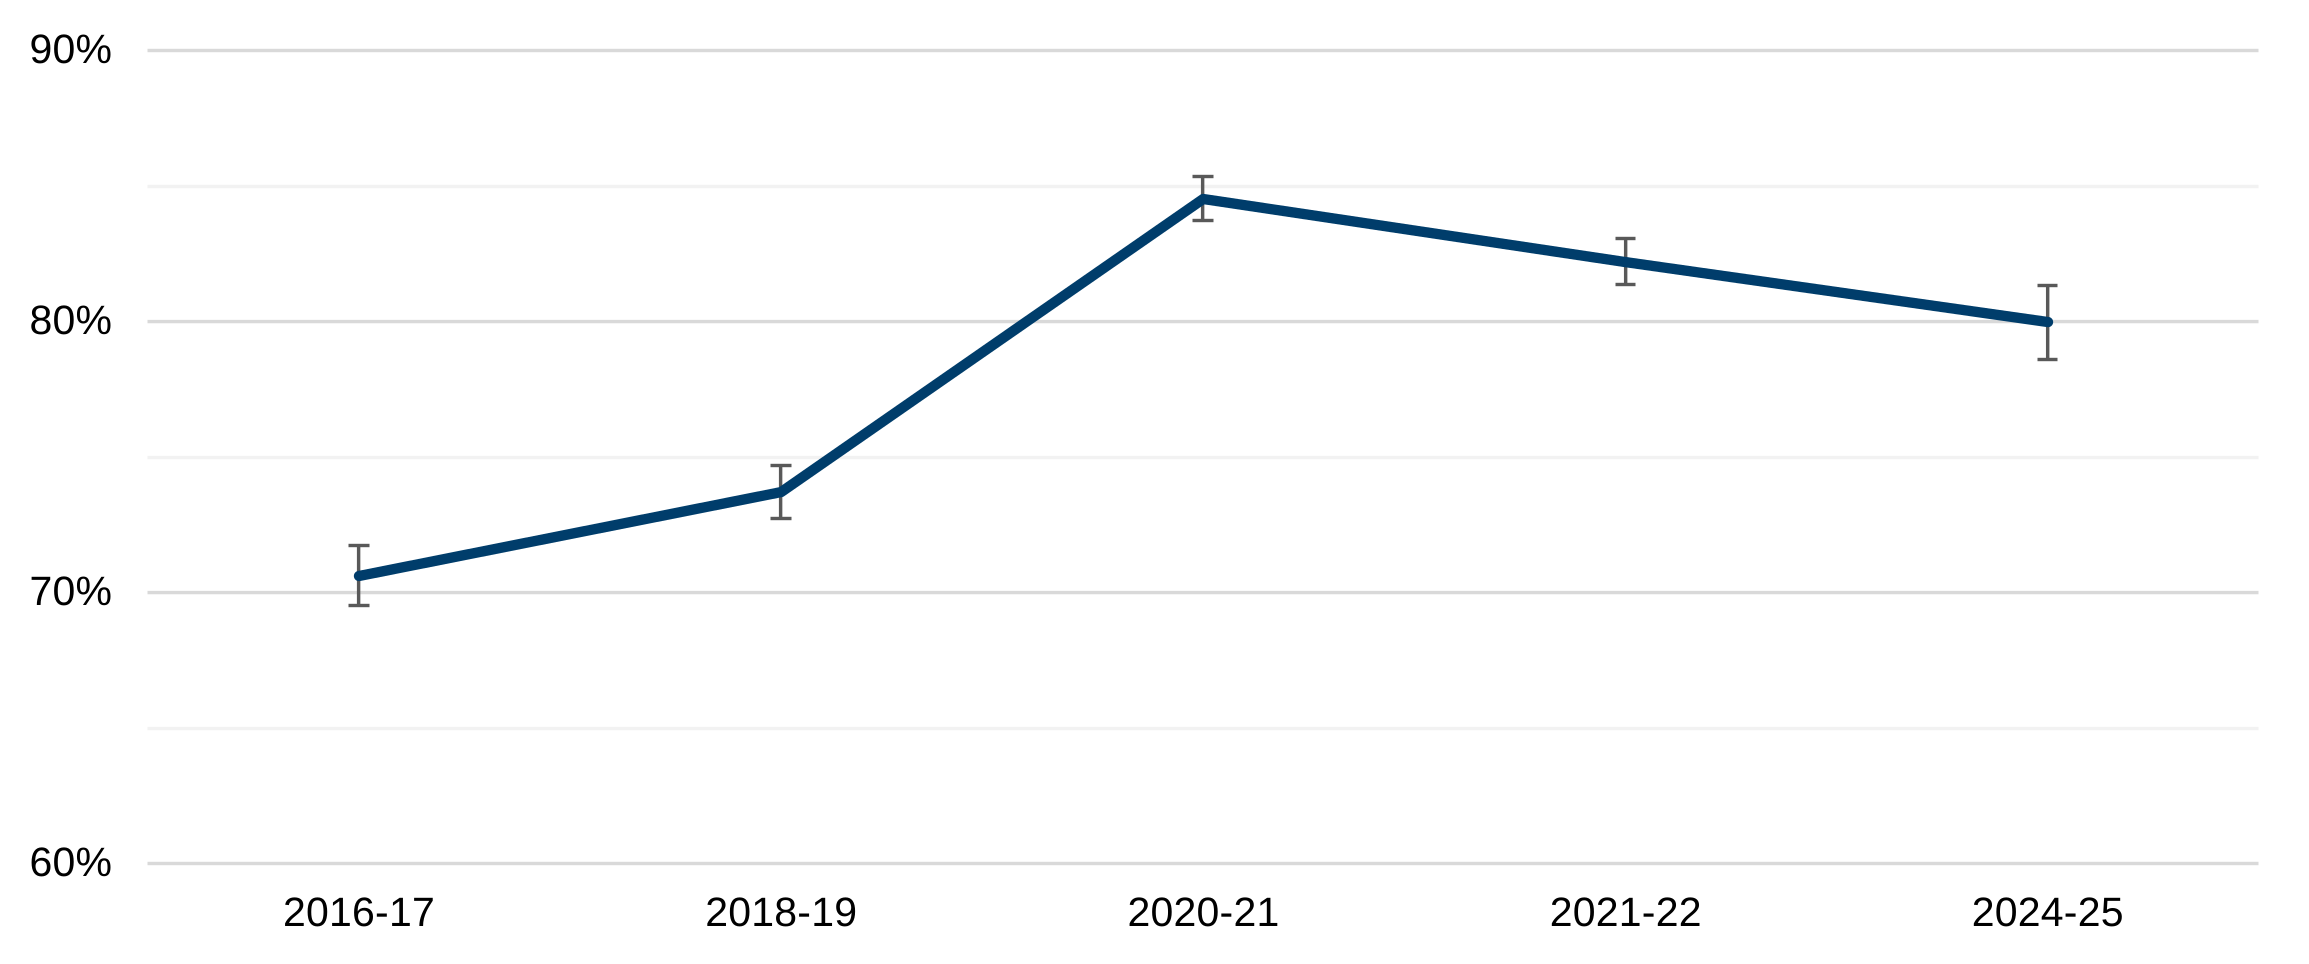
Description of figure 9: a line chart showing that the percentage of people who agreed that people from different backgrounds in their local area got on well together peaked in 2020 to 2021 (85%). It then decreased to 80% in 2024 to 2025, but was still at a higher proportion than 2018 to 2019.
Source: National Survey for Wales.
The factors linked with agreeing that people in the local area from different backgrounds get on well together were:
- being older
- not having a limiting long-standing illness or disability
- not being in the most deprived WIMD quintile
- being satisfied with the ability to get to local services or facilities
- feeling like they belong to the local area
People aged 65 or older were more likely to agree that people in their local area from different backgrounds get on well together (84%) than people aged 16 to 44 (78%), or 45 to 64 (79%).
People who did not have a limiting long-standing illness or disability were more likely to agree that people in their local area from different backgrounds get on well together (82%) than people who did have such an illness or disability (76%).
People from the most deprived quintile of the Welsh Index of Multiple Deprivation (WIMD) were less likely to agree that people in their local area from different backgrounds get on well together than people in the third, fourth or least deprived quintiles (see figure 10).
Figure 10: percentage of people who agreed that people in their local area from different backgrounds get on well together, by WIMD quintile, April 2024 to March 2025
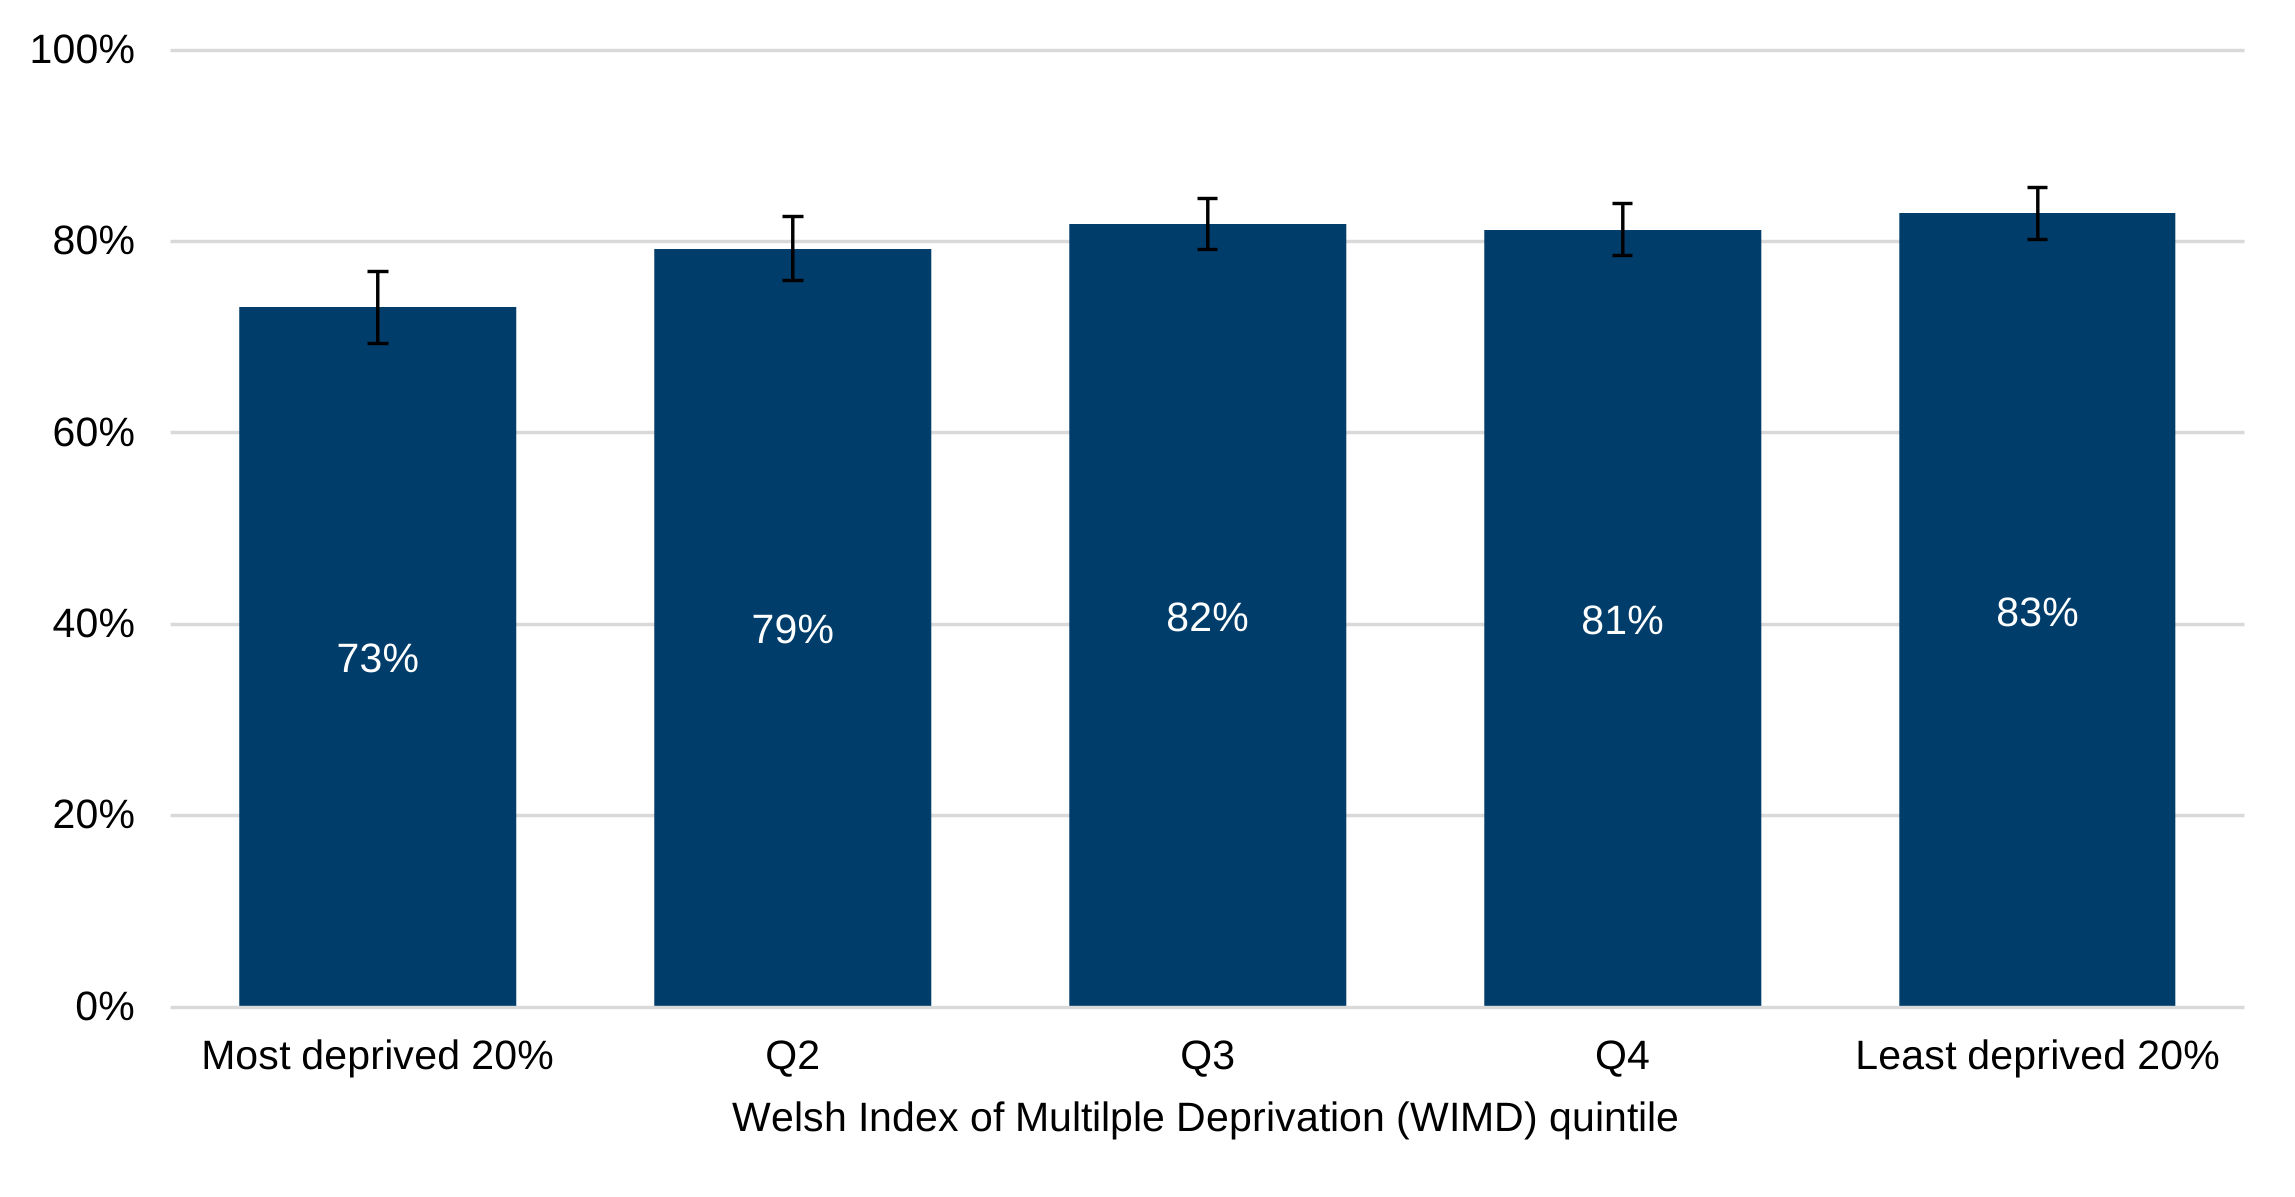
Description of figure 10: a bar chart showing that people in the most deprived quintiles (73%) were less likely to agree that people in their local area from different backgrounds get on well together than people in the third, fourth, or least deprived quintiles (82%, 81%, and 83%, respectively).
Source: National Survey for Wales, April 2024 to March 2025.
People who were satisfied with their ability to get to local services and facilities were more likely to agree that people in their local area from different backgrounds get on well together (82%) than people who were not satisfied (73%).
People who agreed that they belonged to their local area were also more likely to agree that people in their local area from different backgrounds get on well together than others (see figure 11).
Figure 11: percentage of people who agreed that people in their local area from different backgrounds get on well together, by sense of belonging to their local area, April 2024 to March 2025
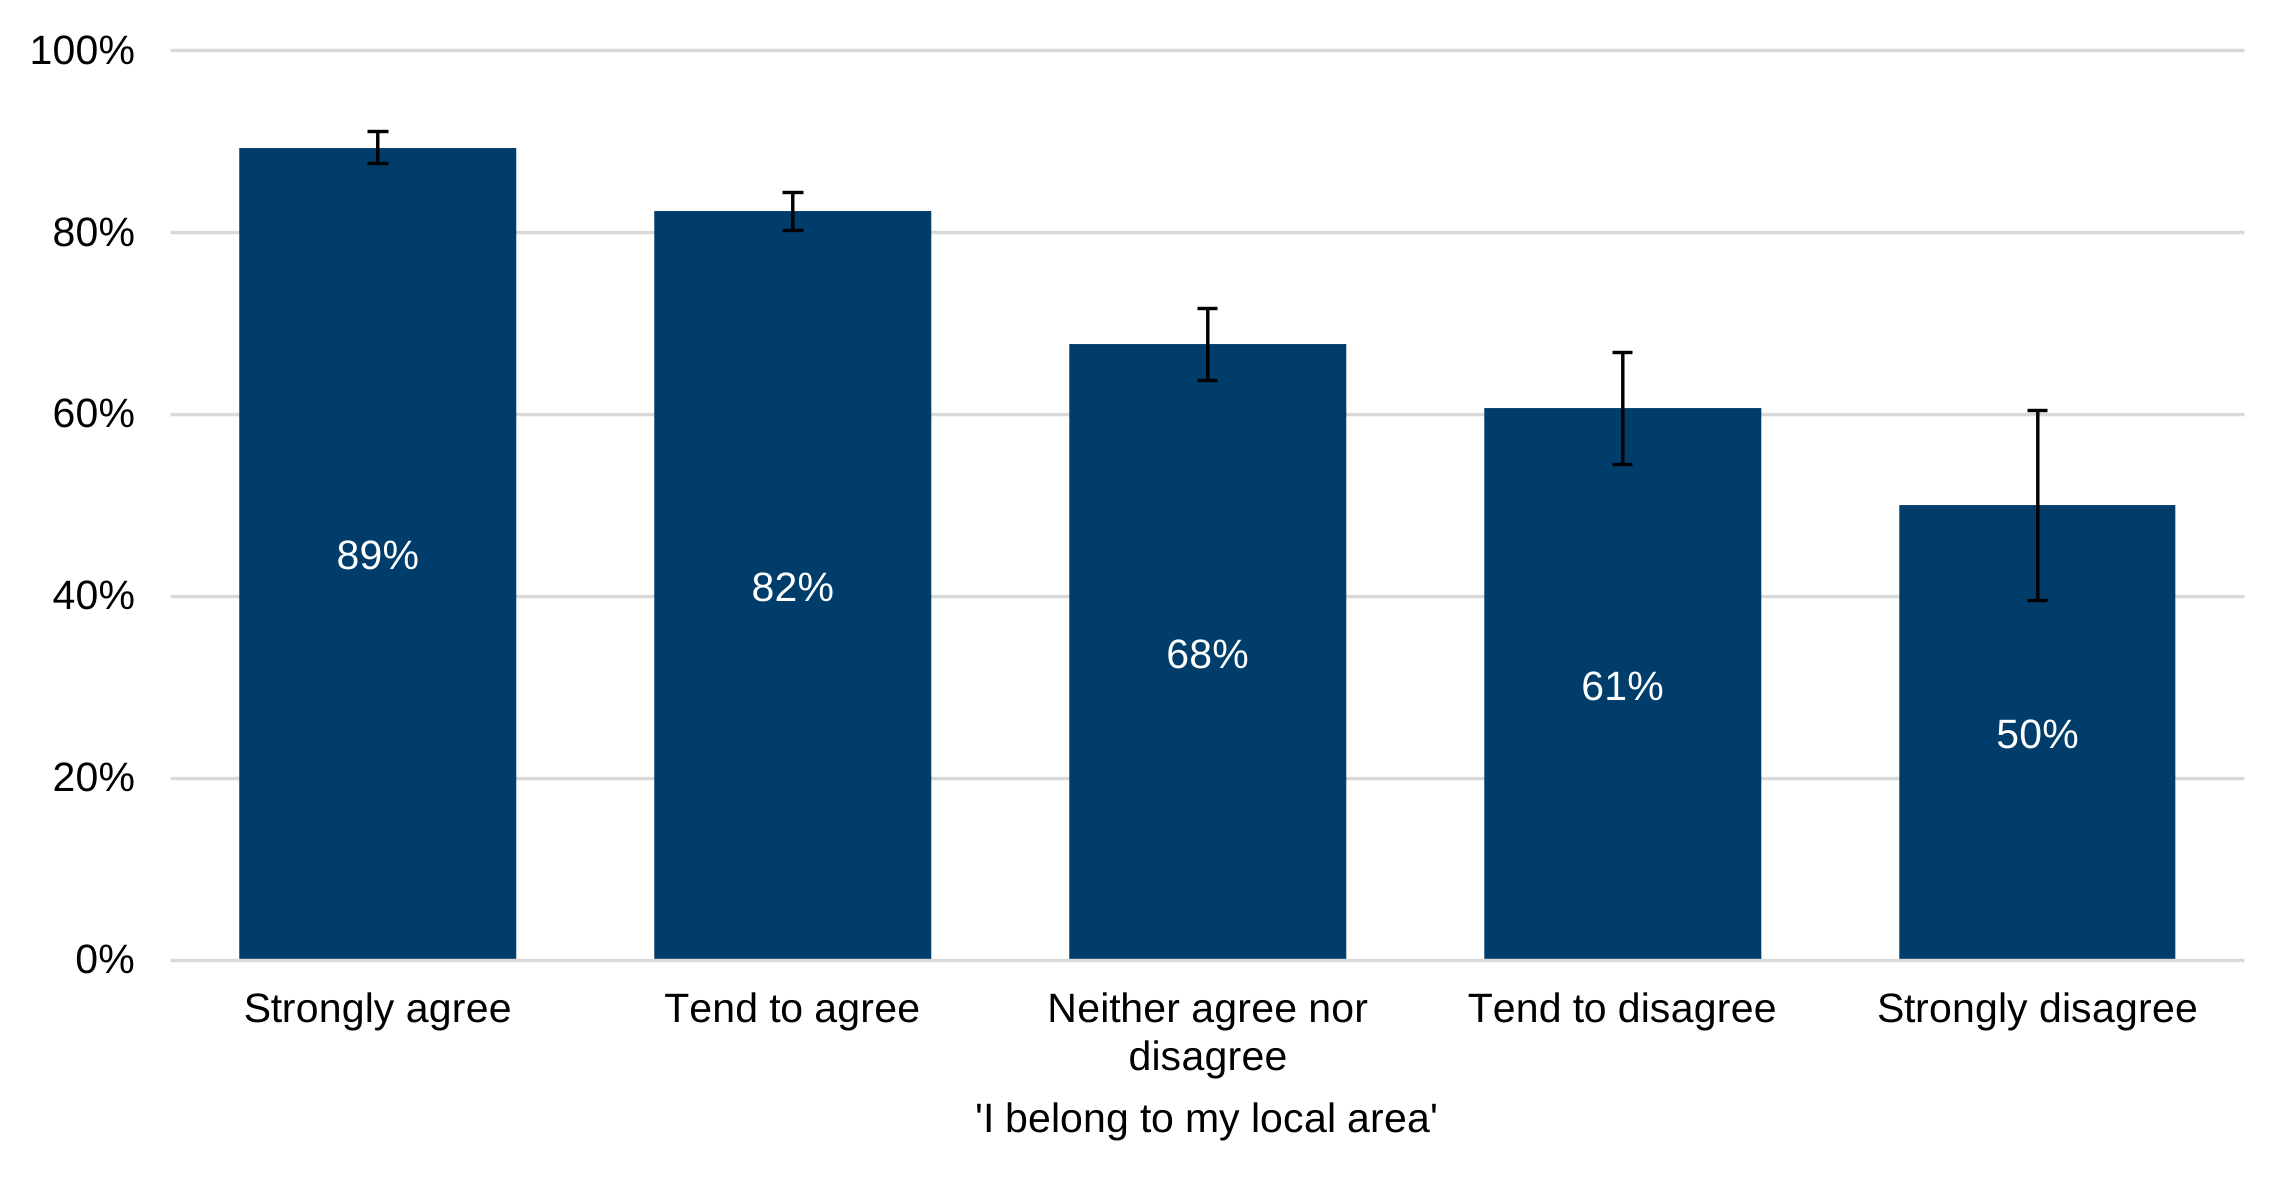
Description of figure 11: a bar chart showing that people who strongly agreed they belonged to their local area (89%) were most likely to feel that people in their local area from different backgrounds got on well together, followed by people who tended to agree they belonged to their local area (82%). People who neither agreed nor disagreed that they belonged to their local area (68%) were more likely to feel people in their local area from different backgrounds got on well together than people who strongly disagreed they belonged to their local area (50%).
Source: National Survey for Wales, April 2024 to March 2025.
Sex was also found to be linked with agreeing that people in the local area from different backgrounds get on well together. Similar proportions of males and females felt that people from different backgrounds got on well together (82% and 78%, respectively).
The following factors were also considered in the analysis. However, they were not found to be independently linked with people from different backgrounds in the local area getting on well together.
- Ethnicity
- Marital status
- Being in material deprivation
- Having contacted their local councillor in the last 12 months
- Living in an urban or rural area
- Being able to speak Welsh
- Life satisfaction
- Region
- Sexual orientation
- Religion
- Having previously serviced in the UK armed forces
Policy context
The Welsh Government is committed to supporting effective local democracy and ensuring that people can influence decisions affecting their communities. The Local Government and Elections (Wales) Act 2021 (UK legislation) includes measures to encourage public participation in local government, while the Well-being of Future Generations (Wales) Act 2015 (UK legislation) emphasises involving people in decisions that affect their lives and communities.
Alongside participation in decision-making, people's experiences of accessing local services and facilities are an important aspect of community well-being and can provide insights into how effectively communities are served. Understanding residents' views on both their ability to influence local decisions and their ability to access services provides evidence to inform policy development and service delivery across Wales.
Cohesion is the extent to which people in a community treat each other with respect, get along with one another and participate to ensure everyone can access their human rights and fulfil their potential. Community cohesion matters because it is the foundation for how we can all live well together in safe, inclusive societies, where individuals can thrive and collective progress is possible. Building cohesive communities requires both individual and collective responsibility to be taken, for the benefit of us all. More information about the Welsh Government’s Cohesion Principles.
Quality and methodology information
The National Survey for Wales is a large-scale, random-sample telephone survey covering adults aged 16+ across Wales.
‘I can influence decisions affecting my local area’, ‘I belong to my local area’, and ‘people from different backgrounds in my local area get on well together’ questions were answered based on a 5-point scale from strongly agree to strongly disagree. People who responded with either ‘tend to agree’ or ‘strongly agree’ were classified as agreeing with the statement for the respective sections.
Methodology
Addresses were selected at random, and invitations sent by post requesting that a phone number be provided for the address. A phone number could be provided via an online portal or a telephone enquiry line. Where no phone number was provided, telematching was undertaken with available databases of phone numbers to see if one can be found for the address.
The interviewer then called the phone number for the address, established how many adults live there, and selected one at random (the person with the next birthday) to take part in the survey. The selected person was interviewed by phone. Once they had completed the phone section, they were asked to complete an online section and details were sent to them.
If no number was obtained for the address then for a randomly-chosen 46% of such cases the interviewer made a visit to the address to select a respondent and either carried out an in-home, face-to-face interview with them or (if a phone interview was preferred) collected a phone number for them.
The survey lasted around 40 to 45 minutes on average and covers a range of topics. Respondents were offered a £15 voucher to say thank you for taking part. The achieved sample size each month was around 500 people on average, and the response rate was 18.7% of those eligible to take part.
Survey weighting
Survey weights are used to bring a sample of a population closer to the full population in terms of age, sex, and local authority size, as well as to compensate for variation from target in the numbers of interviews in each health board within each quarter. The weights reduce but will not eliminate the effects of differences in the achieved sample compared with previous years and with the general population. For the April 2024 to March 2025 sample, there is a less even spread of interviews across the year (for example, proportionately fewer in February and March) compared with previous years. As such, care should therefore be taken when comparing results with previous years, and any differences should be explored in the context of other sources.
Statistical analysis
This release uses regression analysis to allow us to look at the relationship with a given factor while keeping other things constant (sometimes referred to as “controlling for other factors”). However, it does not mean that the given factor is caused by these other factors, or vice versa.
Where the text of this release notes a difference between 2 survey results, we have checked to ensure that the confidence intervals (sometimes called the “margin of error”) for the 2 results do not overlap. This suggests that the difference is statistically significant, meaning that there is less than a 5% or 1 in 20 chance that the results are due to a quirk of the survey sample rather than reflecting a real difference in the wider population. Where no difference is noted, the confidence intervals do overlap.
The survey questionnaire is available on our web pages.
Detailed charts and tables of results are available in our interactive results viewer. For information on data collection and methodology please see our Quality report and Technical report.
Statement of compliance with the Code of Practice for Statistics
Our statistical practice is regulated by the Office for Statistics Regulation (OSR). OSR sets the standards of trustworthiness, quality and value in the Code of Practice for Statistics that all producers of official statistics should adhere to.
All of our statistics are produced and published in accordance with a number of statements and protocols to enhance trustworthiness, quality and value. These are set out in the Welsh Government’s Statement of Compliance.
These official statistics in development (OSR) demonstrate the standards expected around trustworthiness, quality and public value in the following ways.
Trustworthiness
All personal data underlying these statistics is processed in accordance with the requirements of the Data Protection Act 2018.
National Survey for Wales statistics are published in an accessible, orderly, pre-announced manner on the Welsh Government website at 9:30am on the day of publication. All releases are available to download for free.
All outputs adhere to the Code of Practice by pre-announcing the date of publication through the upcoming calendar web pages. Access to the data during processing is restricted to those involved in the production of the statistics, quality assurance and for operational purposes. Pre-release access is restricted to eligible recipients in line with the Code of Practice (UK Statistics Authority).
The published figures are compiled by professional analysts using the latest available data.
Quality
As noted above, the achieved sample size for the National Survey 2024 to 2025 (6,000 respondents) is smaller than originally planned. The smaller sample size is due to the contractor encountering fieldwork issues including response rates being lower than in previous years. There are also changes in the composition of the achieved unweighted sample compared with previous years.
In July 2025 we therefore requested and received from the OSR a temporary suspension of accredited official statistics status for this first release and for other outputs based on the April 2024 to March 2025 data. The temporary suspension reflects the fact that the April 2024 to March 2025 outputs generally do not provide sufficiently precise results for small geographic areas and other small subgroups, and that care should be taken in comparing some April 2024 to March 2025 results with those from previous years. All outputs based on April 2024 to March 2025 data are badged as official statistics in development.
It is still appropriate to use these statistics. At a national level, estimates continue to provide a reasonable indication of estimates for Wales, particularly if used alongside alternative sources. However, users should note the wider confidence intervals particularly for smaller geographies and population sub-groups.
All stages in the collection, validation and production of these statistics are led by professional statisticians, and the statistics are produced free from any political interference. All statistics are quality-assured prior to publication.
Statistics published by Welsh Government adhere to the Statistical Quality Management Strategy which supplements the Quality pillar of the Code of Practice for Statistics and the European Statistical System principles of quality for statistical outputs.
Set-up work for a new online-first survey design is progressing well, and mainstage fieldwork will begin in March 2026, with first results due in summer 2027. One main advantage of the new approach is that it will be possible to deliver much larger achieved sample sizes, and therefore much more precise estimates for small subgroups. Following the start of mainstage fieldwork under the new design in April 2026 to March 2027, we will request that accredited official statistics badging be reinstated by OSR for survey outputs from April 2026 to March 2027 onwards.
Value
These statistics are used in a variety of ways. Some examples of these are:
- providing advice to ministers
- to inform a wide range of policy decisions
The commentary and notes in this release have been developed to try to make the information as accessible as possible to users.
You are welcome to contact us directly with any comments about how we meet these standards. Alternatively, you can contact OSR by emailing regulation@statistics.gov.uk or via the OSR website.
Well-being of Future Generations Act
The Well-being of Future Generations Act 2015 is about improving the social, economic, environmental and cultural wellbeing of Wales. The Act puts in place 7 wellbeing goals for Wales. These are for a more equal, prosperous, resilient, healthier and globally responsible Wales, with cohesive communities and a vibrant culture and thriving Welsh language. Under section (10)(1) of the Act, the Welsh Ministers must (a) publish indicators (“national indicators”) that must be applied for the purpose of measuring progress towards the achievement of the wellbeing goals, and (b) lay a copy of the national indicators before Senedd Cymru. Under section 10(8) of the Well-being of Future Generations Act, where the Welsh Ministers revise the national indicators, they must as soon as reasonably practicable (a) publish the indicators as revised and (b) lay a copy of them before the Senedd. These national indicators were laid before the Senedd in 2021. The indicators laid on 14 December 2021 replace the set laid on 16 March 2016.
Information on the indicators, along with narratives for each of the wellbeing goals and associated technical information is available in the Wellbeing of Wales report.
Further information on the Well-being of Future Generations (Wales) Act 2015.
The statistics included in this release could also provide supporting narrative to the national indicators and be used by public services boards in relation to their local wellbeing assessments and local wellbeing plans.