
Welsh Index of Multiple Deprivation 2025: deprivation relating to children
Analysis of Welsh Index of Multiple Deprivation (WIMD) 2025 indicator data to explore patterns of deprivation amongst children aged 0 to 15.
In this page
Introduction
The Welsh Index of Multiple Deprivation (WIMD) is the official measure of relative deprivation in small areas of Wales. WIMD 2025 combines 54 indicators across 8 domains of deprivation for 1,917 Lower Layer Super Output Areas (LSOAs).
WIMD identifies the most deprived areas but does not measure individual deprivation, as all areas contain a mix of people and circumstances. Many non-deprived people live in highly deprived areas, and many deprived people live in relatively less deprived areas.
This statistical article explores WIMD 2025 indicators relating to children from the income, health, education and access to services domains. These include:
- children aged 0 to 15 living in income deprivation
- low birth weight
- persistent absenteeism in primary and secondary schools
- Key Stage 4 average points score for core subjects
- access to childcare providers, primary and secondary schools
Together these indicators provide insight into different aspects of children’s lives and help identify areas where children may experience multiple forms of disadvantage. Here, we present a selection of the analysis that can provide evidence to inform child-focused policy, helping to understand inequalities in poverty, education, health and wellbeing and supporting action to improve outcomes for children using the WIMD data, but more is possible. Insights from the data may help to inform policies and programmes aimed at giving every child the best possible start in life, improving educational outcomes, and supporting targeted action to reduce disadvantage and promote equality of opportunity.
More information on the index and indicators can be found in the WIMD 2025 guidance and technical report. Data for WIMD has been published on StatsWales, as well as in the WIMD 2025 results report.
Some analysis in this article is presented at MSOA or local authority level to improve reliability where small population sizes can produce more volatile results. Most indicators are based on multi-year averages.
Main points
- Around 212,000 children aged 0 to 15 lived in income deprivation as of end March 2024; this represents around 39% of all children in this age group.
- Areas with high levels of children living in income deprivation were more likely to experience deprivation across other child-related indicators, including low birth weight, school absenteeism and educational attainment.
- 41% of primary pupils and 53% of secondary pupils in the most deprived areas were persistently absent, compared with 13% and 22% respectively in the least deprived areas.
- The likelihood of children living in income deprivation was generally higher in urban areas than rural areas, while poorer access to childcare and schools was generally more common in rural areas.
The highest rates of deprivation for different indicators were spread across different local authorities.
- Blaenau Gwent had the highest levels of child income deprivation, including the highest proportion of small areas in the most deprived 10%.
- Merthyr Tydfil, Blaenau Gwent and Wrexham had the highest proportion of small areas in the most deprived 10% for low birth weight.
- For Key stage 4 (KS4) average point score, Neath Port Talbot and Denbighshire had the highest proportion of small areas in the most deprived 10% and the lowest average KS4 point scores.
- For primary and secondary absenteeism, Neath Port Talbot had the highest proportion of small areas in the most deprived 10%.
- Ceredigion had the highest proportion of LSOAs in the most deprived 10% of areas for access to primary schools (47%) and childcare providers (44%), while Powys had the highest proportion for access to secondary schools (35%).
Children aged 0 to 15 in income deprivation
Children are counted as living in income deprivation if they are the dependent child of an adult who is in receipt of income-related benefits or tax credits or supported asylum seekers. See the WIMD 2025 Technical report for more details.
Across Wales around 212,000 children aged 0 to 15 were living in income deprivation as of end March 2024. This represents 39% of all children in this age group. In comparison, around 25% of the total population were living in income deprivation, meaning that children were more likely than the population as a whole to be living in income deprivation.
As detailed in the technical report, the income deprivation indicator for WIMD 2025 is not directly comparable with WIMD 2019 because of changes to the indicator methodology, benefit system coverage and eligibility criteria. These changes affect the level of the reported rates and mean that precise comparisons of changes over time should be avoided.
However, the data suggest a substantial increase in the proportion of people identified as living in income deprivation since WIMD 2019. Within this broad pattern, the increase is larger for children aged 0 to 15 than for the population overall:
- between WIMD 2019 and WIMD 2025, the proportion of the population living in income deprivation increased by around 9 percentage points, from 16% to 25%
- over the same period, the proportion of children aged 0 to 15 living in income deprivation increased by around 14 percentage points, from 25% to 39%
Figure 1: percentage of people and children aged 0 to 15 living in income deprivation, WIMD 2019 and WIMD 2025
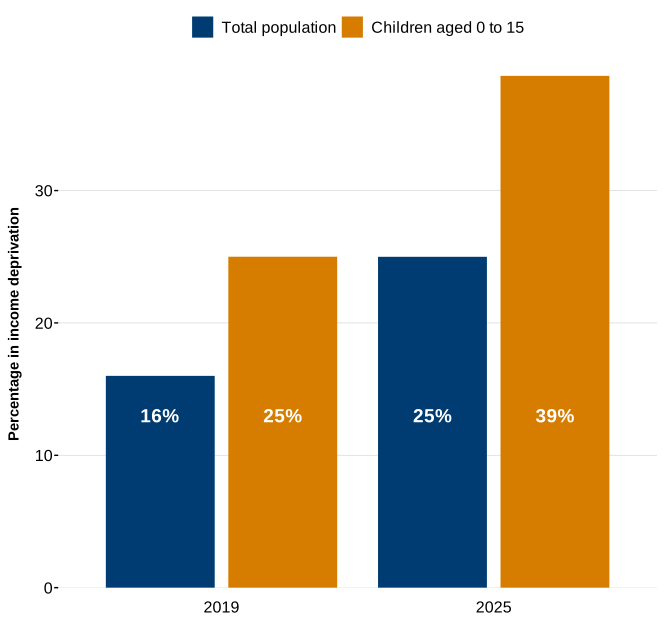
Description of figure 1: a bar chart showing that children aged 0 to 15 had higher rates of income deprivation than the total population in both 2019 and 2025. Income deprivation increased between 2019 and 2025 for both groups, with a larger increase for children.
Income deprivation affecting children was closely related to overall deprivation. Around 74% of children aged 0 to 15 living in the most deprived 10% of areas based on overall WIMD deprivation were living in income deprivation. However, child income deprivation was present across all levels of deprivation. Around 11% of children living in the least deprived 10% of areas were living in income deprivation.
Figure 2: percentage of children aged 0 to 15 living in income deprivation by overall WIMD deprivation decile, WIMD 2025
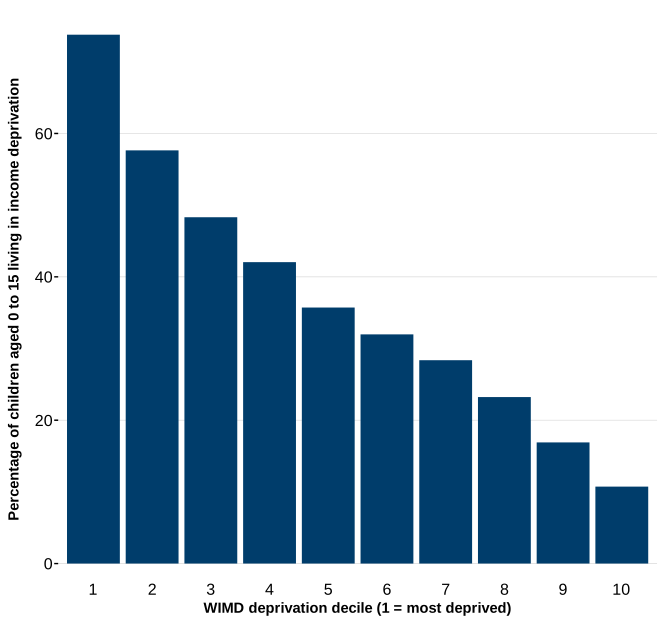
Description of figure 2: a bar chart showing that the proportion of children aged 0 to 15 living in income deprivation decreases steadily across WIMD deprivation deciles, from around three-quarters of children in the most deprived decile to around one-tenth in the least deprived decile.
Child income deprivation was not evenly distributed. Blaenau Gwent was the local authority with the highest concentration of areas experiencing child income deprivation, with the highest proportion of LSOAs in both the most deprived decile (22%) and the highest proportion of children experiencing income deprivation (49%). In contrast, Monmouthshire had no areas in the most deprived decile, with the lowest proportion of children experiencing income deprivation (24%).
Figure 3 shows that there was also substantial variation in child income deprivation within local authorities. Cardiff, Swansea and Newport showed the greatest variation between areas, indicating larger differences in child income deprivation within those local authorities.
Figure 3: distribution of child income deprivation rates across LSOAs by local authority, WIMD 2025
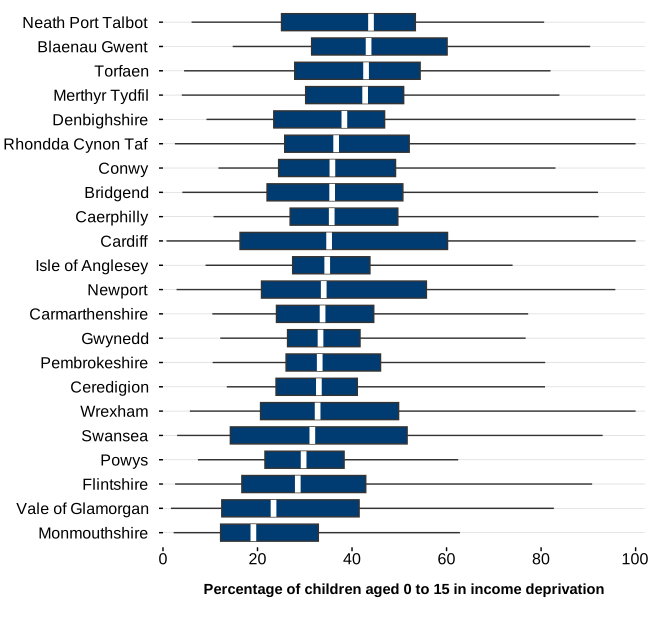
Description of figure 3: the chart compares child income deprivation rates across LSOAs in each local authority. Local authorities are ordered by their typical (median) rate. The white line inside each box shows the median rate. The box contains the middle half of LSOAs, and the whiskers show the lowest and highest rates. The width of the box and the length of the whiskers show how much child income deprivation rates differ between LSOAs within a local authority. Wider boxes and longer whiskers show a bigger gap between the most deprived and least deprived LSOAs. Narrower boxes and shorter whiskers show a smaller gap.
Across Wales, the median child income deprivation rate for an LSOA was around 34%, with the middle half of LSOAs ranging from around 21% to 50%. Neath Port Talbot, Blaenau Gwent, Torfaen and Merthyr Tydfil had the highest median rates of child income deprivation, with more than two in five children income deprived. In contrast, Monmouthshire had the lowest median rate, at less than one in five children.
Patterns of child income deprivation also varied by settlement type. Child income deprivation was generally higher in urban areas than rural areas. Urban areas further from a medium town or city had the highest rate of child income deprivation (44%), while smaller rural areas nearer to a medium town or city had the lowest rate (25%). Overall, the rate was 41% in urban areas, compared with 37% in larger rural areas and 27% in smaller rural areas.
The 10 most deprived LSOAs were located across five local authorities: Cardiff, Rhondda Cynon Taf, Denbighshire, Newport and Wrexham, with Cardiff accounting for 4 of the top 10. There were 4 LSOAs with child income deprivation rates of 100%:
- Mountain Ash West 2, Rhondda Cynon Taf
- Rhyl West 2, Denbighshire
- Grosvenor 2, Wrexham
- Cathays 9, Cardiff (this LSOA has less than 100 children aged 0 to 15)
In contrast, Lisvane and Thornhill 2 in Cardiff had the lowest rate of child income deprivation at 0.7%.
Low birth weight
Low birth weight is classified in WIMD 2025 as a live single birth where the baby weighs less than 2.5kg. Having a low birth weight can cause health problems for children later in life. This data is in line with the low birth weight National Indicator which helps to measure progress against important well-being goals under the Wellbeing of Future Generations Act 2015. The figures included in WIMD 2025 are the 10 year average from 2015 to 2024.
The risk of low birth weight is associated with a range of maternal, pregnancy-related, demographic and socioeconomic factors.
Overall, 5.3% of babies were born with a low birth weight, amounting to a yearly average of around 1,500 babies.
At local authority level, the Vale of Glamorgan had the lowest proportion of babies born with a low birth weight, at 3.8%. Merthyr Tydfil had the highest proportion of babies born with a low birth weight, at 6.7%.
Rates of low birth weight varied considerably across Wales. The following analysis explores how low birth weight differed according to deprivation and geography.
Low birth weight was closely associated with overall deprivation. The mean low birth weight rate was 7.4% in the most deprived 10% of areas, compared with 3.4% in the least deprived 10% of areas, a difference of 4 percentage points. The rate generally decreased as overall deprivation decreased, indicating that babies living in more deprived communities were more likely to have a low birth weight. However, rates of low birth weight remained above 4% across most deprivation deciles, showing that low birth weight was not limited to the most deprived communities. This suggests that low birth weight is associated with area deprivation but is also likely to be influenced by other factors.
Figure 4: proportion of babies born with a low birth weight between 2015 and 2024, by WIMD 2025 deprivation decile
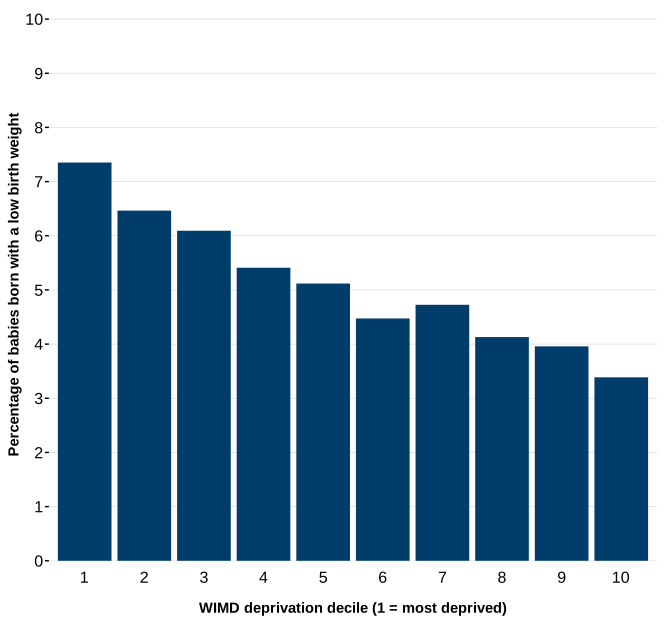
Description of figure 4: a bar chart showing that low birth weight rates are generally higher in more deprived areas and lower in less deprived areas. Average rates are above the Wales average in the most deprived deciles and below the Wales average in the least deprived deciles.
Low birth weight rates varied considerably across Wales. The 10 MSOAs with the highest levels had low birth weight rates of at least 8%, substantially above the Wales average of 5.3%. They were spread across 6 local authorities. Four were located in Rhondda Cynon Taf, 2 in Denbighshire. Blaenau Gwent, Conwy, Merthyr Tydfil and Wrexham each had one MSOA in the top 10.
The highest-ranked area, Caia Park, Wrexham had a rate around 8 times that of some of the least deprived areas. The MSOAs with the highest rates of low birth weight were:
- Caia Park, Wrexham (12.0%)
- Rhyl North, Denbighshire (9.2%)
- Tylorstown, Rhondda Cynon Taf (9.1%)
- Colwyn Bay North, Conwy (8.9%)
- Mountain Ash, Rhondda Cynon Taf (8.8%)
While this section highlights the areas with the highest rates, low birth weight rates for all MSOAs in Wales can be explored in the Welsh Index of Multiple Deprivation (WIMD) 2025 indicator data on StatsWales.
Primary and secondary school absenteeism
Persistent absenteeism was strongly associated with area deprivation. The indicators measure the percentage of primary and secondary school pupils who missed 10% or more of school sessions, based on a 2-year average of academic years (September to August) 2022 to 2023 and 2023 to 2024.
Across Wales, the persistent absenteeism rate was 27% for primary pupils and 39% for secondary pupils. Persistent absenteeism amongst secondary pupils was therefore substantially higher than amongst primary pupils.
Persistent absenteeism increased steadily as deprivation increased. Primary persistent absenteeism ranged from 41% in the most deprived 10% of areas to 13% in the least deprived 10% of areas.
Secondary persistent absenteeism ranged from 53% to 22%. Secondary persistent absenteeism was higher than primary persistent absenteeism in every deprivation decile.
The gap between the most and least deprived areas was 28 percentage points for primary pupils and 31 percentage points for secondary pupils, indicating particularly large inequalities in attendance amongst secondary-aged children. Children living in the most deprived areas were more than twice as likely to be persistently absent as those living in the least deprived areas.
Figure 5: percentage of pupils missing 10% or more of school sessions by overall WIMD deprivation decile, primary and secondary schools, 2022/23 and 2023/24
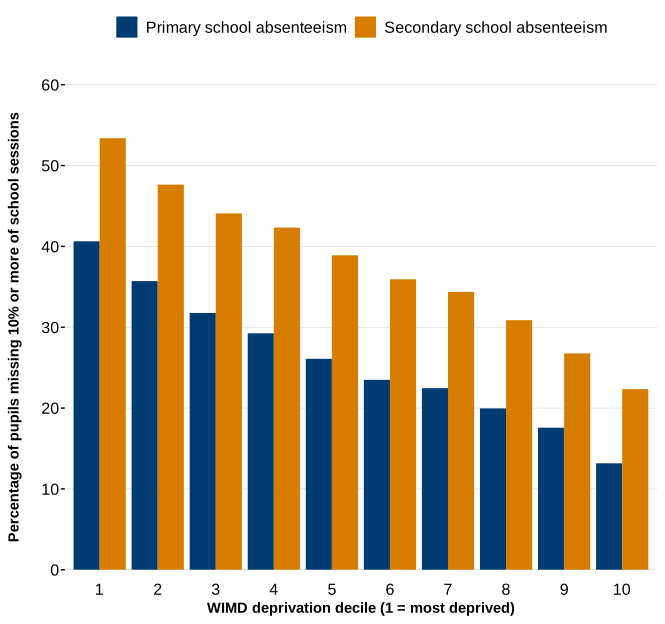
Description of figure 5: a grouped bar chart showing that both primary and secondary school absenteeism rates are higher in more deprived areas and lower in less deprived areas. Absenteeism decreases steadily across WIMD deciles, with the highest rates in the most deprived decile and the lowest rates in the least deprived decile. Secondary school absenteeism is higher than primary school absenteeism in every deprivation decile.
There was substantial variation in persistent absenteeism between areas. For primary pupils, rates ranged from 4% in Whitchurch and Tongwynlais 6, Cardiff to 59% in Cathays 12, also in Cardiff.
For secondary pupils, rates ranged from 7% in Radyr 2, Cardiff to 74% in Cwm Clydach 1, Rhondda Cynon Taf. Across both phases, attendance patterns varied considerably between areas, including within the same local authority.
Key Stage 4 average points score for core subjects
The Key Stage 4 (KS4) indicator measures the average points score of Year 11 pupils based on the grades achieved in GCSE English or Welsh first language, mathematics and science, or equivalent qualifications. A 2-year average based on academic years 2022 to 2023 and 2023 to 2024 is used to reduce the impact of small numbers of pupils in individual areas.
KS4 outcomes were strongly associated with deprivation. Across Wales, the weighted average KS4 score was 115 points. Areas with lower KS4 scores were more likely to experience higher levels of deprivation.
Figure 6: average Key Stage 4 points score for core subjects by overall WIMD deprivation decile, 2022/23 and 2023/24
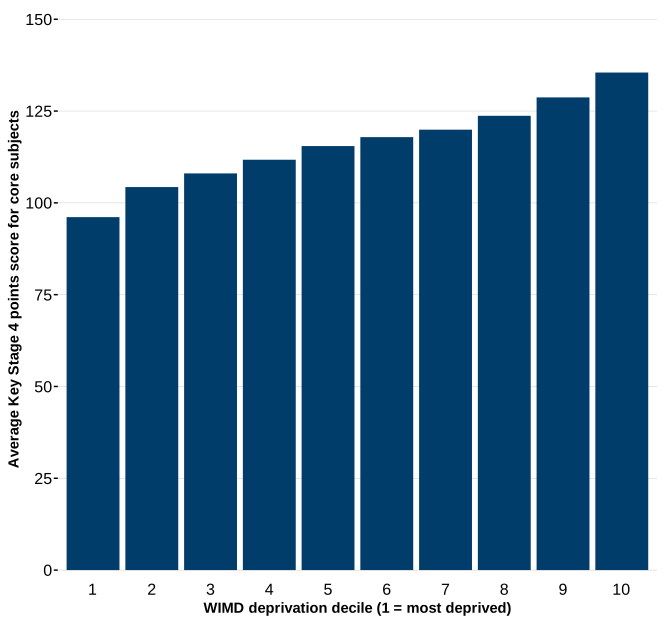
Description of figure 6: a bar chart showing that average Key Stage 4 point scores increase as deprivation decreases. The average score rises from around 96 points in the most deprived 10% of areas to around 135 points in the least deprived 10% of areas, a difference of almost 40 points.
There were also marked differences between local authorities. Monmouthshire had the highest weighted average KS4 score, at 125 points, while Denbighshire (107 points), Neath Port Talbot (108 points) and Blaenau Gwent (108 points) were the lowest.
KS4 scores varied considerably between small areas. The highest average score was in Plymouth (The Vale of Glamorgan) 3, at 159 points, while the lowest was in Caerau (Bridgend) 2, at 63 points. This represents a gap of 96 points between the highest and lowest scoring areas.
For average KS4 points score, Denbighshire and Neath Port Talbot had the highest proportion of LSOAs within the 10% most deprived areas, at 24% of LSOAs. In contrast, Monmouthshire and Ceredigion had no LSOAs within the 10% most deprived areas. Lower KS4 outcomes were most widespread in Merthyr Tydfil, where around 72% of LSOAs were in the most deprived half of Wales for average KS4 points score, compared with around 22% in Monmouthshire. This highlights substantial variation between local authorities in both the concentration and distribution of lower KS4 attainment.
Access to primary and secondary schools and childcare providers
Access to schools and childcare providers is part of the WIMD 2025 access to services domain. The physical access sub-domain includes indicators measuring average travel times to the nearest primary school, secondary school and registered childcare provider.
For WIMD 2025, travel times are based on combined measures, calculated as a weighted average of public and private transport travel times, using data from the 2021 Census on car ownership and the number of adults aged 17 and over. This provides a single measure of overall accessibility while reflecting access by different modes of transport. See the WIMD technical report for more details.
Childcare providers were added for WIMD 2025 and include services registered with Care Inspectorate Wales, such as day and sessional care, crèches, out of school care and childminders.
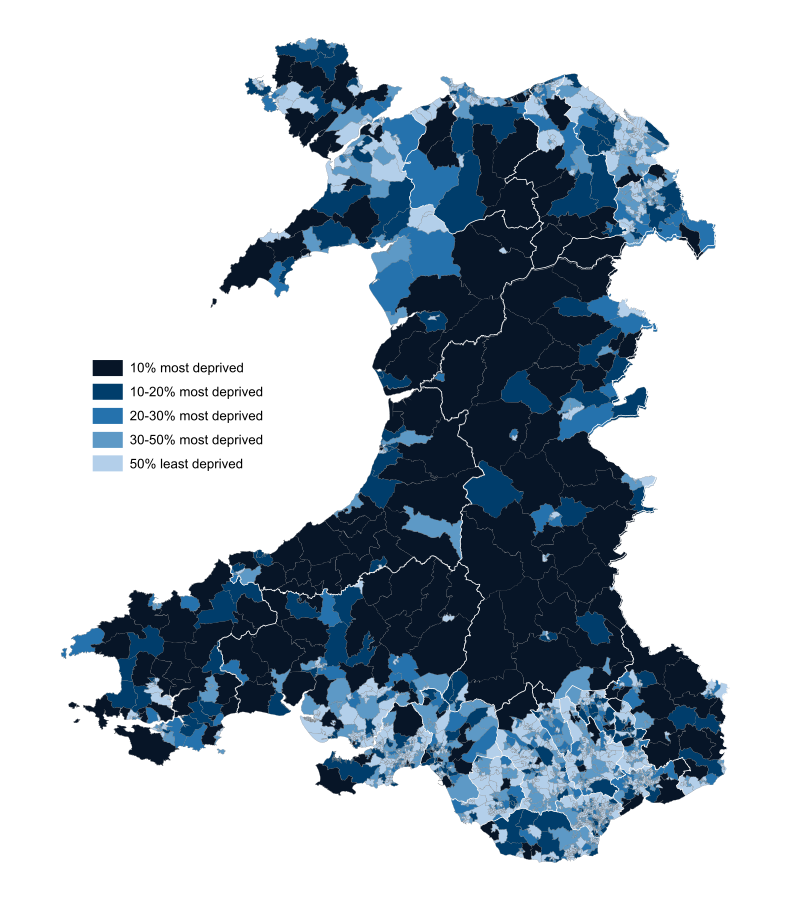
Figure 7: map of LSOAs shaded by primary school access group, WIMD 2025
© Crown copyright 2026. Cartographics. Welsh Government.
Description of figure 7: the map shows that poorer access to primary schools is concentrated in rural parts of mid, west and north west Wales. Better access is more common in urban and more densely populated areas, particularly in south Wales and north east Wales.
Access to primary schools showed substantial differences between local authorities. Ceredigion had the highest proportion of LSOAs in the most deprived 10% of areas (47%). In contrast, Cardiff had the lowest proportion of LSOAs in the most deprived 10% of areas (0.5%). The Vale of Glamorgan had the highest proportion of LSOAs in the least deprived decile (18%).
A similar pattern was seen for secondary schools. Powys had the highest proportion of LSOAs in the most deprived 10% of areas (35%). In contrast, Torfaen, Vale of Glamorgan and Blaenau Gwent had no LSOAs in the most deprived 10% of areas. Denbighshire had the highest proportion of LSOAs in the least deprived decile (19%).
Access to childcare providers also showed marked differences between local authorities. Ceredigion had the highest proportion of LSOAs in the most deprived 10% of areas (44%). In contrast, Cardiff and Torfaen had no LSOAs in the most deprived 10% of areas. Vale of Glamorgan had the highest proportion of LSOAs in the least deprived decile (32%).
At the LSOA level, private transport travel times vary considerably across Wales, reflecting local differences in access to services. Similar patterns are seen for public transport travel times, with the longest journey times typically found in rural areas and the shortest in urban areas.
The LSOAs with the longest private transport travel times were:
- Arthog, Llangelynnin a Llanegryn (Gwynedd) for primary schools (26.1 minutes)
- Knighton 2 (Powys) for secondary schools (88.3 minutes)
- Old Radnor (Powys) for childcare providers (30.7 minutes)
In contrast, the LSOAs with the shortest private transport travel times were:
- Uplands 9 (Swansea) for primary schools (1.3 minutes)
- Argoed (Flintshire) 1 for secondary schools (1.9 minutes)
- Allt-yr-yn 6 (Newport) for childcare providers (0.6 minutes)
These differences illustrate the substantial geographical variation in access to services across Wales.
Overall, the results show a consistent pattern of poorer access to schools and childcare providers in many rural areas of Wales, particularly in Ceredigion and Powys. This is consistent with the broader relationship between accessibility and rurality highlighted in the publication Welsh Index of Multiple Deprivation 2025: deprivation in rural and urban areas. Areas that are further from medium towns and cities tend to have longer travel times because services are more dispersed. Access to schools and childcare services is important for children's education and development and can influence parents' ability to work, study or undertake training.
Quality and methodology information
Further information on WIMD 2025 quality is provided in the background information section of the WIMD 2025 results report, and the methodology is described in detail in the technical report.
Notes on the use of statistical articles
Statistical articles generally relate to one-off analyses for which there are no updates planned, at least in the short-term, and serve to make such analyses available to a wider audience than might otherwise be the case. They are mainly used to publish analyses that are exploratory in some way, for example:
- introducing a new experimental series of data
- a partial analysis of an issue which provides a useful starting point for further research but that nevertheless is a useful analysis in its own right
- drawing attention to research undertaken by other organisations, either commissioned by the Welsh Government or otherwise, where it is useful to highlight the conclusions, or to build further upon the research
- an analysis where the results may not be of as high quality as those in our routine statistical releases and bulletins, but where meaningful conclusions can still be drawn from the results
Where quality is an issue, this may arise in one or more of the following ways:
- being unable to accurately specify the timeframe used (as can be the case when using an administrative source)
- the quality of the data source or data used
- other specified reasons
However, the level of quality will be such that it does not significantly impact upon the conclusions. For example, the exact timeframe may not be central to the conclusions that can be drawn, or it is the order of magnitude of the results, rather than the exact results, that are of interest to the audience.
The analysis presented does not constitute an official statistic, but may be based on official statistics outputs, and we have applied the principles of the Code of Practice for Statistics as far as possible during development. An assessment of the strengths and weaknesses in the analysis will be included in the article, for example comparisons with other sources, along with guidance on how the analysis might be used, and a description of the methodology applied.
Articles are subject to the release practices as defined by the release practices protocol, and so, for example, are published on a pre announced date in the same way as other statistical outputs.
Contact details
Social Justice Statistics
Email: stats.inclusion@gov.wales
Media: 0300 025 8099