
Reporting Welsh language ability: comparison between census and national survey results 2020 to 2022
An analysis of linked Census 2021 and National Survey for Wales data exploring how people report their Welsh language ability.
In this page
Introduction
There have always been differences between estimates of Welsh language ability from Census 2021 and household surveys. They have important implications for understanding trends in Welsh language ability. While the National Survey for Wales generally reports higher levels of Welsh language ability than Census 2021, less is known about how consistently individuals report their Welsh language skills across the 2 sources.
Using linked Census 2021 and National Survey for Wales data between survey years 2020 to 2021 and 2021 to 2022, this article examines:
- agreement in reported Welsh language ability
- the demographic, geographic and Welsh language characteristics associated with higher and lower levels of agreement
Main points
- Most people gave consistent answers about their Welsh language ability in Census 2021 and the National Survey for Wales.
- Answers were less consistent among people who said that they could speak Welsh in at least one source than for those who didn’t say that they could speak Welsh in either source.
- Fluent Welsh speakers and people who spoke Welsh daily were much more likely to give the same response in both sources.
- People living in south east Wales were much less likely to give the same response than people living in north west Wales.
- Where people lived, how often they spoke Welsh, and how well they could speak Welsh were the main factors linked to agreement between the 2 sources.
- People in south east Wales who spoke Welsh less often than weekly and were less confident in their Welsh skills were most likely to give different answers.
Background
Household surveys typically provide us with higher estimates of Welsh-speaking ability than the census. However, in 2021, the census showed a decline in the number of Welsh speakers while the National Survey for Wales showed a small increase.
According to Census 2021, an estimated 15.3% of usual residents aged 16 or older in Wales were able to speak Welsh. By comparison, at the time of Census 2021, the National Survey for Wales estimated that 18.2% of people aged 16 or older living in Wales could speak Welsh. As the National Survey estimate is based on a sample of the population, it is subject to sampling uncertainty. The 95% confidence interval around this estimate is 16.5% to 19.9%. This gives a range of values that is likely to contain the true population value. A further 15.4% of respondents to the National Survey reported that they could not speak Welsh but had some Welsh-speaking ability. The 95% confidence interval around this National Survey estimate is 13.7% to 17.1%.
This article focuses on the extent to which the same individual's responses differ between both sources. By linking data from Census 2021 and National Survey for Wales we were able to analyse the characteristics of those people who gave different responses.
We have already carried out similar analysis to study agreement in reported Welsh language skills using linked Census 2021 and Labour Force Survey data. This article extends that work by comparing responses from Census 2021 with those from the National Survey for Wales 2020 to 2021 and 2021 to 2022
This work was carried out by the Data Acquisition and Linking for Research team (DALfR), the Welsh Government component of the Administrative Data Research (ADR) Wales partnership. This publication is a product of a joint workplan between the Welsh Government and Office for National Statistics to improve our understanding of Welsh language statistics.
Reported Welsh language skills
The linked dataset used in this analysis contains 10,445 individual records which span 2 years of data from the National Survey for Wales. This does not represent the full survey dataset, as some records could not be linked. The analysis only includes respondents aged 16 years or older as this is the age of respondents in the National Survey for Wales. Further information can be found in the Quality and methodology section.
| Language skill | Census 2021 | National Survey for Wales | Difference (percentage points) |
|---|---|---|---|
| Can speak Welsh | 16.8% | 20.2% | 3.4 |
| Can understand Welsh | 19.0% | 22.9% | 3.9 |
| Can read Welsh | 16.9% | 19.3% | 2.4 |
| Can write Welsh | 14.6% | 17.9% | 3.3 |
Source: linked Census 2021 and National Survey for Wales data, Welsh Government
The National Survey for Wales estimated higher levels of Welsh language skills than Census 2021 for the ability to speak, understand, read and write Welsh.
Understanding Welsh was the most reported skill in both sources (19.0% in Census 2021 and 22.9% in the National Survey for Wales). Writing Welsh was the least reported skill (14.6% in Census 2021 and 17.9% in the National Survey for Wales).
Agreement rates by Welsh language skill
In this article, "headline agreement rates" refer to the proportion of individuals in the linked dataset who recorded the same response to a given question across both sources.
| Language skill | Headline agreement rate |
|---|---|
| Can speak Welsh | 94.7% |
| Can understand Welsh | 91.8% |
| Can read Welsh | 93.7% |
| Can write Welsh | 94.6% |
Source: linked Census 2021 and National Survey for Wales data, Welsh Government
When asked about their ability to speak Welsh, 94.7% of linked respondents gave a consistent answer in the National Survey for Wales and Census 2021. This means that around 1 in 20 people in the linked dataset gave different answers about their ability to speak Welsh in the 2 sources. When we look at other Welsh language skills, over 90% gave consistent answers for their ability to understand, read and write Welsh. The high level of agreement is largely because more than three-quarters of respondents said they could not speak, understand, read or write Welsh in both sources.
| Response | Can speak Welsh | Can understand Welsh | Can read Welsh | Can write Welsh |
|---|---|---|---|---|
| Yes in both | 15.9% | 16.9% | 15.0% | 13.5% |
| No in both | 78.9% | 74.9% | 78.8% | 81.0% |
| Yes in Census 2021, no in National Survey for Wales | 0.9% | 2.1% | 1.9% | 1.1% |
| No in Census 2021, yes in National Survey for Wales | 4.4% | 6.0% | 4.3% | 4.3% |
Source: linked Census 2021 and National Survey for Wales data, Welsh Government
More people reported that they were able to speak Welsh in the National Survey for Wales and unable to do so in Census 2021 than the other way around. This result is expected given that the National Survey for Wales provides higher estimates of Welsh-speaking ability than Census 2021.
| Language skill | Conditional agreement rate |
|---|---|
| Can speak Welsh | 75.2% |
| Can understand Welsh | 79.0% |
| Can read Welsh | 78.2% |
| Can write Welsh | 76.6% |
Source: linked Census 2021 and National Survey for Wales data, Welsh Government
In this article, the "conditional agreement rate" refers to the agreement rate when the individuals who record being unable to speak Welsh on both sources are excluded. Among people who recorded an ability to speak Welsh on at least one source, the conditional agreement rate for ability to speak Welsh is 75.2%. That means around 1 in 4 people who recorded being able to speak Welsh in the National Survey for Wales or Census 2021 recorded that they were unable to do so on the other source.
When we look at other Welsh language skills:
- 79.0% gave a consistent answer for their ability to understand Welsh
- 78.2% for their ability to read Welsh
- 76.6% for their ability to write in Welsh
Equivalent analysis using linked Census 2021 and Labour Force Survey data found that:
- 60.1% gave a consistent answer for their ability to speak Welsh
- 59.7% for their ability to understand Welsh
- 59.1% for their ability to read Welsh
- 59.8% for their ability to write in Welsh
These figures are provided for context only, as the Census and Labour Force Survey and the Census and National Survey analyses are based on different groups of individuals. Differences may be explained by the difference in age range between the National Survey for Wales and the Labour Force Survey, however this has not been explored in this analysis.
Agreement rates by population characteristics
We used responses provided to other questions in Census 2021 to measure the agreement rates for Welsh language skills by a range of demographic and household characteristics. As increasing the number of Welsh speakers is a main aim of the previous Welsh Government’s Welsh language strategy, Cymraeg 2050: A million Welsh speakers, the analysis in this section focuses on how respondents record their Welsh speaking ability.
Agreement rates by age group
Most respondents in each age group agree about their Welsh speaking ability in both sources. The proportion who disagrees only varies a little by age.
Figure 1: Welsh speaking conditional agreement rate by age group, 2020-21 to 2021-22
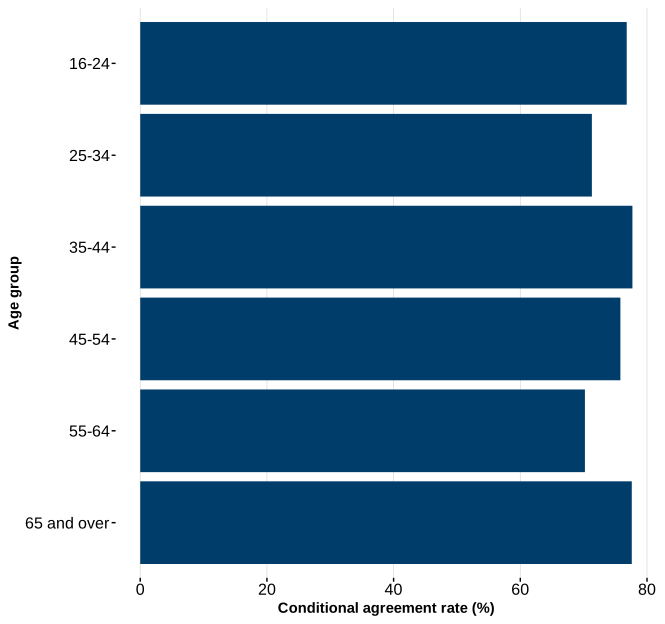
Description of figure 1: a bar chart showing that there is little variation in conditional agreement rate between age groups
Source: linked Census 2021 and National Survey for Wales data, Welsh Government
Among people who reported that they could speak Welsh in at least one source, the highest levels of agreement between the National Survey for Wales and Census 2021 were of those:
- aged 35 to 44 years (77.7% agreed in both sources)
- aged 65 years or older (77.6% agreed in both sources)
The lowest levels of agreement between the National Survey for Wales and Census 2021 were of those:
- aged 55 to 64 years (70.2% agreed in both sources)
Differences in conditional agreement rates between age groups were smaller in this analysis than in the earlier Census 2021 and Labour Force Survey analysis. In the earlier analysis, people aged 65 and over had higher agreement rates than all other age groups.
Agreement rates by sex
The conditional agreement rates for men and women are broadly similar.
Among people who reported that they can speak Welsh in at least one source:
- 75.3% of women agree in both sources
- 75.0% of men agree in both sources
Differences in conditional agreement rates between males and females were similar to those seen in the previous Census 2021 and Labour Force Survey analysis.
Agreement rates by region
There are substantial differences in the conditional agreement rates by region. The five regions of Wales used in this analysis are consistent with those used in the National Survey for Wales's analyses of the Welsh language.
Figure 2: Welsh speaking conditional agreement rate by region, 2020-21 to 2021-22
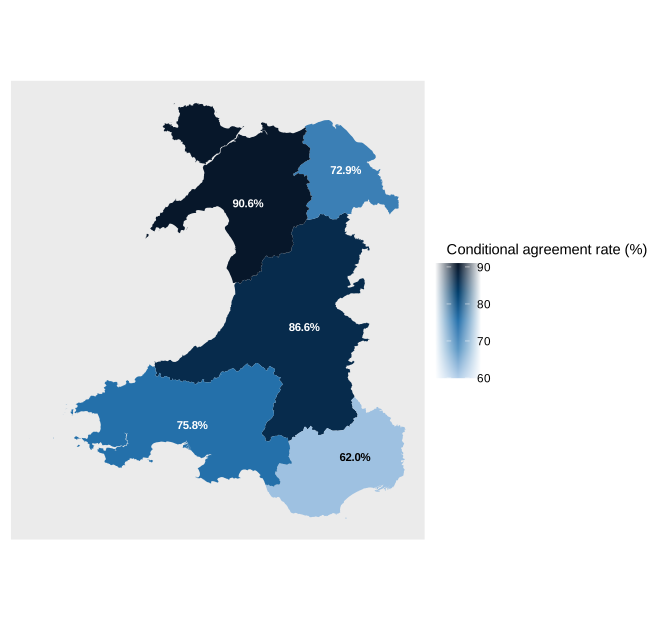
Description of figure 2: a map showing that conditional agreement rate is highest in north west Wales and lowest in south east Wales.
Source: linked Census 2021 and National Survey for Wales data, Welsh Government
In south east Wales, the conditional agreement rate is 62.0%. That is, around 4 in 10 of the people who said that they could speak Welsh in the National Survey for Wales or Census 2021 recorded that they were unable to speak Welsh on the other source.
In north west Wales, the conditional agreement rate is 90.6%. This means that of the people who said that they could speak Welsh in the National Survey for Wales or Census 2021, around 1 in 10 recorded that they were unable to speak Welsh on the other source.
Differences in conditional agreement rates between regions were similar to those seen in the previous Census 2021 and Labour Force Survey analysis.
Agreement rates by national identity
Census 2021 asked respondents about their national identity. Respondents could select one or several identities. The largest groups were Welsh, British, and Welsh and British. All other combinations have been grouped as Other.
There are substantial differences in the conditional agreement rates by national identity. Conditional agreement is highest in people who selected Welsh as their national identity.
Figure 3: Welsh speaking conditional agreement rate by national identity, 2020-21 to 2021-22
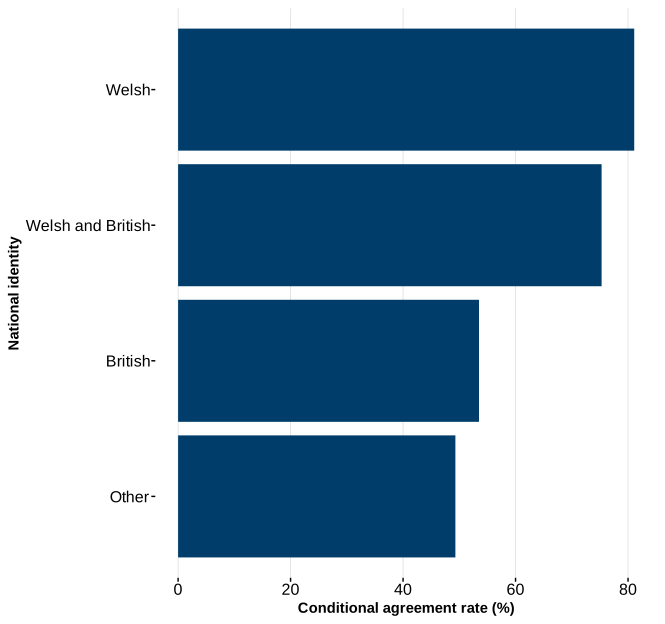
Description of figure 3: a bar chart showing that people who said their national identity was Welsh or Welsh and British had the highest conditional agreement rates.
Source: linked Census 2021 and National Survey for Wales data, Welsh Government
Among people who reported that they could speak Welsh in at least one source, the levels of agreement between the National Survey for Wales and Census 2021 were:
- 81.1% for those who only selected Welsh as their national identity
- 75.3% for those who selected Welsh and British as their national identity
- 53.5% for those who only selected British as their national identity
The descriptive differences in conditional agreement rates between national identity groups were similar to the descriptive patterns seen in the previous Census 2021 and Labour Force Survey analysis.
Agreement rates by Welsh speaking frequency
The National Survey for Wales asked respondents how frequently they spoke Welsh. Due to survey question routing, this question was only asked to people who said that they spoke Welsh in the National Survey for Wales. This means that responses to this question were not captured for people who said that they spoke Welsh in Census 2021 but not in National Survey for Wales. Further information can be found in the Quality and methodology section.
There are substantial differences in the conditional agreement rates by Welsh speaking frequency. Conditional agreement rate increases with the frequency of speaking Welsh.
Figure 4: Welsh speaking conditional agreement rate by frequency of speaking Welsh, 2020-21 to 2021-22
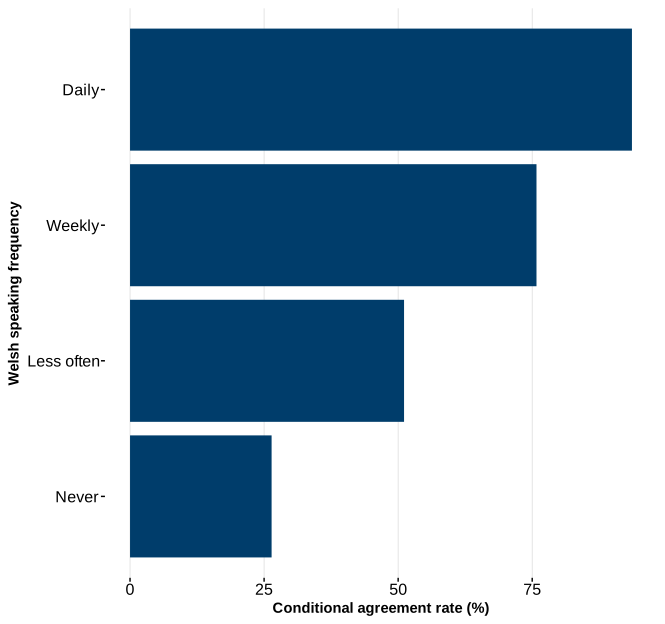
Description of figure 4: a bar chart showing that conditional agreement rate increases with frequency of speaking Welsh
Source: linked Census 2021 and National Survey for Wales data, Welsh Government
Among people who say that they can speak Welsh on the National Survey for Wales:
- 93.6% of people who say they speak Welsh daily also say they can speak Welsh on Census 2021
- 26.4% of people who say they never speak Welsh say that they can speak Welsh on Census 2021
Equivalent analysis using linked Census 2021 and Labour Force Survey data found conditional agreement rates of:
- 83.0% for those who say they speak Welsh daily
- 16.7% for those who say they never speak Welsh
Agreement rates by fluency of spoken Welsh
The National Survey for Wales asked respondents how fluently they spoke Welsh. Due to survey question routing, this question was only asked to people who said that they spoke Welsh in the National Survey for Wales. This means that responses to this question were not captured for people who said that they spoke Welsh in Census 2021 but not in National Survey for Wales. Further information can be found in the Quality and methodology section.
Figure 5: Welsh speaking conditional agreement rate by fluency in spoken Welsh, 2020-21 to 2021-22
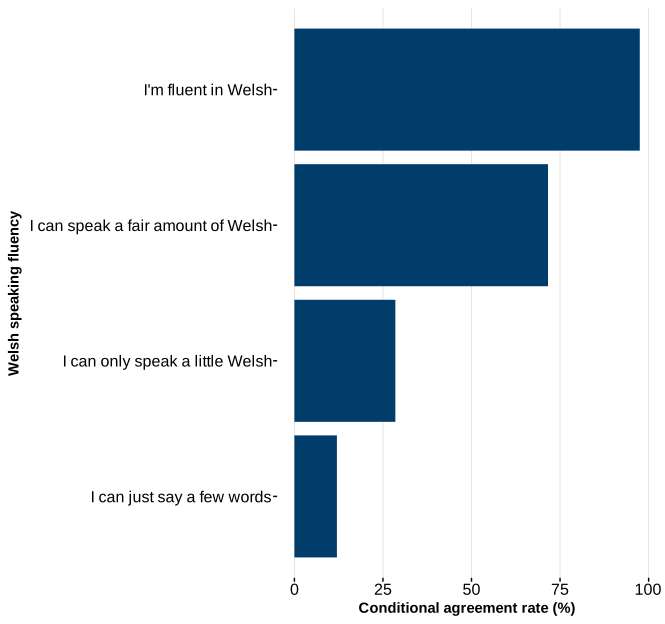
Description of figure 5: a bar chart showing that conditional agreement rate increases with fluency in spoken Welsh
Source: linked Census 2021 and National Survey for Wales data, Welsh Government
There are substantial differences in the conditional agreement rates by Welsh speaking fluency. Conditional agreement rate increases with the level of fluency.
Among people who say that they can speak Welsh on the National Survey for Wales:
- 97.5% of people who say they speak Welsh fluently also say they can speak Welsh on Census 2021
- 12.0% of people who say they can only speak a few words of Welsh also say they can speak Welsh on Census 2021
Agreement rates by household composition
The conditional agreement rates for people with dependent children and people without dependent children are broadly similar.
Among people who say they can speak Welsh in at least one source:
- 75.9% of people with dependent children agree that they can speak Welsh on both the National Survey for Wales and Census 2021
- 74.9% of people without dependent children agree that they can speak Welsh on both the National Survey for Wales and Census 2021
Differences in conditional agreement rates between households with and without dependent children were smaller in this analysis than in the previous Census 2021 and Labour Force Survey analysis. In the previous analysis, 61.1% of households with children agree on their Welsh-speaking ability in the LFS and Census 2021 compared with 83.8% of households without children.
Regression analysis
We used logistic regression to examine predictors of Welsh speaking agreement. We ran an adjusted model that assessed the associations between conditional agreement and each variable in turn, while controlling for the other variables. The variables included in the model were:
- sex
- age group
- national identity
- region
- whether they had dependent children
- Welsh speaking frequency
- Welsh speaking fluency
Odds ratios (ORs) were calculated for each category relative to a designated reference group. An OR greater than one indicates that the outcome is more likely for that category compared with the reference group, while an OR less than one indicates that the outcome is less likely.
Odds ratios are reported alongside confidence intervals (CI) to show the level of uncertainty around the estimated association due to sampling variability. The odds ratio gives a single point estimate. The confidence interval indicates the range of values within which the true population effect is likely to lie and helps assess both the precision and statistical significance of the estimate.
Unless noted otherwise, odds ratios presented are statistically significant to at least the 5% level. This indicates the associations are unlikely to be due to chance. More information on logistic regression and odds ratios can be found in the Quality and methodology section.
The strongest predictors in this model were:
- region
- Welsh speaking fluency
- frequency of speaking Welsh
Age group, sex, whether they had dependent children and national identity did not show clear statistically significant associations once the other variables were controlled for.
Region
The first predictor in the model was region. We calculated odds ratios to compare the likelihood of agreement between both data sources. We used respondents who live in north west Wales as the reference group.
Figure 6: likelihood of conditional agreement by region, 2020-21 to 2021-22
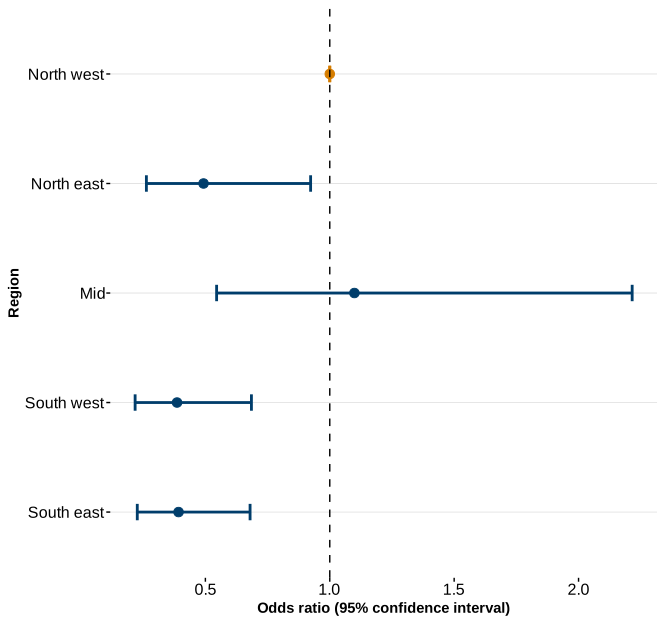
Description of figure 6: a plot showing that the odds ratios for conditional agreement are lowest for north east, south west and south east Wales when compared with north west Wales
Source: linked Census 2021 and National Survey for Wales data, Welsh Government
Compared with people living in north west Wales, people living in:
- south west Wales were 61% less likely to report the same Welsh language ability in both sources (OR = 0.39, 95% CI: 0.22, 0.69)
- south east Wales were 61% less likely to report the same Welsh language ability in both sources (OR = 0.39, 95% CI: 0.23, 0.68)
- north east Wales were 51% less likely to report the same Welsh language ability in both sources (OR = 0.49, 95% CI: 0.26, 0.92)
There was no statistically significant difference in the likelihood of reporting the same Welsh language ability in both sources among people living in mid Wales.
Welsh speaking frequency
The second predictor in the model was frequency of speaking Welsh. We calculated odds ratios to compare the likelihood of agreement between both data sources. We used respondents who speak Welsh daily as the reference group.
Figure 7: likelihood of conditional agreement by frequency of speaking Welsh, 2020-21 to 2021-22
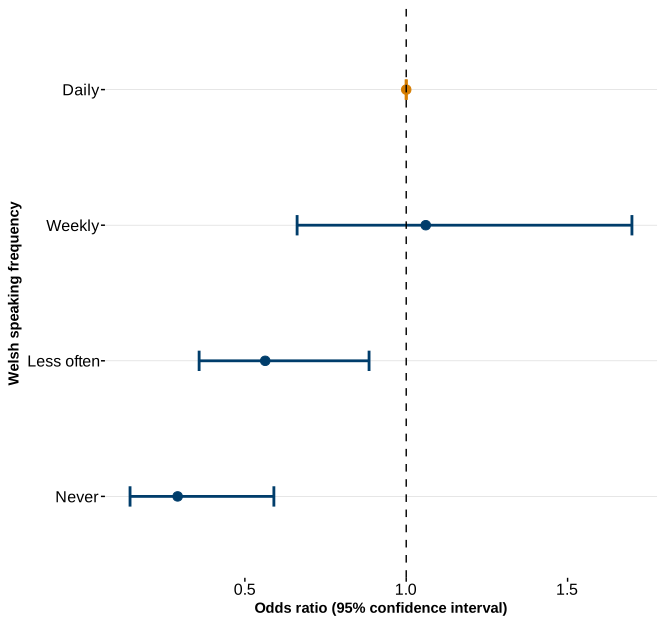
Description of figure 7: a chart showing that the odds ratios for conditional agreement increase with frequency of speaking Welsh
Source: linked Census 2021 and National Survey for Wales data, Welsh Government
Compared with people who say that they speak Welsh daily, people who say that they:
- speak Welsh less often than weekly were 44% less likely to report the same Welsh language ability in both sources (OR = 0.56, 95% CI: 0.36, 0.88)
- never speak Welsh were 71% less likely to report the same Welsh language ability in both sources (OR = 0.29, 95% CI: 0.14, 0.59)
There was no statistically significant difference for people who say that they speak Welsh weekly.
Welsh speaking fluency
The third predictor in the model was Welsh speaking fluency. We calculated odds ratios to compare the likelihood of agreement between both data sources. We used respondents who say they speak fluently in Welsh as the reference group.
Figure 8: likelihood of conditional agreement by Welsh speaking fluency, 2020-21 to 2021-22
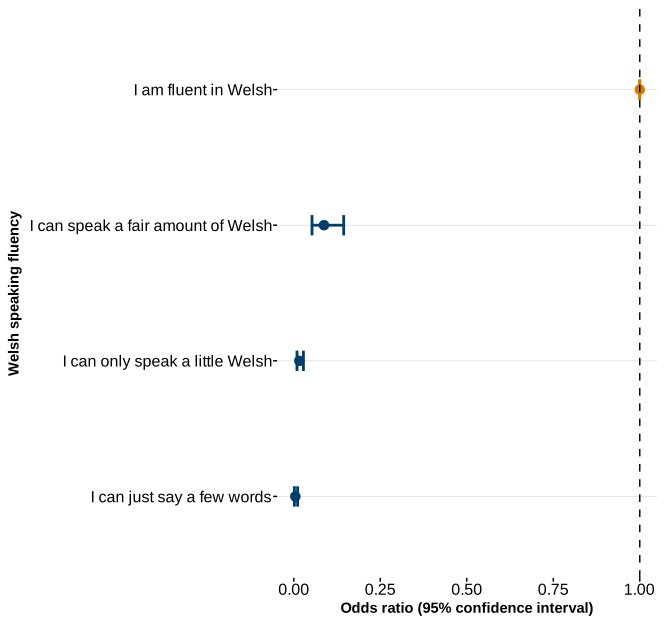
Description of figure 8: a chart showing that the odds ratios for conditional agreement increase with fluency in spoken Welsh
Source: linked Census 2021 and National Survey for Wales data, Welsh Government
Compared with people who say that they are fluent in Welsh, people who say that they can:
- speak a fair amount of Welsh were 91% less likely to report the same Welsh language ability in both sources (OR = 0.09, 95% CI: 0.05, 0.14)
- speak only a little Welsh were 98% less likely to report the same Welsh language ability in both sources (OR = 0.02, 95% CI: 0.01, 0.03)
- say just a few words in Welsh were 99.5% less likely to report the same Welsh language ability in both sources (OR < 0.01, 95% CI: <0.01, 0.01)
Cluster analysis
We used hierarchical clustering to identify groups of respondents with similar patterns of characteristics and Welsh language responses. The analysis grouped together individuals who are more alike and separates those who are less alike. This creates clusters of respondents with similar profiles.
The clusters were formed using information on Welsh language responses and selected demographic characteristics. Individuals within the same cluster are more similar to each other than to individuals in other clusters. The analysis does not identify factors associated with an outcome but instead helps describe common patterns within the data.
The quality of the clustering solution was assessed using a silhouette score. This measures how similar individuals are to others in their own cluster compared with those in different clusters. Higher values indicate clearer separation between clusters, suggesting that the identified groups are meaningful and distinct.
Hierarchical clustering is an exploratory technique and the clusters should be interpreted as descriptive groups within the data rather than definitive or fixed population categories. More information on hierarchical clustering can be found in the Quality and methodology section.
| Welsh speaking frequency | Welsh speaking fluency | National identity | Region | Number of people |
|---|---|---|---|---|
| Weekly | I can speak a fair amount of Welsh | Welsh | South east, South west | 200 |
| Daily | I'm fluent in Welsh | British | North west | 205 |
| Less often | I'm fluent in Welsh | Welsh | South east | 135 |
| Weekly | I'm fluent in Welsh | Welsh | South east | 130 |
| Daily | I'm fluent in Welsh | Welsh | North east | 180 |
| Daily | I'm fluent in Welsh | Welsh | South west | 195 |
| Daily | I'm fluent in Welsh | Welsh | North west | 350 |
| Daily | I'm fluent in Welsh | Welsh | Mid | 135 |
| Daily | I'm fluent in Welsh | Welsh | South east | 110 |
Source: linked Census 2021 and National Survey for Wales data, Welsh Government
| Welsh speaking frequency | Welsh speaking fluency | National identity | Region | Number of people |
|---|---|---|---|---|
| Less often, Never | I can speak a fair amount of Welsh | Welsh | South east | 175 |
| Less often | I can only speak a little Welsh | British | South east | 150 |
| Less often | I can only speak a little Welsh | Welsh | South east | 155 |
Source: linked Census 2021 and National Survey for Wales data, Welsh Government
Hierarchical cluster analysis identified 12 distinct groups of respondents who had reported speaking Welsh in at least one source. Most clusters showed conditional agreement between Census 2021 and the National Survey for Wales on Welsh speaking status. These clusters mainly contained respondents who spoke Welsh daily and described themselves as fluent.
Three clusters showed conditional disagreement between the 2 sources. These clusters mainly included respondents who:
- spoke Welsh less often than weekly or never
- described their Welsh speaking ability as either speaking only a little Welsh or speaking a fair amount of Welsh
- lived in south east Wales
Overall, the results suggest that agreement between Census 2021 and the National Survey for Wales was highest among fluent, frequent Welsh speakers. Disagreement was more common among people who spoke Welsh less often than weekly and reported lower levels of Welsh speaking ability.
Quality and methodology information
Data linkage
This analysis was based on linked data held within the Secure Anonymised Information Linkage (SAIL) Databank. SAIL is a trusted research environment that allows anonymised records from different data sources to be linked at an individual level for research purposes. Linking the 2 sources allows responses provided by the same individual to be compared directly. This provides insights that would not be possible from analysing either dataset separately. Analysis taken from SAIL follows strict disclosure control processes to ensure that the data are not disclosive (for example, counts of less than 10 cannot be reported).
Records from Census 2021 were linked to respondents from the National Survey for Wales 2020 to 2021 and 2021 to 2022. This allowed comparisons of responses provided by the same individuals across the 2 sources. The linked dataset included respondents aged 16 years or older, the age coverage of the National Survey for Wales.
The combined survey dataset contained 27,270 records, of which 22,150 (81%) were successfully linked to a Census record.
To ensure high data quality, 640 records with a match probability below the 95% threshold were excluded. A further 11,065 duplicate records and records with missing responses to the Welsh language questions used in this analysis were also removed. The final analytical dataset comprised 10,445 records.
Conditional agreement rates were calculated using the 2,210 individuals who reported that they could speak Welsh in at least one of the two data sources. For analyses of fluency and frequency of Welsh language use, the sample was reduced to 2,110 individuals as a result of question routing.
Data quality
A limitation of linked data is that not all records from all data sources can be successfully linked. The linked dataset represents only those individuals who appear in both sources and can be matched through the linkage process. As linkage success may vary across population groups, the linked sample may not be fully representative of either the Census population or the original National Survey for Wales sample. For example, linkage rates may differ for groups that are more mobile or harder to identify consistently across data sources, resulting in potential linkage bias.
The Census and National Survey for Wales also differ in their design and purpose. Census 2021 aims to collect information from the entire population of Wales, whereas the National Survey for Wales is based on a sample of residents. Survey estimates are therefore subject to sampling variation, and some population subgroups may have relatively small sample sizes within the linked data. This limits the robustness of analyses for these groups.
The method of data collection may also influence responses. Census responses may be completed by a household reference person on behalf of other household members, whereas National Survey for Wales responses are generally collected directly from the respondent. As a result, differences observed between the 2 sources may reflect how the data are collected rather than genuine differences in the underlying characteristic being measured.
During the period covered by this analysis, the National Survey for Wales was primarily conducted by telephone following changes introduced in response to the COVID-19 pandemic, whereas Census 2021 was self-completed online or as a paper form. Responses were therefore collected in different contexts and at different points in time. These factors may contribute to differences in how individuals reported their Welsh language ability.
Disagreement between Census 2021 and the National Survey for Wales should not necessarily be interpreted as evidence that one source is more accurate than the other. Differences may arise because of:
- linkage limitations
- sampling variation
- question wording
- collection methods
- timing of data collection
- uncertainty in how individuals report subjective characteristics
- genuine differences in individuals’ Welsh language skills over time
The findings should therefore be interpreted as a measure of consistency between 2 sources rather than a measure of accuracy.
Logistic regression
Logistic regression examines how different factors are associated with an outcome that has 2 possible results. Results are shown as odds ratios. These show how the likelihood of the outcome differs between groups compared with a reference group.
In this analysis we used Python version 3.10 to fit logistic regression models. We examined the effect of a range of characteristics as an influencing factor on conditional agreement for speaking Welsh between Census 2021 and National Survey for Wales 2020 to 2021 and 2021 to 2022.
The characteristics we analysed were:
- age group
- sex
- region
- national identity
- Welsh language fluency
- frequency of speaking Welsh
We ran an adjusted model including all these characteristics to control for potential confounding factors.
Regression limitations
While logistic regression is a widely used method, it has some recognised limitations which shaped the design of our analysis.
Binary outcome restriction
Logistic regression is designed for binary outcomes. Outcomes with multiple categories would require an alternative approach, for example, multinomial or ordinal logistic regression.
Predictor variables
When predictor variables are highly correlated (multicollinearity), it can affect the reliability of the model by distorting coefficient estimates and increasing uncertainty. This makes it difficult to assess the individual impact of each variable and may result in unstable or misleading odds ratios. To mitigate this issue, we combined or excluded certain variables during model development. For example, ethnicity was not included in the model because it is too closely correlated with speaking Welsh.
Large sample requirement
Logistic regression generally requires a sufficiently large sample size to produce reliable estimates, especially when including multiple predictors. Our analysis adhered to the Events Per Variable (EVP) rule, which recommends at least 10 outcome events per predictor variable in the model. For example, if the model includes 7 predictors, there should be at least 70 cases of the outcome of interest. This helped to ensure stable coefficient estimates and reduced the risk of overfitting.
Logistic regression is a valuable method for exploring associations between variables and predicting binary outcomes. Odds ratios provide insight into the relative likelihood of different groups experiencing a given outcome. However, the model does not account for all potential influencing factors, including those excluded due to multicollinearity or those not captured in the data.
Agglomerative hierarchical clustering
Agglomerative hierarchical clustering is an unsupervised learning technique used to identify groups of similar observations within a dataset. The method begins by treating each observation as its own cluster and then successively merges the 2 most similar clusters until all observations are combined into a single hierarchy.
In this analysis we used Python version 3.10 to perform agglomerative hierarchical clustering. This examined patterns of agreement and disagreement between Census 2021 and National Survey for Wales 2020 to 2021 and 2021 to 2022 across a range of characteristics.
The characteristics included in the clustering analysis were:
- Welsh speaking in Census 2021
- Welsh speaking in National Survey for Wales
- age group
- sex
- region
- national identity
- Welsh language fluency
- frequency of speaking Welsh
The purpose of the clustering analysis was to identify groups of individuals with similar response patterns across these characteristics, without specifying conditional agreement as a predefined outcome variable.
To determine the optimal number of clusters, we evaluated a range of clustering solutions using the silhouette score. The silhouette score measures how similar observations are to others within their assigned cluster compared with observations in other clusters. Higher silhouette scores indicate more distinct and well-separated clusters. In addition to maximising the silhouette score, we required each cluster to contain at least 5% of the dataset to ensure that the resulting groups were large enough for meaningful interpretation.
During model development, age group and sex were included in the clustering analysis. However, these variables had little influence on the resulting cluster structure and did not contribute to meaningful differentiation between clusters. Removing them increased the silhouette score, indicating improved separation and cohesion of the remaining clusters. Age group and sex were therefore removed from the final clustering solution to improve cluster quality and interpretability.
Clustering limitations
While agglomerative hierarchical clustering is a useful exploratory technique, it has several recognised limitations which shaped the design of our analysis.
Exploratory nature
Hierarchical clustering identifies groups based on similarity within the available data but does not establish causal relationships between variables. The clusters should therefore be interpreted as descriptive groupings rather than evidence of underlying causes.
Sensitivity to variable selection
The clusters identified can be influenced by the variables included in the analysis. Different variable selections may produce different clustering solutions. Consequently, the clusters reflect patterns present in the selected characteristics and may not capture all factors relevant to Welsh language ability reporting.
Choice of clustering parameters
Results can vary depending on the similarity measure and linkage method used. While we selected a solution that maximised the silhouette score and met minimum cluster size requirements, alternative methodological choices may produce slightly different groupings.
Potential influence of rare groups
Very small subgroups can sometimes form isolated clusters or disproportionately influence cluster formation. To mitigate this issue, we required all final clusters to contain at least 5% of the dataset.
No definitive correct number of clusters
Hierarchical clustering does not provide a single objectively correct solution. While the silhouette score provides a quantitative measure of cluster quality, the final choice of clusters also requires consideration of interpretability and practical usefulness.
Agglomerative hierarchical clustering is a valuable method for identifying patterns and groupings within complex datasets. It can reveal similarities between individuals that may not be apparent when analysing characteristics separately. However, the resulting clusters are dependent on the variables included and methodological choices made during analysis and should therefore be interpreted as exploratory descriptions of the data rather than definitive classifications.
Comparability with previous studies
The findings have been compared, where appropriate, with those from a previous analysis examining agreement between Census 2021 and Labour Force Survey responses on Welsh language ability. These comparisons provide useful context but should be interpreted with caution. The National Survey for Wales and Labour Force Survey differ in their sample design, data collection methods, and respondent populations. In addition, the linkage methods used to link survey records to Census 2021 differed between the studies. As a result, any differences observed may reflect methodological differences as well as underlying differences in responses on Welsh language ability.
Statement of compliance with the Code of Practice for Statistics
These statistics are not classed as official statistics. However, we have applied the principles of the Code of Practice for Statistics (UK Statistics Authority) as far as possible during development.
Statistical articles generally relate to one-off analyses for which there are no updates planned, at least in the short-term, and serve to make such analyses available to a wider audience than might otherwise be the case. They are mainly used to publish analyses that are exploratory in some way, for example:
- introducing a new experimental series of data
- a partial analysis of an issue which provides a useful starting point for further research but that nevertheless is a useful analysis in its own right
- drawing attention to research undertaken by other organisations, either commissioned by the Welsh Government or otherwise, where it is useful to highlight the conclusions, or to build further upon the research
- an analysis where the results may not be of as high quality as those in our routine statistical releases and bulletins, but where meaningful conclusions can still be drawn from the results.
Where quality is an issue, this may arise in one or more of the following ways:
- being unable to accurately specify the timeframe used (as can be the case when using an administrative source)
- the quality of the data source or data used
- other specified reasons
We have therefore voluntarily applied the Code of Practice for Statistics as follows:
- the level of quality will be such that it does not significantly impact upon the conclusions as it is the order of magnitude of the results, rather than the exact results, that are of interest to the audience
- an assessment of the strengths and weaknesses in the analysis will be included in the article, for example, comparisons with other sources, along with guidance on how the analysis might be used, and a description of the methodology applied
These statistics demonstrate the standards expected around trustworthiness, quality and public value in the following ways:
Trustworthiness
The published figures are compiled by professional analysts using the latest available data and applying methods using their professional judgement and analytical skillset.
These statistics are pre-announced on the Statistics and Research area of the Welsh Government website. Access to the data during processing is restricted to people involved in the production of the statistics, quality assurance and for operational purposes. Pre-release access is restricted to eligible recipients in line with the Code of Practice (UK Statistics Authority).
Quality
Our statistics are produced to high professional standards and are produced free from any political interference. Validation checks are performed by Welsh Government statisticians, and the statistical release is approved by senior statisticians before publication.
Value
These statistics provide evidence to support understanding of Welsh language ability in Wales and differences between estimates from Census 2021 and the National Survey for Wales. The analysis combines linked administrative and survey data to provide insights that would not be available from either data source alone. The findings are intended to support policymakers, researchers and other users interested in Welsh language statistics and their interpretation.
You are welcome to contact us directly with any comments about how we meet these standards. Alternatively, you can contact OSR by emailing regulation@statistics.gov.uk or via the OSR website.
Well-being of Future Generations Act (WFG)
The Well-being of Future Generations Act 2015 is about improving the social, economic, environmental and cultural wellbeing of Wales. The Act puts in place 7 wellbeing goals for Wales. These are for a more equal, prosperous, resilient, healthier and globally responsible Wales, with cohesive communities and a vibrant culture and thriving Welsh language. Under section (10)(1) of the Act, the Welsh Ministers must (a) publish indicators (“national indicators”) that must be applied for the purpose of measuring progress towards the achievement of the wellbeing goals, and (b) lay a copy of the national indicators before Senedd Cymru. Under section 10(8) of the Well-being of Future Generations Act, where the Welsh Ministers revise the national indicators, they must as soon as reasonably practicable (a) publish the indicators as revised and (b) lay a copy of them before the Senedd. These national indicators were laid before the Senedd in 2021. The indicators laid on 14 December 2021 replace the set laid on 16 March 2016.
Information on the indicators, along with narratives for each of the wellbeing goals and associated technical information is available in the Well-being of Wales report.
Further information on the Well-being of Future Generations (Wales) Act 2015.
The statistics included in this release could also provide supporting narrative to the national indicators and be used by public services boards in relation to their local wellbeing assessments and local wellbeing plans.