Active travel (walking and cycling): April 2021 to March 2022
A range of information collected through the National Survey for Wales about active travel by people during April 2021 to March 2022.
In this page
Introduction
Active travel is measured as walking for at least 10 minutes or cycling as a means of transport to get to a particular destination. It does not include walking or cycling done for pleasure, health reasons or training. Information about active travel by people in Wales is collected through the National Survey for Wales.
Main points
The active travel questions in the most recent National Survey for Wales were asked of adults aged 16+ and over.
April 2021 to March 2022
- 6% of people cycled at least once a week for active travel purposes.
- 51% of people walked at least once a week for active travel purposes, compared with 60% in 2019-20.
- 22% of people in very good health walked every day in the last 3 months.
- 64% of those who lived in urban areas walked for more than 10 minutes as a means of transport at least once a month, compared with 47% of those who lived in rural areas.
- Data from NHS Wales shows that a total of 217 seriously injured pedestrians and 176 cyclists seriously injured in a collision were admitted to hospital in 2021.
Frequency of active travel
The National Survey for Wales has included questions about active travel since 2013-14. People are asked how frequently they used a bicycle or walked as a means of transport, in the previous three months. Chart 1 shows the frequency of active travel by cycling and year while Chart 2 shows frequency of active travel by walking and year.

(a) Data not available for 2020-21 due to changes to the National survey for Wales as a result of the coronavirus (COVID-19) pandemic.
(b) There was a reduction in the sample size in 2019-20 for responses to active travel questions around cycling, which means no comparisons should be made to previous years.
In 2021-22, 6% of adults cycled at least once a week for active travel purposes.

(a) Data not available for 2020-21 due to changes to the National survey for Wales as a result of the coronavirus (COVID-19) pandemic.
In 2021-22, 51% of people actively travelled at least once or twice a week by walking, a decrease of 9 percentage points compared to 2019-20.
The percentage of people who frequently walked for at least 10 minutes was much higher than the percentage that frequently cycled as a means of transport.
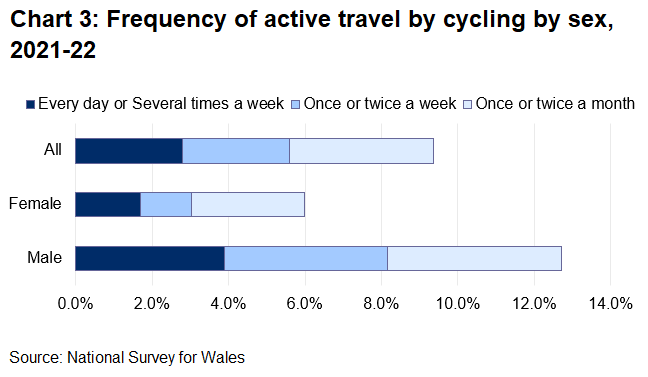
Cycling
When asked how frequently they had used a bicycle as a means of transport in the previous three months, men were significantly more likely to cycle, and to do so more frequently than women (Chart 3).
People with a limiting long-standing illness, disability or infirmity were less likely to have cycled at least once a week compared with those without a limiting illness. (Chart 4).

Walking
When asked how frequently they had walked for more than 10 minutes as a means of transport in the previous three months 18% said they walked for more than 10 minutes every day, 16% stated they walked several times a week and 17% once or twice a week (Chart 5). A further 7% walked once or twice a month and 42% said they walked less often or never.
Unlike cycling, there was no significant difference between the frequency of walking for men and women.

People with a limiting long-standing illness, disability or infirmity were less likely to walk every day (13%) for more than 10 minutes than those without a limiting illness (20%). (Chart 6)

Active travel by urban and rural classification
There was no significant difference between the frequency of cycling for active travel purposes between those living in rural and urban areas. (Chart 7)

64% of people in urban areas walked for more than 10 minutes as a means of transport at least once a month, compared with 47% of people in rural areas. People in urban areas were also more likely to walk more frequently, with 20% walking every day compared with 13% in rural areas (Chart 8).

Active travel and general health and exercise
National Survey respondents were asked to rate their general health from ‘very bad’ to ‘very good’. As might be expected, there was a clear relationship between both walking and cycling for active travel purposes and respondents’ general health. People who were in ‘very good’ or ‘good’ health were more likely to walk or cycle regularly. However, it is not possible to draw conclusions from these statistics about the nature of the relationship; some people may be healthy because they walk or cycle and others may choose to travel actively because they are already healthy.
22% of people in very good health and 19% of people in good health walked as a means of transport every day compared with 13% in fair health and 8% in very bad or bad health (Chart 9).

For cycling, 14% of people in very good health and 9% of people in good health cycled as a means of transport at least once a month compared with 6% in fair health (Chart 10).

(a) Data not available for "bad" or "very bad" general health due to small sample sizes.
Travel to school
Parents were asked how their child travelled to and from school on a typical school day. They were able to select more than one mode of transport. Chart 11 shows the modes of travel used by children to get to their primary school in 2018-19 and 2021-22, the latest two years for which the results are available.

(a) Local bus, train, bike, taxi and ‘other’ modes have been omitted from this chart due to small sample sizes.
(b) Totals may not sum to 100% as multiple modes of transport can be selected.
Car was the most common mode of transport used to get to a primary school, with 51% getting to school by car in 2021-22, followed by walking with an adult (40%).
Chart 12 shows the modes of travel used by children to get to their secondary school, by year.

(a) Walking with an adult, train, bike and ‘other’ modes have been omitted from this chart due to small sample sizes.
(b) Totals may not sum to 100% as multiple modes of transport can be selected.
The most common ways to get to secondary school in 2021-22 were by school buses (33%) and walking (32%).
By combining those who walk with an adult, on their own or with other children with the few who cycle, 48% of children actively travelled to primary school, and 34% to secondary school in 2021-22.
Terms and definitions
Urban and rural
'Urban' includes settlements with a population of 10,000 or more and small towns and their fringes, where the wider surrounding area is less sparsely populated. 'Rural' includes all other areas.
Quality information
The National Survey for Wales is carried out by the Office for National Statistics on behalf of the Welsh Government. The results reported in this bulletin are based on interviews completed between 1 April 2021 and 31 March 2022.
30,593 addresses were used with interviewers conducting telephone interviews with a randomly selected adult (aged 16+) in the household. Interviews were an average (mean) length of 32-minute and covered a range of views, behaviours, and characteristics. A total of 12,576 interviews were achieved. For more detail see the National Survey for Wales Technical report.
Interpreting results
Figures quoted in this bulletin are based on only those respondents who provided an answer to the relevant question. Some topics in the survey were only asked of a sub-sample of respondents and other questions were not asked where the question was not applicable. Missing answers can also occur for several reasons, including a refusal or an inability to answer a particular question.
Where a relationship has been discussed between two factors, this does not mean it is a causal relationship. More detailed analysis is required to identify whether one factor causes change in another, or if other factors are actually more important.
The results are weighted to ensure that the results reflect the age and sex distribution of the Welsh population.
Quality report
A summary quality report is available, containing more detailed information on the quality of the survey as well as a summary of the methods used to compile the results.
Context
The Active Travel Act (UK Legislation) places a duty on local authorities in Wales to map and plan for suitable routes for active travel, to build and improve their infrastructure for walking and cycling and to promote walking and cycling every year.
Relevance
These statistics are used to inform government, media and society and are used within Welsh Government for policy formulation and monitoring. There are no other current official statistics data sources about active travel in Wales. Some specific uses of these figures will include monitoring the impact of Active Travel (Wales) Act 2013.
Accuracy
These figures are based on the National Survey for Wales. Further information on the accuracy of this survey can be found in the technical report.
Hospital admission data for seriously injured pedal cyclists is obtained from the NHS.
Timeliness and punctuality
The figures were collected for 2021-22 and a first release was published in July 2019.
Accessibility and clarity
This statistical bulletin is pre-announced and then published on the Statistics & Research website.
Comparability and coherence
The questions in the 2017-18 National Survey for Wales on Active Travel differ to previous questions and therefore data are not directly comparable with previous statistical bulletins. The table below shows questions that were included in 2019-20 on active travel. This bulletin included analysis over multiple survey years where the survey questions have been the same as shown in table below.
| 2016-17 | 2017-18 | 2018-19 | 2019-20 | 2020-21 | 2021-22 | |
|---|---|---|---|---|---|---|
| How often used bike to get somewhere | Y | Y | Y | Y | Y | Y |
| How often walked for 10 mins to get somewhere | N | Y | Y | Y | Y | Y |
| Walks (10 mins+) or cycles at least once a week as means of transport | N | N | Y | Y | Y | Y |
N: not asked
Y: asked
| 2016-17 | 2017-18 | 2018-19 | 2019-20 | 2020-21 | 2021-22 | |
|---|---|---|---|---|---|---|
| How child travels to primary school | N | N | Y | N | N | Y |
| How child travels to secondary school | N | N | Y | N | Y | Y |
| Usual mode of travel to primary school - bus | Y | N | Y | N | N | Y |
| Usual mode of travel to primary school (car or lift) | Y | N | Y | N | N | Y |
| Usual mode of travel to primary school (walk) | Y | N | Y | N | N | Y |
| Usual mode of travel to secondary school (bus) | Y | N | Y | N | N | Y |
| Usual mode of travel to secondary school (car or lift) | Y | N | Y | N | N | Y |
| Usual mode of travel to secondary school (walk) | Y | N | Y | N | N | Y |
N: not asked
Y: asked
Related publications
The Department for Transport produce a report on Walking and cycling statistics for England (Department for Transport).
Transport Scotland produce a publication entitled ‘Transport and Travel in Scotland’.
Symbols
Figures have been rounded to the nearest integers. There may be an apparent discrepancy between the sum of the constituent items and the total shown.
National Statistics status
The United Kingdom Statistics Authority has designated these statistics as National Statistics, in accordance with the Statistics and Registration Service Act 2007 and signifying compliance with the Code of Practice for Statistics.
National Statistics status means that official statistics meet the highest standards of trustworthiness, quality and public value.
All official statistics should comply with all aspects of the Code of Practice for Statistics. They are awarded National Statistics status following an assessment by the UK Statistics Authority’s regulatory arm. The Authority considers whether the statistics meet the highest standards of Code compliance, including the value they add to public decisions and debate. The designation of these statistics as National Statistics was confirmed in February 2011 following a full assessment against the Code of Practice.
Since the latest review by the Office for Statistics Regulation, we have continued to comply with the Code of Practice for Statistics, and have made the following improvements.
- Added to and refined information about dimensions of quality and described links to policy.
- Improved our understanding of the various data sources and the methodology behind them, including their strengths and limitations.
- Added new relevant data sources to provide a broader view of the topic.
- Improved visuals by de-cluttering and standardising charts and tables.
It is Welsh Government’s responsibility to maintain compliance with the standards expected of National Statistics. If we become concerned about whether these statistics are still meeting the appropriate standards, we will discuss any concerns with the Authority promptly. National Statistics status can be removed at any point when the highest standards are not maintained and reinstated when standards are restored.
Well-being of Future Generations Act (WFG)
The Well-being of Future Generations Act 2015 is about improving the social, economic, environmental and cultural wellbeing of Wales. The Act puts in place seven wellbeing goals for Wales. These are for a more equal, prosperous, resilient, healthier and globally responsible Wales, with cohesive communities and a vibrant culture and thriving Welsh language. Under section (10)(1) of the Act, the Welsh Ministers must (a) publish indicators (“national indicators”) that must be applied for the purpose of measuring progress towards the achievement of the wellbeing goals, and (b) lay a copy of the national indicators before Senedd Cymru. Under section 10(8) of the Well-being of Future Generations Act, where the Welsh Ministers revise the national indicators, they must as soon as reasonably practicable (a) publish the indicators as revised and (b) lay a copy of them before the Senedd. These national indicators were laid before the Senedd in 2021. The indicators laid on 14 December 2021 replace the set laid on 16 March 2016.
Information on the indicators, along with narratives for each of the wellbeing goals and associated technical information is available in the Wellbeing of Wales report.
Further information on the Well-being of Future Generations (Wales) Act 2015.
The statistics included in this release could also provide supporting narrative to the national indicators and be used by public services boards in relation to their local wellbeing assessments and local wellbeing plans.
We want your feedback
We welcome any feedback on any aspect of these statistics which can be provided by email to stats.transport@gov.wales.