Assistance for housing improvement: April 2021 to March 2022
Information on expenditure by local authorities on housing improvement, Disabled Facilities Grants (DFGs) and renewal areas for April 2021 to March 2022.
In this page
Introduction
This release presents information on financial help provided by local authorities for home improvement and repair under the Regulatory Reform (Housing Assistance) (England and Wales) Order 2002 (UK legislation). It includes information on disabled facilities grants (DFGs), approved under the Housing Grants, Construction and Regeneration Act 1996 (UK legislation). Assistance is primarily aimed at improving private sector housing but is also available for social housing via housing renewal schemes. The information presented in this release is used to monitor trends in local authority activity to improve the quality of housing stock. More detailed tables showing local authority breakdowns are available on StatsWales.
Main points
- In 2021-22, the overall expenditure on assistance for housing improvement (including DFGs) was £36.3 million.
- Of the overall expenditure, £26.8 million (73.9%) was spent on mandatory DFGs.
- The average spending per mandatory DFG was £8,000.
Overall expenditure (including DFGs)
This section looks at the overall expenditure of local authority assisted home improvement and repair. This includes:
- direct local authority expenditure (in the form of grants and loans)
- mandatory and non-mandatory DFGs, which contribute to adaptations that enable a disabled person to continue living in their home
- indirect local authority expenditure (in the form of third-party assistance and loans facilitated by local authorities)
- financial contributions made by individual residents
It does not include expenditure by individuals which does not involve, or is not supported by, the local authority.
Figure 1: Overall expenditure (£ millions) on assistance for housing improvement by type of expenditure, 2012-13 to 2021-22

Description of Figure 1: A stacked column chart showing that between 2012-13 and 2021-22, the overall expenditure on assistance for housing improvement has varied between £36 million and £51 million, with mandatory DFGs accounting for most of the overall expenditure.
Source: Annual Assistance for housing improvement and Disabled facilities grants for housing returns from local authorities
[Note 1] Includes direct and indirect local authority assistance, non-mandatory DFGs and residents' contributions.
[Note 2] Data not collected for 2019-20 due to the impact of the coronavirus (COVID-19) pandemic.
(r) Data for 2020-21 has been revised since previously published.
In 2021-22, the overall expenditure for home improvement and repair was £36.3 million. Whilst this marked a 22.8% increase on the expenditure recorded in the previous year (£29.5 million (r)), it did not reach the levels observed prior to the coronavirus (COVID-19) pandemic ((£45.7 million in 2018-19).
In 2021-22, mandatory DFGs accounted for 73.9% of the overall expenditure (£26.8 million). This was similar to the proportion recorded prior to the pandemic (averaging at 73.1% between 2016-17 and 2018-19). In the most recent year, non-mandatory DFGs accounted for a further £1.7 million (4.6% of the overall expenditure).
Between 2018-19 and 2020-21, the amount spent on indirect local authority assistance (in the form of third-party assistance and facilitated loans) almost quadrupled (from £257,000 to £1 million). In 2021-22, this increased further to £1.1 million (accounting for 2.9% of the overall expenditure).
Figure 2: Overall expenditure (£ thousands) per 1,000 dwellings by local authority, 2021-22 [Note 1]
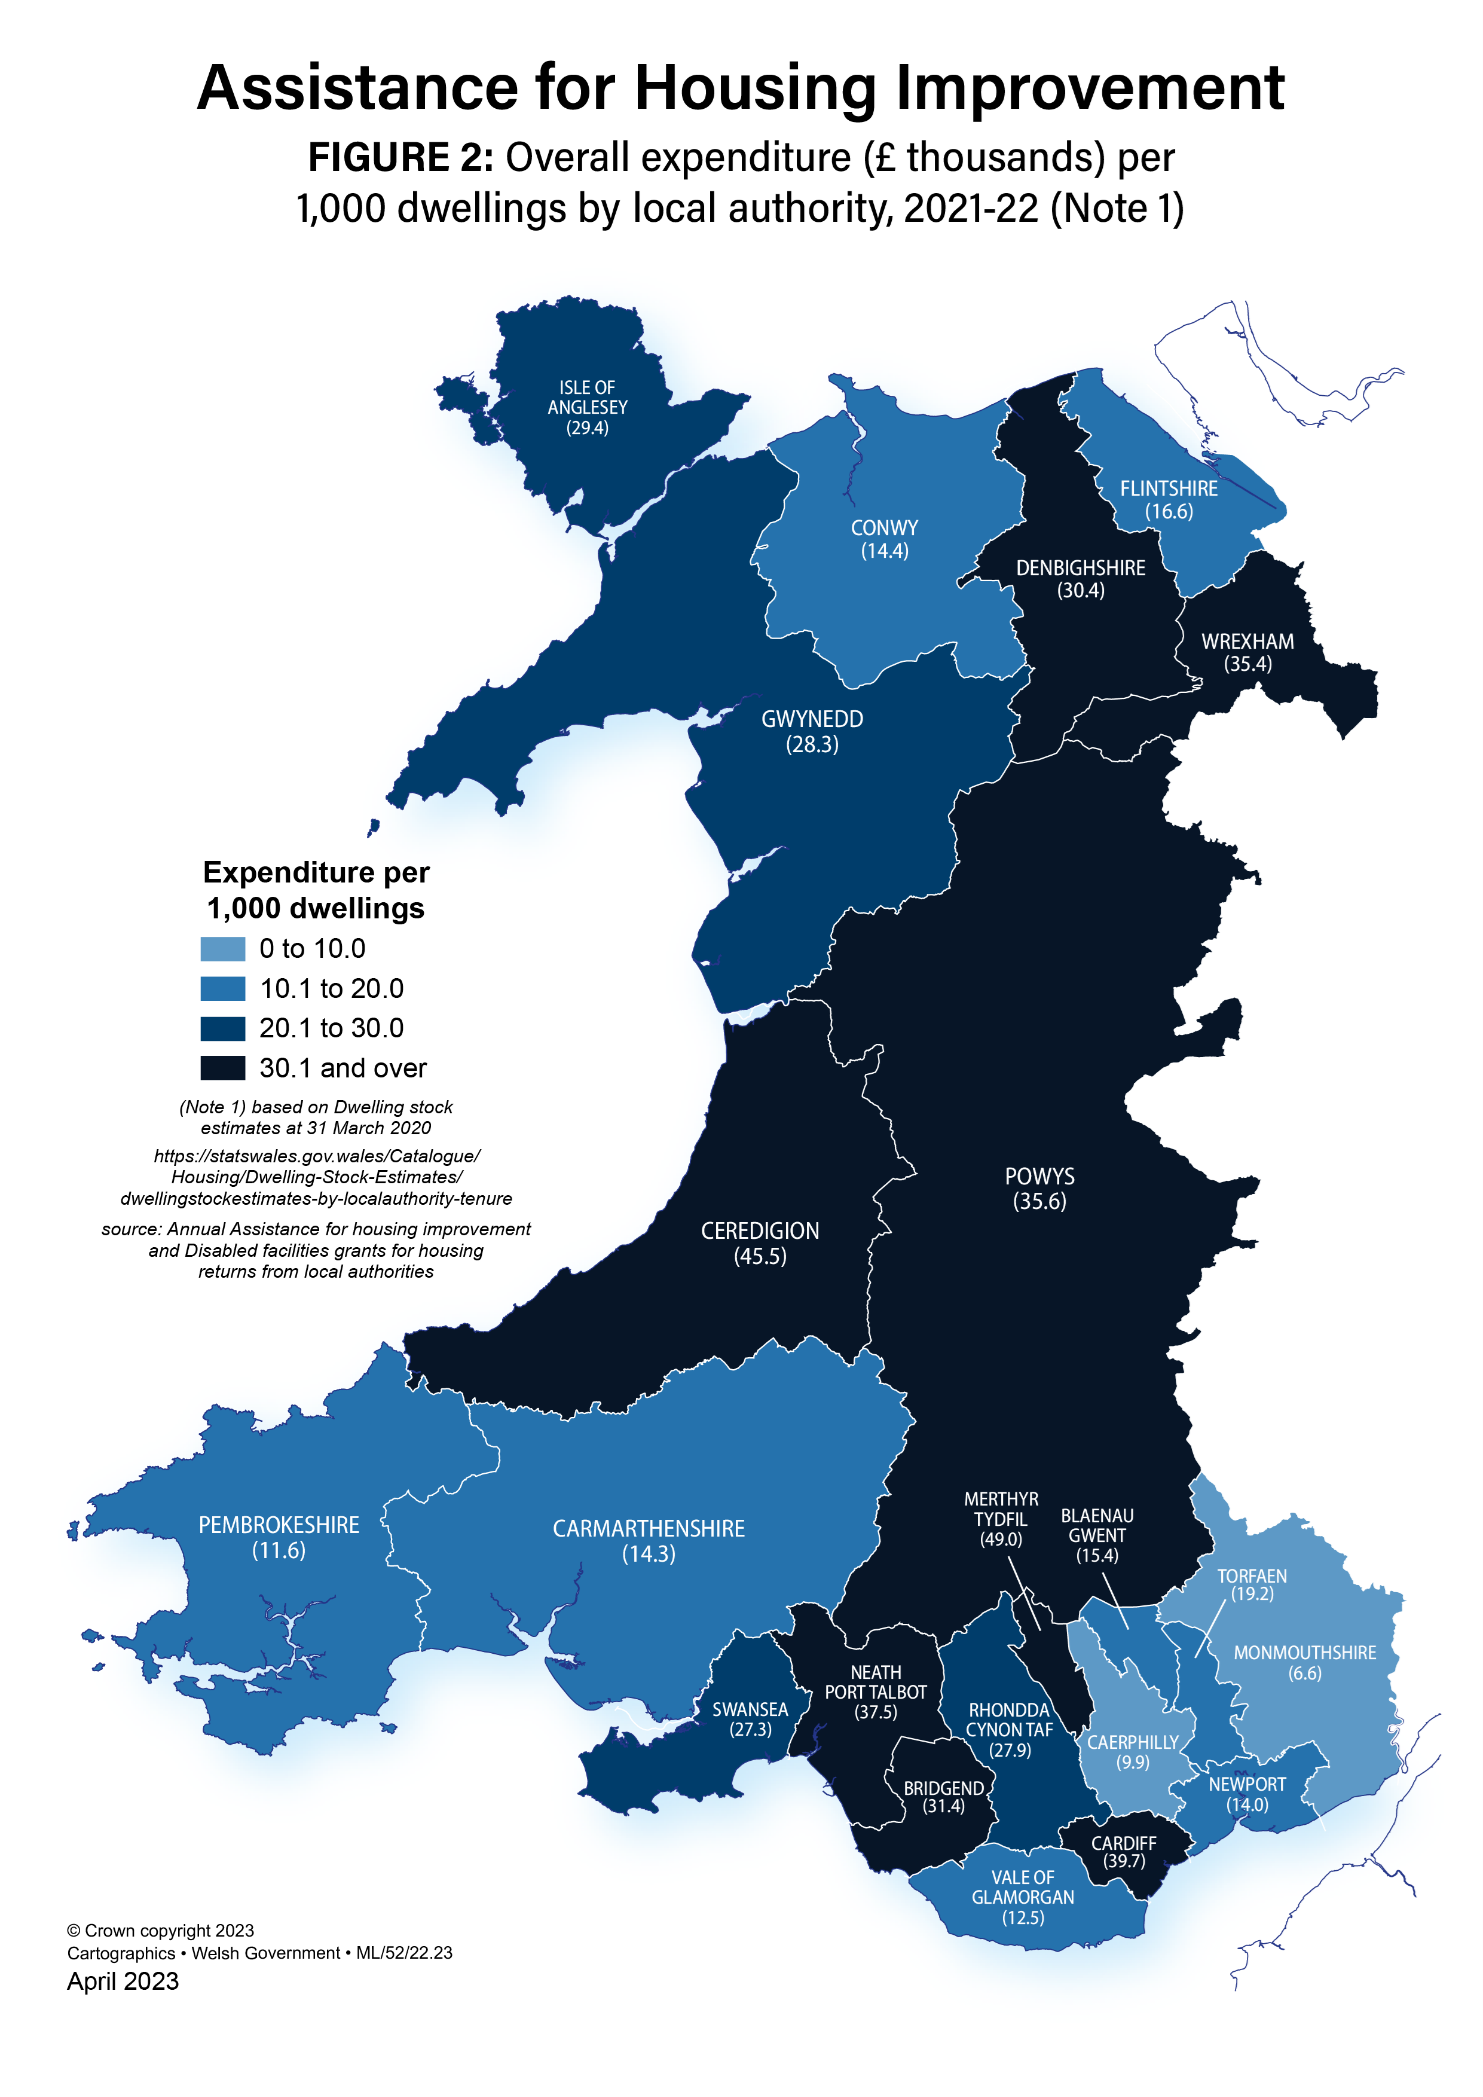
Description of Figure 2: A map showing that the greatest expenditure per 1,000 dwellings was found in Merthyr Tydfil, Ceredigion, Cardiff, Neath Port Talbot, Powys, Wrexham, Bridgend and Denbighshire, with over £30,000 spent per 1,000 dwellings.
Source: Annual Assistance for housing improvement and Disabled facilities grants for housing returns from local authorities
[Note 1] Based on dwelling stock estimates at 31 March 2020.
At a local authority level, Cardiff reported the greatest overall expenditure in 2021-22 at £6.1 million (equivalent to spending of £40,000 per 1,000 dwellings). Whilst overall expenditure was lower in Ceredigion (£1.6 million) and Merthyr Tydfil (£1.3 million), these local authorities reported the greatest spending per 1,000 dwellings (£45,000 and £49,000 respectively).
Compared to 2020-21, the largest increases in overall expenditure were observed in Merthyr Tydfil (from £150,000 to £1.3 million) and Neath Port Talbot (from £1.4 million to £2.5 million). The largest increases in spending per 1,000 dwellings were also observed in Merthyr Tydfil (from £6,000 to £49,000) and Neath Port Talbot (from £21,000 to £38,000).
DFGs
This section of the release focuses on mandatory DFGs (approved under the Housing Grants, Construction and Regeneration Act 1996 (UK legislation)) and additional, non-mandatory DFGs (including ‘top-up’ loans and grants).
In 2021-22, £26.8 million was spent on mandatory DFGs, up 32.4% on the previous year. Despite this increase, the total expenditure on mandatory DFGs was lower than earlier years (with an average spending of £32.9 million recorded between 2016-17 and 2018-19).
Figure 3: Average expenditure (£) per mandatory DFG by local authority, 2021-22

Description of Figure 3: A bar chart showing that at a local authority level, the average spending per DFG in 2021-22 varied from £12,000 in Gwynedd to £3,000 in Conwy.
Source: Annual disabled facilities grants for housing return from local authorities
In the most recent year, a total of 3,303 mandatory DFGs were completed. The average spending per mandatory DFG was £8,000, unchanged from the previous year. At a local authority level, average expenditure per mandatory DFG varied from £12,000 in Gwynedd to £3,000 in Conwy.
In 2021-22, a further £1.7 million was spent on non-mandatory DFGs. This marked a 24% decrease on 2020-21 and fell below the average observed in earlier years (£2.1 million between 2016-17 and 2018-19) .
Housing improvement (excluding DFGs)
In 2021-22, £7.8 million was spent on housing improvement through local authority grants, loans, third-party assistance and residents’ contributions. This marked an increase of 9.8% on 2020-21. In total, 3,575 dwellings were improved through this expenditure, up 18.2% on the previous year. Despite these increases, the expenditure and number of dwellings improved remained lower than earlier years (in 2018-19, £11.3 million was spent on the improvement of 6,727 homes). The average spending per dwelling was £2,000, consistent with the past 10 years.
Figure 4: Number of dwellings improved by tenure, 2021-22 [Note 1]

Description of Figure 4: A bar chart showing that in 2021-22, the majority of improved dwellings were owner occupied (60.5%) or socially rented (17.7%).
Source: Annual Assistance for housing improvement return from local authorities
[Note 1] Excludes dwellings improved through DFGs only.
In 2021-22, the majority of improved dwellings were owner occupied (60.5%). A smaller proportion of improvements took place in socially rented (17.7%) or privately rented dwellings (3.5%). The tenure spilt of improved dwellings has remained relatively stable in the past 10 years.
In the most recent year, 62.1% of dwellings were improved for people with disabilities and 30% for elderly people (aged 60 and above). Whilst there have been more fluctuations in the distribution of improved dwellings by recipient type, these proportions are similar to those recorded between 2014-15 and 2018-19 (58.9% for those with disabilities and 29.1% for the elderly). Please note that if a recipient falls into both disability and elderly categories, they will have been counted in the disability category only.
There is a great deal of variability in the assistance provided at a local authority level, due to different housing improvement assistance policies and grant schemes. In 2021-22, only 11 of the 22 local authorities reported any non-DFG expenditure, with just three local authorities accounting for a substantial proportion of the £7.8 million spent (Gwynedd accounted for 20.8%, Newport for 25.7% and Wrexham for 35.2%).
Renewal areas
Renewal areas were established to improve housing and general amenities of an area where social and environmental problems are combined with poor housing. Area-based renewal schemes enabled local authorities to focus activity and investment on areas that combine a need for assistance with the potential for regeneration.
Renewal area expenditure has steadily decreased in the past 10 years, from £33.6 million in 2012-13 to £310,000 in 2021-22. In the most recent year, all renewal area expenditure (£310,000) was accounted for by a group repair scheme in Conwy.
Future collections
In July 2021 a research report summarising information on housing adaptations completed within the period 1 April 2019 to 31 March 2020 was published. The data within this report was collected directly from adaptations providers by the Welsh Government. Submissions were received from all 13 Care & Repair agencies, from all 22 local authorities, and from 29 housing associations. Six housing associations, two of which were the Large Scale Voluntary Transfer bodies which took over the ownership of former council housing, did not submit returns. This report does not therefore provide a complete national picture of the delivery of housing adaptations. However, given the scope of this data collection, we are considering whether it could replace the information currently collected annually from local authorities on assistance for housing improvement as published within this release. We will be reviewing the content and scope of this release in due course and welcome any feedback on these early proposals.
Please provide your comments by email to: stats.housingconditions@gov.wales
Quality and methodology information
National Statistics status
The United Kingdom Statistics Authority has designated these statistics as National Statistics, in accordance with the Statistics and Registration Service Act 2007 and signifying compliance with the Code of Practice for Statistics.
National Statistics status means that official statistics meet the highest standards of trustworthiness, quality and public value.
All official statistics should comply with all aspects of the Code of Practice for Statistics. They are awarded National Statistics status following an assessment by the UK Statistics Authority’s regulatory arm. The Authority considers whether the statistics meet the highest standards of Code compliance, including the value they add to public decisions and debate.
It is Welsh Government’s responsibility to maintain compliance with the standards expected of National Statistics. If we become concerned about whether these statistics are still meeting the appropriate standards, we will discuss any concerns with the Authority promptly. National Statistics status can be removed at any point when the highest standards are not maintained, and reinstated when standards are restored.
The continued designation of these statistics as National Statistics was confirmed in 2012 following assessment by the Office for Statistics Regulation.
Since the latest review by the Office for Statistics Regulation, we have continued to comply with the Code of Practice for Statistics, and have made the following improvements:
- Expanded commentary to include more policy and operational context.
- Clarified the scope of the release (i.e., local authority expenditure in a given 12-month period).
- Enhanced trustworthiness by reducing/removing pre-release access.
Well-being of Future Generations Act (WFG)
The Well-being of Future Generations Act 2015 is about improving the social, economic, environmental and cultural wellbeing of Wales. The Act puts in place seven wellbeing goals for Wales. These are for a more equal, prosperous, resilient, healthier and globally responsible Wales, with cohesive communities and a vibrant culture and thriving Welsh language. Under section (10)(1) of the Act, the Welsh Ministers must (a) publish indicators (“national indicators”) that must be applied for the purpose of measuring progress towards the achievement of the wellbeing goals, and (b) lay a copy of the national indicators before Senedd Cymru. Under section 10(8) of the Well-being of Future Generations Act, where the Welsh Ministers revise the national indicators, they must as soon as reasonably practicable (a) publish the indicators as revised and (b) lay a copy of them before the Senedd. These national indicators were laid before the Senedd in 2021. The indicators laid on 14 December 2021 replace the set laid on 16 March 2016.
Information on the indicators, along with narratives for each of the wellbeing goals and associated technical information is available in the Wellbeing of Wales report.
Further information on the Well-being of Future Generations (Wales) Act 2015.
The statistics included in this release could also provide supporting narrative to the national indicators and be used by public services boards in relation to their local wellbeing assessments and local wellbeing plans.
Contact details
Statistician: Holly Flynn
Email: stats.housingconditions@gov.wales
Media: 0300 025 8099
SFR 38/2023