Coronavirus (COVID-19) infection survey (antibodies data): 1 to 7 November 2021
Analysis of the proportion of people in Wales testing positive for COVID-19 antibodies for 1 to 7 November 2021.
In this page
Introduction
The antibody data presented is part of the Coronavirus (COVID-19) Infection Survey (CIS) which is run across the whole of the UK. The data can be used to understand who has had the infection in the past or has developed antibodies as a result of vaccination.
The analysis presented on past infection and/or vaccination, is defined as testing positive for antibodies to SARS-CoV-2 based on findings from the COVID-19 Infection Survey. SARS-CoV-2 is the scientific name given to the specific virus that causes COVID-19.
Information on the method used to model antibody estimates can be found on the Office for National Statistics website.
This publication also includes estimates of the percentage of people who have reported via the survey that they have received one or more doses of a COVID-19 vaccination, as well as those that have been fully vaccinated. These estimates are not the same as the published figures from Public Health Wales on recorded vaccinations and do not include residents of care homes.
Additional information, such as estimates of antibody positivity broken down by single year of age for each of the UK countries can be found on the Office for National Statistics website.
Proportion of people in Wales who had antibodies against COVID-19
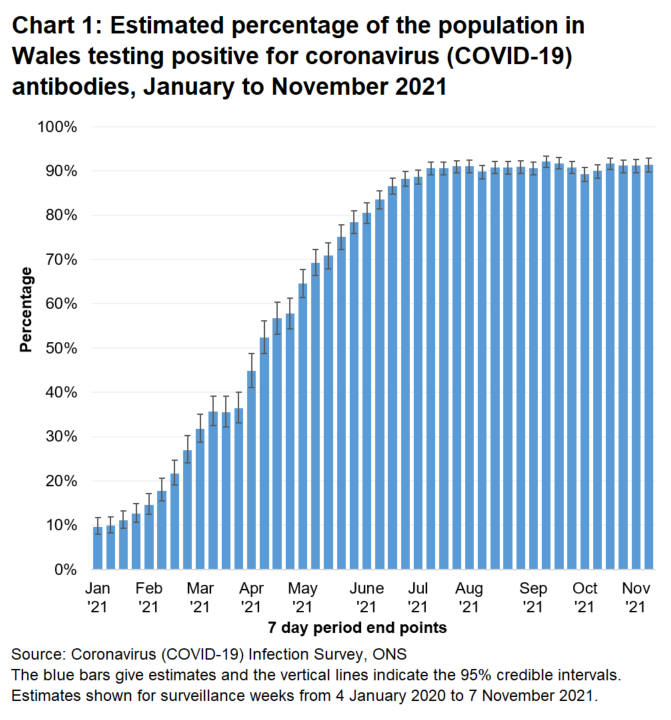
Between 1 and 7 November 2021, it is estimated that over 9 in 10 people (91.4%) aged 16 and over tested positive for antibodies to the coronavirus (COVID-19) (95% credible interval: 89.7% to 92.9%).
We are seeing increasing numbers of tests close to the threshold for detection, so we can expect to see fluctuations in our estimates of antibody positivity over time. We will continue to monitor the longer term trend, and caution should be applied if comparing antibody levels between specific time periods.
Antibody positivity is defined by a fixed concentration (or threshold) of antibodies in the blood; having a negative test for antibodies does not mean that a person has no immune response to an infection.
Most people who are vaccinated will retain a higher antibody level than before vaccination even after dropping below the standard threshold value. A negative result does not mean that antibody level is at zero, nor that a person has no protection against COVID-19, as an immune response does not rely on the presence of antibodies alone.
As more people become vaccinated the number of people with antibodies is expected to increase. However, the detection of antibodies alone is not a precise measure of immunity protection acquired from vaccinations. This is because antibody levels in the blood can decline over time, meaning that some people who have previously had COVID-19 may subsequently test negative for antibodies. For this reason, these figures should be regarded as estimates of monthly antibodies prevalence, not cumulative exposure.
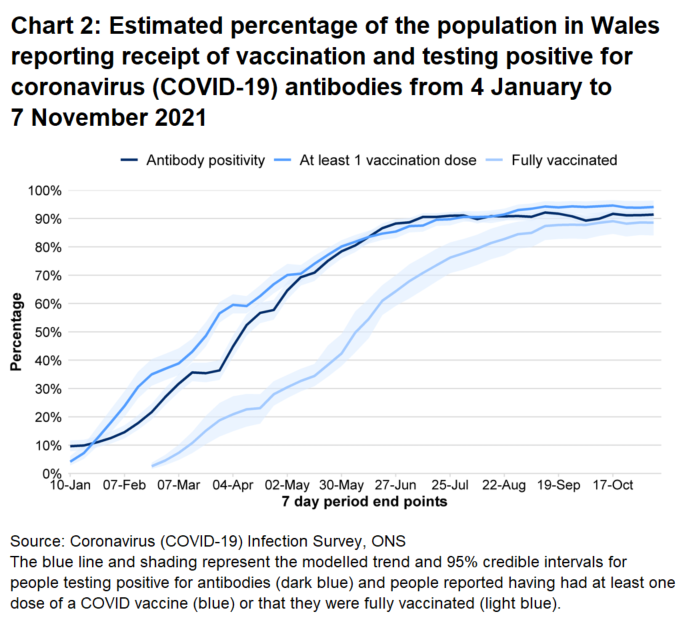
The modelled estimates suggest that the percentage of people reporting they have had at least one dose of a COVID vaccine and those reporting they have been fully vaccinated has increased, and the antibody rate has remained high.
Between 1 and 7 November, according to the survey over 9 out of 10 people aged 16 and over reported they had received one or more doses of a COVID-19 vaccine, with almost 9 out of 10 people reporting they had been fully vaccinated.
The vaccinations estimates are not the same as the published figures from Public Health Wales on recorded vaccinations and do not include residents of care homes, hospitals or other institutional settings. There will be differences between these modelled estimates and the official figures due to differences in coverage, methods and timeliness. The estimates produced from the survey are helpful to compare with other characteristics, such as testing positive for antibodies.
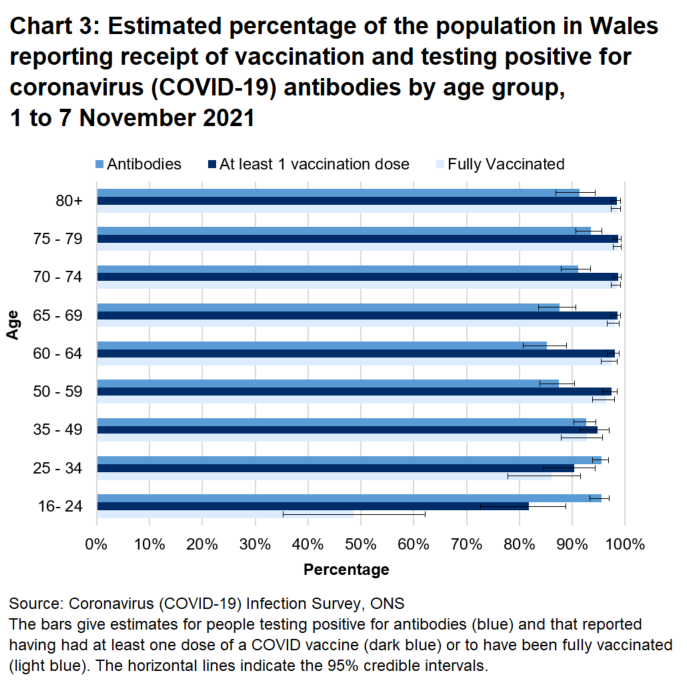
The percentage of people testing positive for antibodies remains high across all age groups. The antibody rates have increased for those aged 70 to 74 and 75 to 80 in Wales, with estimates at 91.1% and 93.5% respectively in the week 1 to 7 November. This rise could be a result of the vaccination booster programme.
Caution should be taken when interpreting these estimates. Credible intervals are wide and the sample size is relatively low, meaning there is uncertainty surrounding these figures.
Definitions
Community population
This survey covers people living in private households only and this is referred to as the community population. Residents in hospitals, care homes and/or other institutional settings are excluded.
Credible intervals
A credible interval gives an indication of the uncertainty of an estimate from data analysis. 95% credible intervals are calculated so that there is a 95% probability of the true value lying in the interval.
Positivity rate
The estimated proportion of people who test positive for antibodies against coronavirus (COVID-19) at a point in time.
Surveillance weeks
These are standardised Monday-Sunday weeks, which are used internationally and are useful for comparability. However this approach sometimes results in estimates referring to a period of fewer than 7 days if the full week’s data is not available.
Quality and methodology information
Information on the method used to model antibody estimates presented in this publication can be found on the ONS website. The model used is based on standardised Monday-Sunday surveillance weeks, as opposed to the 28-day periods previously reported on, enabling more timely weekly estimates to be produced. Estimates based on the current model are presented from 4 January 2021 onwards. The final week’s modelled estimate is subject to more uncertainty as it is an incomplete week of data and therefore more likely to change when more data becomes available.
The analysis presented is based on blood test results taken from a randomly selected subsample of individuals aged 16 years and over, which are used to test for antibodies against SARS-CoV-2. This can be used to help understand who has had the infection in the past or has developed antibodies as a result of vaccination.
One way the body fights infections like COVID-19 is by producing small particles in the blood called antibodies. It takes between two and three weeks after infection or vaccination for the body to make enough antibodies to fight the infection. Antibodies remain in the blood at low levels, although these levels can decline over time to the point that tests can no longer detect them. Having antibodies can help to prevent individuals from getting the same infection again.
The presence of antibodies is measured to understand who has had coronavirus (COVID-19) in the past and the impact of vaccinations. Once infected, the length of time antibodies remain at detectable levels in the blood is not fully known. It is also not yet known how having detectable antibodies, now or at some time in the past, affects the chance of getting COVID-19 again.
This publication also presents self-reported estimates of the percentage of people who have received one or more doses of a COVID-19 vaccination since 4 January 2021 and estimates of the percentage of people reported to be fully vaccinated since 15 February 2021. These estimates are based on modelling of the people visited in the COVID-19 Infection Survey in the community in a particular time period. The estimates are then adjusted (post-stratified) to be representative of the population.
These estimates are not the same as the published government figures on recorded vaccinations and there may be differences between these modelled estimates and the official figures, which are updated more regularly. The estimates produced from the survey are helpful to compare with other characteristics, such as testing positive for antibodies.
The UK coronavirus dashboard includes daily data for the UK and each constituent country on the actual number of people who have received a COVID-19 vaccination. This is based on individual vaccination records (administrative data held by each nation) and should be used to understand progress of the vaccination programme across the UK.
These statistics refer to infections reported in the community, by which we mean private households. These figures exclude infections reported in hospitals, care homes and/or other institutional settings. The population used in this analysis relates to the community population aged 16 years and over.
It is important to note that there is a significant degree of uncertainty with the estimates. This is because, despite a large sample of participants, the number of positive cases identified is small. Estimates are provided with 95% credible intervals to indicate the range within which we may be confident the true figure lies.
Further information on antibody test results is published by the Office for National Statistics (ONS) and includes antibody information for England, Wales, Scotland and Northern Ireland. The estimates for Northern Ireland and Scotland are published by the respective administrations, as we do here for Wales.
Further information about quality and methodology can be found on the ONS website and the survey pages on the Oxford University site.
More information about the COVID-19 Infection Survey in Wales.
Well-being of Future Generations Act (WFG)
The Well-being of Future Generations Act 2015 is about improving the social, economic, environmental and cultural wellbeing of Wales. The Act puts in place seven wellbeing goals for Wales. These are for a more equal, prosperous, resilient, healthier and globally responsible Wales, with cohesive communities and a vibrant culture and thriving Welsh language. Under section (10)(1) of the Act, the Welsh Ministers must (a) publish indicators ('national indicators') that must be applied for the purpose of measuring progress towards the achievement of the wellbeing goals, and (b) lay a copy of the national indicators before Senedd Cymru. The 46 national indicators were laid in March 2016.
Information on the indicators, along with narratives for each of the well-being goals and associated technical information is available in the Wellbeing of Wales report.
Further information on the Well-being of Future Generations (Wales) Act 2015.
The statistics included in this release could also provide supporting narrative to the national indicators and be used by public services boards in relation to their local wellbeing assessments and local wellbeing plans.
Next update
8 December 2021
Contact details
Statistician: Lisa Bloemberg
Telephone: 0300 025 0166
Email: kas.covid19@gov.wales
Media: 0300 025 8099
SFR 368/2021