Coronavirus (COVID-19) infection survey (antibodies data): 26 to 29 September 2022
Analysis of the proportion of people in Wales testing positive for COVID-19 antibodies for 26 to 29 September 2022.
In this page
Introduction
The antibody data presented is part of the Coronavirus (COVID-19) Infection Survey (CIS) which is run across the whole of the UK. The data can be used to understand who has had the infection in the past or has developed antibodies as a result of vaccination.
The analysis presented on past infection and/or vaccination, is defined as testing positive for antibodies to SARS-CoV-2 based on findings from the COVID-19 Infection Survey. SARS-CoV-2 is the scientific name given to the specific virus that causes COVID-19.
Information on the method used to model antibody estimates can be found on the Office for National Statistics website.
Additional information, such as estimates of antibody positivity broken down by single year of age for each of the UK countries can be found on the Office for National Statistics website.
In this publication, estimates of antibody positivity are included for the following thresholds: 179 ng/ml, 800 ng/ml, 2000 ng/ml, 4000 ng/ml and 6000 ng/ml.
Estimates of antibody positivity at higher levels have been introduced to enable enhanced monitoring of antibody levels and waning. These levels are not based on academic research on protection against Omicron, as sufficient evidence is not yet available. The 800 ng/ml level is the highest level at which it is possible to produce a historic series back to December 2020.
Proportion of people in Wales who had antibodies against COVID-19
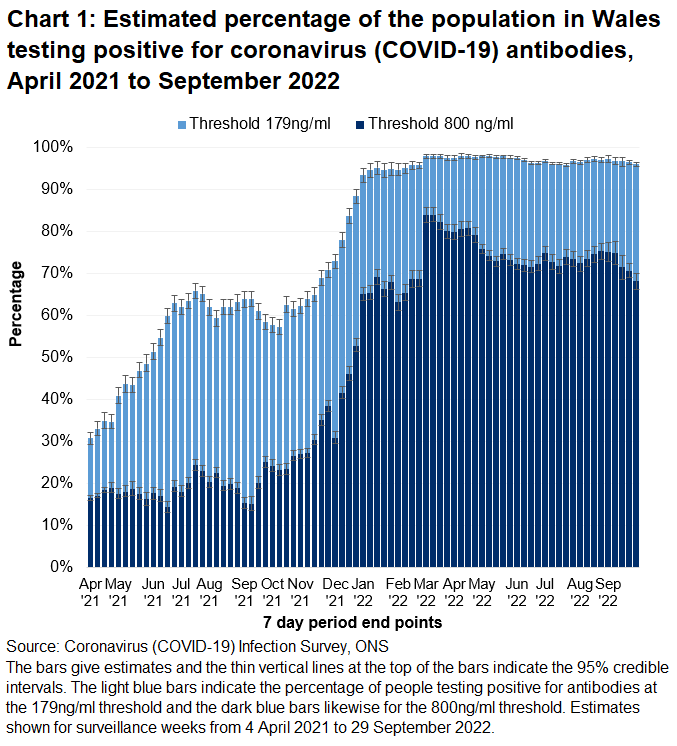
In this release, we report on percentages of the population that are estimated to have antibodies against SARS-CoV-2, the specific virus that causes coronavirus (COVID-19) above two levels: a 179 ng/ml level and a higher 800 ng/ml threshold level. Measuring antibody positivity at higher thresholds allows for the observation of antibody waning earlier. This is the reason for the introduction of higher thresholds even if they do not cover a long time period as do the 179ng/ml and 800ng/ml thresholds.
Between 26 and 29 September, over 9 in 10 people (95.9%) of the 16+ population tested positive for antibodies to COVID-19 at or above 179 ng/mL from a blood sample (95% credible interval: 95.0% to 96.5%). 68.1% of adults had antibodies at or above 800 ng/mL (95% credible interval: 65.4% to 70.5%).
There have been several improvements made to the antibody modelling which has resulted in some small changes to the antibody positivity estimates in recent weeks. Though there is uncertainty with the estimates in general, it appears that the percentage of people testing positive for antibodies remained high in recent weeks.
Antibody positivity is defined by a fixed concentration (or threshold) of antibodies in the blood. Having a negative test for antibodies does not mean that a person has no immune response to an infection.
Most people who are vaccinated will retain a higher antibody level than before vaccination even after dropping below the standard threshold value. A negative result does not mean that antibody level is at zero, nor that a person has no protection against COVID-19, as an immune response does not rely on the presence of antibodies alone.
As more people become vaccinated the number of people with antibodies is expected to increase. However, the detection of antibodies alone is not a precise measure of immunity protection acquired from vaccinations. This is because antibody levels in the blood can decline over time, meaning that some people who have previously had COVID-19 may subsequently test negative for antibodies. For this reason, these figures should be regarded as estimates of monthly antibodies prevalence, not cumulative exposure.
Between 26 and 29 September, the percentage of people testing positive for antibodies at the 179ng/ml threshold ranged from 92.4% in people aged 65-69 to 98.7% in people aged 75-79. At the 800ng/ml threshold the range was from 61.9% in people aged 35-49 to 85.1% in people aged 75-79. Estimates are available for age groups over 16 years only in this release due to ongoing additional quality assurance of data for younger age groups.
Caution should be taken when interpreting these estimates. Credible intervals are wide and the sample size is relatively low, meaning there is uncertainty surrounding these figures.

In this release additional antibodies thresholds are introduced to provide a more detailed picture of antibody levels by age group. Chart 3 shows the proportion of the adult population estimated to have antibodies to SARS-CoV-2 for the following thresholds:
- 2,000 ng/ml
- 4,000 ng/ml
- 6,000 ng/ml
This shows that the percentage of people testing positive is higher at the 2,000ng/ml threshold and reduces as the threshold increases. Those in the 35 to 49 age category have the lowest levels of antibodies across the three thresholds.

Antibody thresholds
Academic research on antibody thresholds, using data from when the Delta variant was the dominant strain, indicates that a higher threshold of antibodies is needed to provide protection from new COVID-19 infections for those who are vaccinated. The threshold used previously now referred to as the ‘standard threshold (42 ng/ml)’ was determined prior to the development of coronavirus (COVID-19) vaccinations. This threshold is no longer reported on.
ONS has introduced additional thresholds associated with a higher concentration of antibodies, to estimate the percentage of adults who are likely to have strong protection against getting a new COVID-19 infection. A previous COVID-19 infection typically results in a stronger immune response than vaccination. To get a similar level of protection from vaccination alone, a higher concentration of antibodies is needed.
The threshold of 179 ng/ml was identified as providing a 67% lower risk of getting a new COVID-19 infection with the Delta variant after two vaccinations with either Pfizer or AstraZeneca vaccines, compared with someone who was unvaccinated and had not had COVID-19 before. This higher threshold was identified by comparing how the risk of new COVID-19 infections with the Delta variant, varied across different antibody levels. It is unlikely that this threshold will provide equivalent protection against the Omicron variant and analyses of the effectiveness of vaccinations against the Omicron variant are ongoing.
As the pandemic and vaccinations have evolved, ONS has reviewed how information is presented about antibody levels. To enable enhanced monitoring of antibody levels and waning, an additional antibody series has been introduced based on a higher level of 800 (ng/ml). All antibody data can be found in the ONS Coronavirus (COVID-19) antibody data for the UK: dataset.
Modelled vaccination estimates for one or more and two or more COVID-19 vaccinations for Wales require additional quality assurance and have not been included here.
Definitions
Community population
This survey covers people living in private households only and this is referred to as the community population. Residents in hospitals, care homes and/or other institutional settings are excluded.
Credible intervals
A credible interval gives an indication of the uncertainty of an estimate from data analysis. 95% credible intervals are calculated so that there is a 95% probability of the true value lying in the interval.
Positivity rate
The estimated proportion of people who test positive for antibodies against coronavirus (COVID-19) at a point in time.
Surveillance weeks
These are standardised Monday to Sunday weeks, which are used internationally and are useful for comparability. However this approach sometimes results in estimates referring to a period of fewer than 7 days if the full week’s data is not available.
Quality and methodology information
Information on the method used to model antibody estimates presented in this publication can be found on the ONS website. The model used is based on standardised Monday-Sunday surveillance weeks, as opposed to the 28-day periods previously reported on, enabling more timely weekly estimates to be produced. Estimates based on the current model are presented from 4 January 2021 onwards. The final week’s modelled estimate is subject to more uncertainty as it is an incomplete week of data and therefore more likely to change when more data becomes available.
The analysis presented is based on blood test results taken from a randomly selected subsample of individuals aged 16 years and over, which are used to test for antibodies against SARS-CoV-2. This can be used to help understand who has had the infection in the past or has developed antibodies as a result of vaccination.
One way the body fights infections like COVID-19 is by producing small particles in the blood called antibodies. It takes between two and three weeks after infection or vaccination for the body to make enough antibodies to fight the infection. Antibodies remain in the blood at low levels, although these levels can decline over time to the point that tests can no longer detect them. Having antibodies can help to prevent individuals from getting the same infection again.
The presence of antibodies is measured to understand who has had coronavirus (COVID-19) in the past and the impact of vaccinations. Once infected, the length of time antibodies remain at detectable levels in the blood is not fully known. It is also not yet known how having detectable antibodies, now or at some time in the past, affects the chance of getting COVID-19 again.
To enable enhanced monitoring of antibody levels and waning, an additional antibody series with a higher level of 800 ng/ml has been introduced. This level is the highest level at which historic estimates can be provided. The 800 ng/ml level has been chosen solely based on the test result data to provide historic estimates and is not based on any evidence on the level of antibodies needed for protection against Omicron, as this evidence is not yet available. New thresholds have now been introduced giving estimates of antibody positivity at 2000 ng/ml, 4000 ng/ml and 6000 ng/ml. These levels have been introduced to enable enhanced monitoring of antibody levels and waning.
The UK coronavirus dashboard includes daily data for the UK and each constituent country on the actual number of people who have received a COVID-19 vaccination. This is based on individual vaccination records (administrative data held by each nation) and should be used to understand progress of the vaccination programme across the UK.
These statistics refer to infections reported in the community, by which we mean private households. These figures exclude infections reported in hospitals, care homes and/or other institutional settings. The population used in this analysis relates to the community population aged 16 years and over.
It is important to note that there is a significant degree of uncertainty with the estimates. This is because, despite a large sample of participants, the number of positive cases identified is small. Estimates are provided with 95% credible intervals to indicate the range within which we may be confident the true figure lies.
Further information on antibody test results is published by the Office for National Statistics (ONS) and includes antibody information for England, Wales, Scotland and Northern Ireland. The estimates for Northern Ireland and Scotland are published by the respective administrations, as we do here for Wales.
Further information about quality and methodology can be found on the ONS website and the survey pages on the Oxford University site.
More information about the COVID-19 Infection Survey in Wales.
Well-being of Future Generations Act (WFG)
The Well-being of Future Generations Act 2015 is about improving the social, economic, environmental and cultural wellbeing of Wales. The Act puts in place seven wellbeing goals for Wales. These are for a more equal, prosperous, resilient, healthier and globally responsible Wales, with cohesive communities and a vibrant culture and thriving Welsh language. Under section (10)(1) of the Act, the Welsh Ministers must (a) publish indicators (“national indicators”) that must be applied for the purpose of measuring progress towards the achievement of the wellbeing goals, and (b) lay a copy of the national indicators before Senedd Cymru. Under section 10(8) of the Well-being of Future Generations Act, where the Welsh Ministers revise the national indicators, they must as soon as reasonably practicable (a) publish the indicators as revised and (b) lay a copy of them before the Senedd. These national indicators were laid before the Senedd in 2021. The indicators laid on 14 December 2021 replace the set laid on 16 March 2016.
Information on the indicators, along with narratives for each of the well-being goals and associated technical information is available in the Wellbeing of Wales report.
Further information on the Well-being of Future Generations (Wales) Act 2015.
The statistics included in this release could also provide supporting narrative to the national indicators and be used by public services boards in relation to their local wellbeing assessments and local wellbeing plans.
Next update
2 December 2022