General practice workforce: as at 30 September 2022
Workforce analysis including headcount and full-time equivalent (FTE) of general practitioners (GPs), nurses and other staff working in general practices, as at 30 September 2022.
In this page
Introduction
The purpose of this release is to provide timely statistics on the number of staff working in general practices across Wales and their characteristics.
Statistics are presented for different job types by headcount and FTE. Headcounts are unique counts of people, which means that if a person works across multiple practices, they are only counted once. FTEs count the number of hours staff are contracted to work, with one FTE equal to 37.5 hours per week.
This release also includes analysis of GPs and wider practice staff by age, sex, ethnicity and Welsh language skills. Additional data tables are published on StatsWales.
The main source of data is the Wales National Workforce Reporting System (WNWRS). Additional information is available in the quality and methodology information section.
Summary
The number of fully qualified GPs (headcount) working in general practices across Wales has remained at a broadly similar level when compared to the same quarter last year. Full time equivalent (FTE) data is only available for the most recent four quarters and shows a slight downward trend.
The majority of GPs had permanent contracts with part-time hours. Most GPs were partners or providers, though the number of partners or providers has decreased by 1.3% since the same quarter last year.
In the quarter to 30 September 2022, locum sessions recorded through Locum Hub Wales accounted for 5.6% of the total full-time equivalent for fully qualified GPs. This means that 94.4% of the contracted hours in the quarter were for permanent GPs.
The number of registrars continues to increase sharply, with 72 (or 16.9%) more registrars in September 2022 than in September 2021.
There was close to one fully qualified GP (headcount) for every 1,300 people in Wales, or using full time equivalents, close to one GP for every 2,000 people in Wales.
The trend of an increasing proportion of female GPs continued; more than half (54.3%) of fully qualified GPs FTE were female. For every one male GP joining the workforce in the year to September 2022, there were nearly two female GPs who also joined.
There is greater ethnic diversity among fully qualified GPs compared to the general population of Wales. 17.4% of fully qualified GPs were from black, Asian or other minority ethnic backgrounds.
Two thirds of fully qualified GPs were aged under 50, with more than 3% aged 65 or older.
The number of wider practice staff (non-GPs) also remained at a similar level to the same period last year, marginally lower than the record high number of staff recorded in June 2022. The number of staff involved in direct patient care (such as health care assistants, dispensers and pharmacists) continued to increase, while nurses and administrative staff remained broadly unchanged.
More than 9 out of 10 wider practice staff were female and wider practice staff have an older age profile than GPs, with just over half of wider practice staff aged 50 or older.
Wider practice staff are less ethnically diverse than the general population of Wales, with less than 3% of wider practice staff from black, Asian or other minority ethnic backgrounds.
One in ten of all staff employed in general practice (including GPs and wider practice staff) reported that they speak Welsh to a high or proficient standard.
As of January 2023, there were just over 21,000 patients registered to GP practices in Wales that were living in England, and just over 13,000 patients registered to GP practices in England while living in Wales.
Main points
In Wales, at 30 September 2022, there were:
- 386 active GP practices
- 2,347 fully qualified GPs with an FTE of 1,542 (or 65.7%) of the headcount. This includes partners, providers, salaried, retainers and active locums only
- 498 GP registrars (trainee GPs) with an FTE of 446 (or 89.5%) of the headcount
- 7,972 wider practice staff (non-GPs) with an FTE of 5,778 (or 72.5%) of the headcount
When broken down by specific GP types and staff groups, there were:
- 1,974 GP practitioners with an FTE of 1,445 (or 73.2%) of the headcount. This includes partners, providers and salaried GPs only.
- 26 GP retainers with an FTE of 10 (or 38.8%) of the headcount
- 474 GP locums with an FTE of 86 (or 18.2%) of the headcount. Locums are only counted if they were active and had contracts recorded in the Locum Hub Wales system between 1 July and 30 September 2022
- 1,419 registered nurses with an FTE of 1,023 (or 72.1%) of the headcount
- 1,310 direct patient care staff (including staff who work as health care assistants, dispensers and pharmacists) with an FTE of 920 (or 70.3%) of the headcount)
- 5,314 administrative or other non-clinical practice staff with an FTE of 3,835 (or 72.2%) of the headcount)
Fully qualified GPs
Full definitions of GP types are included in the quality and methodology information section. This section only includes data for GPs with contracts as a partner, provider, salaried, retainer or locum. Locums are only counted where they were active in the quarter and had contracts recorded through Locum Hub Wales.
If a GP has more than one contract type, they are only counted once in the headcount of a ‘fully qualified GP’ but all hours are counted towards the FTE number.
One FTE is the equivalent of a 37.5 hours, or 9 sessions of 4.167 hours, per week for fully qualified GPs. If a single fully qualified GP is contracted to more than 37.5 hours, their FTE will be greater than 1.
Figure 1: Number of fully qualified GPs, headcount and full-time equivalent (FTE) [Note 1], 30 June 2021 to 30 September 2022

Description of Figure 1: Bar chart which shows the headcount of fully qualified GPs has been broadly stable for the last six quarters, but there is a slight, short-term downward trend for fully qualified GPs FTE.
Source: Wales National Workforce Reporting System
[Note 1] FTE data is available from 31 December 2021. The FTE number is likely to be a slight underestimate as a small number of GPs have no contracted or working hours recorded. In September 2022, this affected 5 GP contracts.
Number of GPs employed in general practices, by GP type and local health board on StatsWales
The latest data shows that there were 2,347 fully qualified GPs working in Wales on 30 September 2022. This is a small increase (2.0%) from the previous quarter, but a small decrease (1.3%) from the same quarter last year.
There were 1,542 FTE fully qualified GPs on 30 September 2022. This is equivalent to 65.7% of the headcount performing full-time hours. The number of FTE fully qualified GPs decreased by 1.3% since the previous quarter. A comparison with the same quarter in the previous year cannot be made as FTE data was not available until December 2021.
Considering only fully qualified, permanent GPs (includes partners, providers, salaried and retainers, but excludes locums), there was a headcount of 2,000 GPs who were contracted to work a full-time equivalent of 1,455 GPs, or 72.8% of the headcount. The headcount decreased by 3.2% since the same quarter in the previous year.
Figure 2: The proportion of fully qualified GPs by GP type, 30 September 2022

Description of Figure 2: Pie charts showing that the majority of fully qualified GPs (contracts) were partners or locum GPs. The proportion of GPs with partner or salaried contracts is greater when measured by FTE as these GPs are typically contracted to longer hours than locums and retainers.
Source: Wales National Workforce Reporting System, Locum Hub Wales
[Note 1] The number of contracts differs from the headcount measure featured elsewhere in this publication, as a single GP may have more than one contract type.
Number of GPs employed in general practices, by GP type and local health board on StatsWales
Nearly half (46.2%) fully qualified GP contracts were for partners. This increased to over seven out of ten (73.5%) when measured by FTE.
Nearly one out of six (16.4%) fully qualified GP contracts were for salaried GPs. This increased to just over one out of five (20.3%) when measured by FTE.
There are very few retainer contracts each year in Wales and retainers accounted for 0.8% of the total number of contracts and 0.7% of the FTE for fully qualified GPs in the latest period.
This means that 94.4% of FTE fully qualified GPs had permanent contracts in the latest period.
More than one in three (36.6%) of the fully qualified GP contracts were for locums, but locums typically performed part-time hours and accounted for close to one in twenty (5.6%) of the fully qualified GPs FTE.
Figure 3: Full-time equivalent (FTE) [Note 1] fully qualified GPs per 10,000 population [Note 2] by local health board, 30 September 2022

Description of Figure 3: Bar chart showing that the FTE of fully qualified GPs per 10,000 population varied between 4.6 in Aneurin Bevan and 6.3 in Powys.
Source: Wales National Workforce Reporting System, ONS mid-year population estimates (2021)
[Note 1] The FTE number is likely to be a slight underestimate as a small number of GPs have no contracted or working hours recorded. In September 2022 this affected 5 GP contracts.
[Note 2] Based on the 2021 mid-year population estimates as 2022 data was not available at the time of publication. Data will be revised using the 2022 mid-year population estimates in the next statistical release.
On 30 September 2022, there were 5.0 FTE fully qualified GPs per 10,000 population in Wales. The FTE number of fully qualified GPs per 10,000 population was relatively similar across all health boards other than in Powys where there were 6.3 FTE fully qualified GPs per 10,000 population.
GPs by contract type
GPs can be categorised by the types of contract they hold. Definitions for each GP type are included in the quality and methodology information section.
If a GP has multiple contracts within the same type, they will be counted once in the headcount for that type but all hours will be counted in the FTE number.
If a GP has multiple contracts with different GP types, they will be counted once in the headcount for each type and the hours for each contract type will be included in the FTE number for the associated contract type only.
For these reasons, the FTE of ‘fully qualified GPs’ is equal to the sum of the FTE for partner/provider, salaried, retainer and locum. However, the headcount is not equal to the sum of the component GP types.
Figure 4: Headcount and full-time equivalent (FTE) [Note 1] by GP type, 30 June 2021 to 30 September 2022

Description of Figure 4: Line charts showing that while the majority of GP types have relatively small changes for both headcount and FTE, registrars have substantially increased over the time series.
Source: Wales National Workforce Reporting System, Locum Hub Wales, NHS Electronic Staff Record (ESR)
[Note 1] The FTE number is likely to be a slight underestimate as a small number of GPs have no contracted or working hours recorded. In September 2022, this affected 5 GP contracts.
[Note 2] A standard contract for a registrar is for 40 hours per week, therefore the FTE is based on a 40-hour week, whereas the FTE for all other GPs is based on 37.5 hours per week.
[Note 3] Locums are counted if they had any work recorded through Locum Hub Wales at any point during the quarter ending in the snapshot date only. For all the other GP types, it based on the headcount and FTE as at the snapshot date.
Number of GPs employed in general practices, by GP type and local health board on StatsWales
The majority of GPs on 30 September 2022 were partners, with a headcount of 1,459 and FTE of 1,133. The GP partner headcount decreased by 1.3% since September 2021, but the FTE has increased slightly since FTE data was first collected in December 2021.
There were 516 salaried GPs (headcount) who were typically contracted to fewer hours than partners, with an FTE of 312. The headcount of salaried GPs has decreased by 8.2% since September 2021 and FTE has also decreased since FTE data was first collected in December 2021.
There were 474 locums, who had contracts recorded on Locum Hub Wales, who worked an equivalent of 86 full-time jobs. While the locum headcount increased by 3.9% since September 2021, the FTE has decreased since FTE data was first collected in December 2021.
Any locum work which was not recorded on Locum Hub Wales will not be accounted for in this data. This may include locum work in health board managed practices.
The number of registrars has increased sharply in recent years. There were 498 registrars with an FTE of 446. The headcount has increased by 16.9% from the same period last year, and by 30.4% from the same period two years ago. As the large majority of registrars are contracted to full-time hours the change over time in the FTE is similar to the headcount.
Data on StatsWales also shows that there were 41 F2 trainees (both headcount and FTE) in September 2022.
Characteristics of fully qualified GPs
This section only includes data on GPs with contracts as a partner, provider, salaried, retainer or locum.
Figure 5: Fully qualified GPs [Note 1] headcount and full-time equivalent (FTE), by sex, 30 September 2022 [Note 2]

Description of Figure 5: Pie charts showing that more fully qualified GPs were female than male when measured by both headcount and FTE.
Source: Wales National Workforce Reporting System, Locum Hub Wales
[Note 1] Data only presented where values of male or female were reported. 118 (or 5%) GPs had their sex recorded as ‘other/unknown’. As we are not able to separate out these two categories, they are not included in the charts or in the denominator in the percentage calculations.
[Note 2] Locums are counted if they had any work recorded through Locum Hub Wales at any point during the quarter ending 30 September 2022 only. For all the other GP types, it is based on the headcount and FTE on 30 September 2022.
Fully qualified GPs (headcount and full-time equivalent) by sex and local health board on StatsWales
Nearly six out of ten (58.0%) of the fully qualified GPs headcount were female; 42.0% were male.
The FTE of fully qualified female GPs was 54.3%, 3.6 percentage points lower than the headcount; for males, the FTE was 45.7%, 3.6 percentage points higher than the headcount. This means that typically male GPs had longer contracted hours than female GPs.
When all contracted hours were summed for each GP, 90.8% of female GPs were part-time (contracted to fewer than 37.5 hours per week), compared to 78.2% of male GPs.
Figure 6: Fully qualified GPs [Note 1] headcount by age [Note 2] and sex, 30 September 2022 [Note 3]

Description of Figure 6: Bar chart showing that there was a higher concentration of younger, female GPs than male; and a higher concentration of older, male GPs than female.
Source: Wales National Workforce Reporting System, Locum Hub Wales
[Note 1] The sex and/or age is not known for 7% of fully qualified GPs. The majority of these are locums and they are excluded from Figure 6.
[Note 2] There were a small number of instances where an individual’s age changed by more than one from quarter-to-quarter prior to 30 September 2022.
[Note 3] Locums are counted if they had any work recorded through Locum Hub Wales at any point during the quarter ending 30 September 2022 only. For all the other GP types, it is based on the headcount and FTE on 30 September 2022.
Fully qualified GPs (headcount) by age band and local health board on StatsWales
Fully qualified GPs (headcount and full-time equivalent) by sex and local health board on StatsWales
The proportion of female GPs was highest in younger age groups but decreased in older age groups.
Of the fully qualified GPs, with a known age and sex, aged up to 49, nearly two thirds (64.3%) were female. In the 50 to 59 age group just over half (53.6%) were female. However, the majority of GPs (70.1%) in the 60 or older age group were male.
6.5% of all GPs with known age and sex were aged 60 to 64, and 3.2% were aged 65 or older.
Figure 7: Fully qualified GPs [Note 1] headcount, by ethnicity, 30 September 2022 [Note 2]

Description of Figure 7: Bar chart showing that the large majority of fully qualified GPs were recorded in white ethnic groups, followed by Asian or Asian British, other ethnic groups, black or black British, and mixed ethnic groups.
Source: Wales National Workforce Reporting System, Locum Hub Wales
[Note 1] The ethnicity was not known for 16% of fully qualified GPs. The majority of these are locums and they are excluded from the denominator in the percentage calculation of the known ethnicity groups.
[Note 2] Locums are counted if they had any work recorded through Locum Hub Wales at any point during the quarter ending 30 September 2022 only. For all the other GP types, it is based on the headcount and FTE on 30 September 2022.
Fully qualified GPs (headcount by ethnicity) on StatsWales
A little more than eight out of ten (or 82.6% of) fully qualified GPs were from a white ethnic background. Asian or Asian British was the largest ethnic group within GPs of minority ethnic background (12.7% of all GPs).
There is greater ethnic diversity among GPs working in Wales than in the general population of Wales. 17.4% of GPs are from Black, Asian or minority ethnic backgrounds, compared to 5.1% of people living in Wales (year ending June 2022, Annual Population Survey (StatsWales)).
Figure 8: Welsh speaking skills of fully qualified GPs [Note 1] (headcount), 30 September 2022 [Note 2]

Description of Figure 8: Pie chart showing that the large majority of fully qualified GPs reported that they had no Welsh speaking skills.
Source: Wales National Workforce Reporting System, Locum Hub Wales
[Note 1] The Welsh speaking skill is not known for 31% of fully qualified GPs. The majority of these are locums and are excluded from the denominator in the percentage calculation of the known Welsh language categories.
[Note 2] Locums are counted if they had any work recorded through Locum Hub Wales at any point during the quarter ending 30 September 2022 only. For all the other GP types, it is based on the headcount and FTE on 30 September 2022.
One in ten (10.7%) fully qualified GPs reported that they had higher or proficient Welsh speaking skills. One in twenty (4.9%) reported entry to intermediate level Welsh speaking skills, while most (84.4%) reported that they had no Welsh speaking skills.
The percentage of GPs who reported that they had any Welsh speaking skills is lower than the Welsh population. The 2021 census (StatsWales) estimates 17.8% of people in Wales were able to speak Welsh, and the Annual Population Survey (StatsWales) estimated that 29.7% of people in Wales had some Welsh speaking skills in June 2022.
Wider practice staff
To deliver primary care services, GPs work closely with other professionals employed in GP practices including nurses, pharmacists, managers, administrators and others involved in direct patient care. This section provides data on the number of staff employed in other job types within GP practices.
As with fully qualified GPs, one FTE is the equivalent to a contract of a 37.5 hours per week. If a member of staff is contracted to more than 37.5 hours, their FTE will be greater than 1.
If a person held multiple contracts at the same or different practices, they would be counted once in the headcount but all contracted hours would be counted in the FTE number.
Figure 9: Number of wider practice staff, headcount and full-time equivalent (FTE) [Note 1], 31 March 2020 to 30 September 2022

Description of Figure 9: Bar chart showing that the longer term trend of an increasing headcount of wider practice staff has plateaued over the last four quarters.
Source: Wales National Workforce Reporting System
[Note 1] FTE data starts from 31 December 2021. A small number of wider practice staff records have no contract or working hours recorded. Therefore, the FTE number will be a slight underestimate.
Comparable headcount data for wider practice staff was first collected in March 2020 and the number of staff had been on an upward trend until June 2021. Since then, the headcount has remained at a similar level, just below 8,000.
On 30 September 2022, there were 7,972 wider practice staff employed in general practices. This was a marginal (0.1%) decrease since the previous quarter (30 June 2022), but a slight increase (0.6%) since the same date last year (30 September 2021).
Comparable FTE data for wider practice staff was first collected in December 2021. There were 5,778 FTE wider practice staff at 30 September 2022, broadly unchanged from the previous 3 quarters. This is equivalent to 72.5% of the headcount doing full-time work and a similar percentage to fully qualified permanent GPs.
Figure 10: Full-time equivalent (FTE) [Note 1] wider practice staff per 10,000 population [Note 2] by local health board, 30 September 2022

Description of Figure 10: Bar chart showing that the FTE of wider practice staff per 10,000 population varied between health boards.
Source: Wales National Workforce Reporting System, ONS mid-year population estimates (2021)
[Note 1] A small number of wider practice staff records have no contract or working hours recorded. Therefore, the FTE number will be a slight underestimate.
[Note 2] Based on the 2021 mid-year population estimates as 2022 data was not available at the time of publication. Data will be revised using the 2022 mid-year population estimates in the next statistical release.
On 30 September 2022, there were 18.6 FTE wider practice staff per 10,000 population in Wales. This ranged by health board from 29.5 in Powys to 15.4 in Cardiff and Vale.
Wider practice staff groups
Wider practice staff can be categorised by their staff group. Data on individual job types within each staff group are published on StatsWales
When an individual has more than one contract within the same staff group, they are counted once in the headcount but all contracted hours are counted in the FTE number.
When an individual has multiple contracts under different staff groups, they will be counted in the headcount for each staff group and their contracted hours will be counted in the FTE numbers for the associated staff group only.
Figure 11: Headcount and full-time equivalent (FTE) [Note 1] by wider practice staff group, 31 March 2020 to 30 September 2022

Description of Figure 11: Line charts showing most wider practice staff groups have a broadly steady trend over the last 6 quarters for both headcount and FTE.
Source: Wales National Workforce Reporting System
[Note 1] FTE data starts from 31 December 2021. A small number of wider practice staff records have no contract or working hours recorded. Therefore, the FTE number will be a slight underestimate.
On 30 September 2022, the three groups of wider practice staff worked a broadly similar proportion of full-time hours, relative to their headcounts.
There were 1,419 nurses who worked the equivalent of 1,023 FTE hours. This is 72.1% of the nurse headcount.
There were slightly fewer direct patient care staff to nurses (1,310). These staff also worked fewer full-time equivalent hours to nurses (920). This is equivalent to 70.3% of their headcount.
The largest staff group were administrative/non-clinical staff, with a headcount of 5,314, just less than double the combined nurse and direct patient care headcount. Administrative staff worked 3,835 full-time equivalent hours, or 72.2% of the headcount.
Characteristics of nurses, direct patient care and administrative/non-clinical staff
Figure 12: Nurses [Note 1] (headcount and full-time equivalent (FTE) [Note 2]), by sex, 30 September 2022
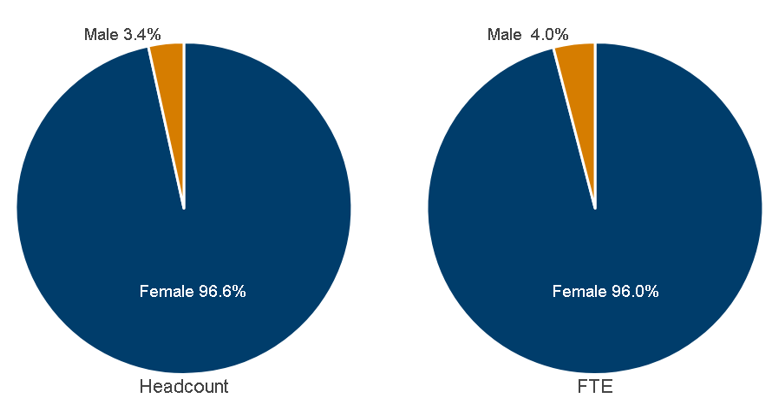
Description of Figure 12: Pie charts showing that the large majority of nurses (both headcount and FTE) were female.
Source: Wales National Workforce Reporting System
[Note 1] Data only presented where values of male or female were reported. 11 (or 1%) nurses had their sex recorded as ‘other/unknown’. As we are not able to separate out these two categories, they are not included in the charts or in the denominator in the percentage calculations.
[Note 2] A small number of wider practice staff records have no contract or working hours recorded. Therefore, the FTE number will be a slight underestimate.
There were 28 times as many female nurses to male nurses employed in general practices on 30 September 2022. The percentage of FTE female staff is slightly smaller than the female headcount, as male nurses typically had longer contracted hours.
Figure 13: Headcount of nurses [Note 1] by age [Note 2] and sex, 30 September 2022

Description of Figure 13: Bar chart showing that the number of female nurses generally increased with age until around 60 years old. The small number of male nurses were distributed across most age groups.
Source: Wales National Workforce Reporting System
[Note 1] The sex is not known for 1% of nurses. These nurses are excluded from Figure 13.
[Note 2] There were a small number of instances where an individual’s age changed by more than one from quarter-to-quarter prior to 30 September 2022.
Wider practice staff (headcount) by age band and local health board on StatsWales
The number of female nurses varies widely by age, with higher concentrations of female nurses in older age groups. Fewer than one in twenty (4.3%) female nurses were 29 or younger; 41.5% were aged between 30 and 49; while over a half (54.2%) were aged 50 or over.
While there were a small number of male nurses, spread across a wide range of ages, there was a slight concentration of male nurses aged between 45 and 54.
14.8% of all nurses with known age and gender were aged 60 to 64, and 4.5% were aged 65 or older. Nearly all nurses aged over 60 were female.
Figure 14: Direct patient care staff [Note 1] (headcount and full-time equivalent (FTE) [Note 2]), by sex, 30 September 2022
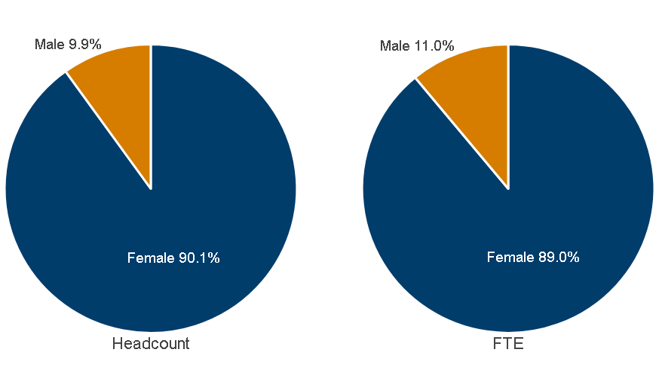
Description of Figure 14: Pie charts showing that female direct patient care staff accounted for most of the total headcount and FTE of this staff group.
Source: Wales National Workforce Reporting System
[Note 1] Data only presented where values of male or female were reported. 1 direct patient care employee had their sex recorded as ‘other/unknown’. As we are not able to separate out these two categories, they are not included in the charts or in the denominator in the percentage calculations.
[Note 2] A small number of wider practice staff records have no contract or working hours recorded. Therefore, the FTE number will be a slight underestimate.
Nine out of ten (90.1%) direct patient care staff were female. The proportion of female FTE was marginally lower than the headcount (1.1 percentage points) as the average number of contracted hours for male direct patient care staff was marginally higher than female staff.
Figure 15: Headcount of direct patient care staff [Note 1] by age [Note 2] and sex, 30 September 2022

Description of Figure 15: Bar chart showing that the age distribution of direct patient care staff is more evenly spread than it is for nurses.
Source: Wales National Workforce Reporting System
[Note 1] The sex is not known for a small proportion (less than 1%) of direct patient care staff. These staff are excluded from figure 15.
[Note 2] There were a small number of instances where an individual’s age changed by more than one from quarter-to-quarter prior to 30 September 2022.
Wider practice staff (headcount) by age band and local health board on StatsWales
While there was a higher concentration of direct patient care staff in older age groups, staff are more evenly spread throughout the age groups than with nursing staff.
For female direct patient care staff, nearly one in ten (9.6%) were aged 29 or younger; 43.3% were aged between 30 and 49; while a little less than half (47.1%) were 50 or older.
Male direct patient care staff had a different age profile than females, with higher concentrations of male staff in younger age groups and notably, four out of ten (39.2%) male staff were aged between 30 and 39.
Figure 16: Administrative/non-clinical staff [Note 1] (headcount and full-time equivalent (FTE) [Note 2]), by sex, 30 September 2022
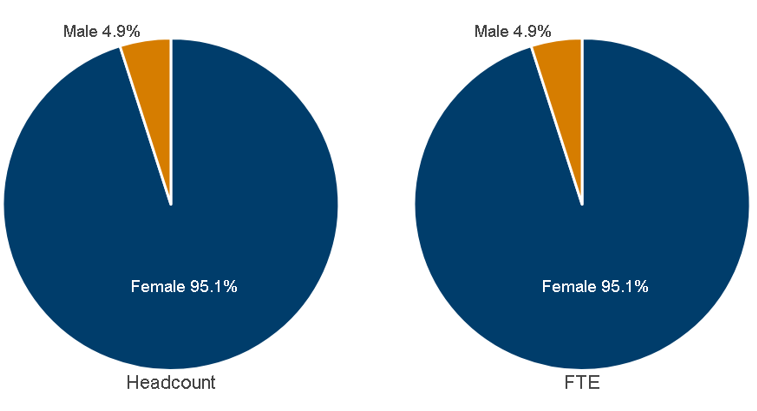
Description of Figure 16: Pie charts showing that female staff accounted for the large majority of the total headcount and FTE for the administrative/non-clinical staff group.
Source: Wales National Workforce Reporting System
[Note 1] Data only presented where values of male or female were reported. 54 (or 1%) administrative staff had their sex recorded as ‘other/unknown’. As we are not able to separate out these two categories, they are not included in the charts or in the denominator in the percentage calculations.
[Note 2] A small number of wider practice staff records have no contract or working hours recorded. Therefore, the FTE number will be a slight underestimate.
Nineteen out of twenty (95.1%) administrative or non-clinical staff in general practice were female. The proportion of female FTE was almost the same as the headcount, as there was little difference between the average contracted hours between male and female administrative/non-clinical staff.
Figure 17: Headcount of administrative/non-clinical staff [Note 1] by age [Note 2] and sex, 30 September 2022

Description of Figure 17: Bar chart showing that the age distribution of administrative/non-clinical staff was spread over all age groups but with a higher concentration of staff aged 50 or over for females.
Source: Wales National Workforce Reporting System
[Note 1] The sex is not known for 1% of administrative/non-clinical staff. These staff are excluded from Figure 17.
[Note 2] There were a small number of instances where an individual’s age changed by more than one from quarter-to-quarter prior to 30 September 2022.
Wider practice staff (headcount) by age band and local health board on StatsWales
More than half (55.1%) of female administrative staff were aged 50 or over. The relatively few male staff were spread more evenly, with just under three out of ten (28.5%) aged 29 or younger.
Figure 18: Wider practice staff [Note 1] headcount by ethnicity, 30 September 2022

Description of Figure 18: Bar chart showing that the large majority of wider practice staff were recorded in white ethnic groups with less than 3% of all staff groups from all other ethnic groups combined.
Source: Wales National Workforce Reporting System
[Note 1] The ethnicity is not known for 11% of nurses, 10% of direct patient staff and 9% of administrative staff. These staff are excluded from the denominator in the percentage calculation of the known ethnicity groups.
Wider practice staff (headcount) by ethnicity (StatsWales)
Over 98% of nurses were from a white ethnic group. Of those from minority ethnic background, most were from an Asian or Asian British ethnic background (0.9%).
Over 97% of direct patient care staff were from a white ethnic background. Of those from a minority ethnic background, most were from an Asian or Asian British background (1.2%).
Nearly 98% of administrative/non-clinical staff were from a white ethnic group. Of those from a minority ethnic background, most were from an Asian or Asian British background (1.1%).
All wider staff groups had a lower percentage of people from Black, Asian or minority ethnic backgrounds than the general population of Wales (5.1% year ending June 2022, Annual Population Survey (StatsWales)).
Figure 19: Wider practice staff [Note 1] headcount, by Welsh speaking skills, 30 September 2022

Description of Figure 19: Bar chart showing that some staff had varying degrees of Welsh language speaking skill, but the large majority reported that they had no Welsh speaking skills.
Source: Wales National Workforce Reporting System
[Note 1] The Welsh speaking skill was not known for 38% of nurses, 36% of direct patient staff and 38% of administrative staff. These staff are excluded from the denominator in the percentage calculation of the known Welsh language categories.
One in ten (or 10.8% of) nurses were either recorded as having a high or proficient Welsh speaking skills. A further 6.9% reported skills between entry and intermediate level, while 82.4% reported having no Welsh speaking skills.
A greater proportion of direct patient care staff were recorded as having any Welsh speaking skills than any other staff group. 11.3% of staff had higher or proficient skills, and 6.6% had entry to intermediate level skills. 82.1% of staff reported that they had no Welsh speaking skills.
Fewer than one in fourteen (6.8%) administrative or non-clinical staff were recorded as having a high or proficient Welsh speaking skills. A further 6.9% reported skills between entry and intermediate level, while 86.2% reported that they had no Welsh speaking skills.
The percentage of wider practice staff who reported that they had any Welsh speaking skills is lower than the Welsh population. The 2021 census (StatsWales) estimates 17.8% of people in Wales were able to speak Welsh, and the Annual Population Survey (StatsWales) as at June 2022 estimates 29.7% of people in Wales had some Welsh speaking skills.
Workforce joiners and leavers
This section includes data on fully qualified GPs and wider practice staff who have left or joined the workforce since the same quarter the previous year.
A member of staff is defined as having joined the workforce during this time if they were contracted to work in general practice in September 2022 but not contracted to work in September 2021.
A member of staff is defined as having left the workforce during this time if they were contracted to work in general practice in September 2021 but not contracted to work in September 2022.
Figure 20: General practice staff [Note 1] workforce joiners and leavers between 30 September 2021 and 30 September 2022 [Note 2] [Note 3], by staff group

Description of Figure 20: Bar chart showing there were more joiners than leavers in the nursing and direct patient staff groups, but more leavers than joiners in the fully qualified GP and admin groups. There were more joiners and leavers in the admin staff group than all three other staff groups combined.
Source: Wales National Workforce Reporting System, Locum Hub Wales
[Note 1] Locums are counted in the relevant time periods if they had any work recorded through Locum Hub Wales at any point during the quarter ending in the snapshot date (30 September 2022 or 30 September 2021) only. For all the other GP types and wider practice staff, it is based on the headcount at the snapshot date.
[Note 2] This chart will not capture cases in which a member of staff joined after 30 September 2021 and left before 30 September 2022.
[Note 3] The difference between the number of staff joining and leaving equals the change in the number of staff working between 30 September 2021 and 30 September 2022.
Number (headcount) of GPs who left or joined by GP type, sex and age band on StatsWales
A total of 162 fully qualified GPs joined the workforce during this time period while there were 192 fully qualified GPs that left.
Of the 162 fully qualified GPs that joined, 95 (or 58.6%) joined exclusively as a locum and of the 192 fully qualified GPs that left, 80 (or 41.7%) left exclusively as a locum.
For all wider practice staff in total, there were 1,003 joiners to the workforce and 953 leavers. This figure is not equal to the sum of the counts from the nurses, direct patient care and administrative/non-clinical sub-groups as some staff moved between different types of roles during this time while remaining in the workforce as a whole.
Figure 21: Fully qualified GP [Note 1] workforce joiners and leavers between 30 September 2021 and 30 September 2022 [Note 2, Note 3], by sex
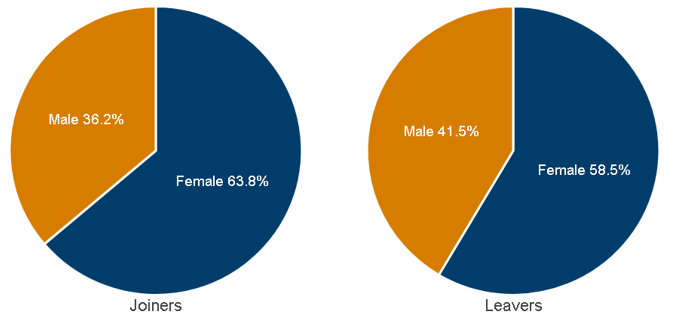
Description of Figure 21: Pie charts showing more females joined the workforce in September 2022 than males. More females also left the workforce in the year to September 2022 than males.
Source: Wales National Workforce Reporting System, Locum Hub Wales
[Note 1] Data only presented where values of male or female were reported. 32 (or 20%) of joiners had their sex recorded as ‘other/unknown’ and 33 (or 17%) of leavers had no stated sex. They are not included in the charts or in the denominator in the percentage calculations.
[Note 2] Locums are counted in the relevant time periods if they had any work recorded through Locum Hub Wales at any point during the quarter ending in the snapshot date (30 September 2022 or 30 September 2021) only. For all the other GP types, it is based on the headcount at the snapshot date.
[Note 3] These charts will not capture cases in which a GP joined after 30 September 2021 and left before 30 September 2022.
Number (headcount) of GPs who left or joined by GP type, sex and age band on StatsWales
While more female GPs left general practice than males between September 2021 and September 2022, female GPs joined at a higher rate which resulted in the percentage of female fully qualified GPs increasing during the year.
Nearly two thirds (63.8%) of fully qualified GPs that joined the workforce were female.
More females also left Welsh general practices in the year than males; just fewer than 6 out of every 10 (58.5%) leavers were female. The proportion of male and female GPs leaving was nearly the same as the proportion of male and female GPs working in general practice in September 2022, indicating that males and females left at similar rates.
Figure 22: Fully qualified GP [Note 1] workforce joiners and leavers between 30 September 2021 and 30 September 2022 [Note 2, Note 3], by age group

Description of Figure 22: Bar chart showing that fully qualified GPs who joined the workforce tended to be younger than those who left.
Source: Wales National Workforce Reporting System, Locum Hub Wales
[Note 1] The age was not known for 28% of fully qualified GPs that joined the workforce and 17% of fully qualified GPs that left the workforce. These GPs are excluded from this chart and the denominator in any percentage calculations of male and female.
[Note 2] Locums are counted in the relevant time periods if they had any work recorded through Locum Hub Wales at any point during the quarter ending in the snapshot date (30 September 2022 or 30 September 2021) only. For all the other GP types, it is based on the headcount at the snapshot date.
[Note 3] This chart will not capture cases in which a GP joined after 30 September 2021 and left before 30 September 2022.
Number (headcount) of GPs who left or joined by GP type, sex and age band on StatsWales
The majority (60.7%) of fully qualified GPs that joined the workforce in the most recent year were aged between 30 to 39. The number of joiners decreased in each subsequent age group.
Leavers were more evenly distributed across age groups with the most common band being 50 to 59 (34%). Nearly a quarter of leavers were aged between 30 and 39 (23.9%); a larger percentage than both the 40 to 49 and 60 to 69 age groups (both 18.2%).
Figure 23: Wider practice staff [Note 1] workforce joiners and leavers between 30 September 2021 and 30 September 2022 [Note 2], by sex
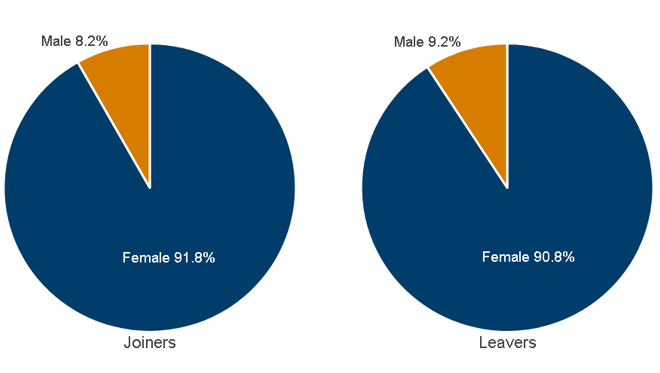
Description of Figure 23: Pie charts showing that the large majority of wider practice joining the workforce were female. A similarly large proportion of staff leaving the workforce were also females.
Source: Wales National Workforce Reporting System
[Note 1] The sex was not known for less than 1% of wider practice staff that joined the workforce and 1% of wider practice staff that left the workforce. These are excluded from this chart and the denominator in any percentage calculations of male and female.
[Note 2] These charts will not capture cases in which a member of wider practice staff both joined and left the workforce in the time between 30 September 2021 and 30 September 2022.
Just greater than nine in ten (91.8%) wider practice staff that joined the workforce were female. Similarly, nine in ten (90.8%) who left the workforce were female.
The percentage of both female joiners and leavers is slightly lower than the percentage of all wider practice female staff (94.5%) employed in general practice on the 30 September 2022.
Figure 24: Wider practice staff workforce joiners and leavers between 30 September 2021 and 30 September 2022 [Note 1], by age group

Description of Figure 24: Bar chart showing that wider practice staff who joined the workforce tended to be younger than those who left, although the age distribution for both groups was more evenly spread compared to fully qualified GPs.
Source: Wales National Workforce Reporting System,
[Note 1] This chart will not capture cases in which a wider practice staff member joined after 30 September 2021 and left before 30 September 2022.
A quarter (25.1%) of the wider practice staff that joined the workforce were aged under 30. This percentage decreased modestly through older age groups, with another quarter (24.6%) of joiners aged 30 to 39; a fifth (21.3%) aged between 40 and 49; and another fifth (21.3%) aged between 50 to 59.
Leavers from the wider practice staff were also relatively evenly distributed between age groups, with the highest percentages in the 50 to 59 age group (22.9%) and in the 60 to 69 age group (21.3%).
Cross-border patient flows
This section gives information on the number of patients that are registered to GP practices in Wales while living in England, and on patients who are registered to GP practices in England while living in Wales.
Figure 25: Cross-border patient flows, January 2020 to January 2023

Description of Figure 25: Bar chart showing that both the number of patients living in England that are registered to practices in Wales, and the number of patients living in Wales that are registered to practices in England have largely remained unchanged since January 2020.
Source: NHS Wales Shared Services Partnership
[Note 1] No data was available for April 2022.
As of January 2023, there were 21,391 patients registered to GP practices in Wales that were living in England. 13,488 patients were registered to GP practices in England while living in Wales. Both of these figures have seen little change since these data were first recorded in January 2020.
Quality and methodology information
Detailed information about the statistics in this release will be published in a quality report in due course.
Glossary of terms
General practice
General practices provide primary care medical services on behalf of the local health board, with at least one qualified general medical practitioner who is able to prescribe medicine and where patients can be registered and held on a list. For the purpose of this release the term general practice refers to main surgeries only and excludes prisons, army bases, education establishments, specialist care centres and walk in centres.
Fully qualified GPs
Includes partners, providers, salaried, retainers and locums GPs only. These are fully qualified GPs registered on the Wales Medical Performers List, but some (retainers in particular) will have contracts with reduced hours and some (locums) will be temporarily contracted to work. Locums are only counted where they were active in the quarter and had sessions recorded through Locum Hub Wales. Therefore any locum who is registered on the All Wales Locum Register, but did not have any sessions recorded in the quarter, will not be counted in the headcounts or FTE.
Fully qualified permanent GPs: includes partners, providers, salaried and retainers only. These are fully qualified GPs with permanent contracts.
GP practitioner
Includes partners, providers and salaried GPs only (i.e. excludes GP locums, GP registrars, and GP retainers). These make up the large majority of the workforce and has historically been the most stable measure of the GP workforce. Retainers are excluded because they are a small number of GPs who work on specific contracts with reduced hours.
GP partner or provider
Practitioners who have entered into a contract with a local health board to provide services to patients. These are typically the most senior GPs at a practice. Specifically, GP provider is either a sole practitioner; a partner in a partnership and that partnership is the contractor; or a shareholder in a company limited by shares and that company is the contractor.
Salaried GPs
GPs who are generally employed and remunerated by salary through the general practice. Salaried GPs can also be employed by health boards directly to work in health board managed practices.
GP retainer
A registered GP practitioner who has entered the GP Retainer Scheme. This is designed to help keep doctors working in general practice, and usually applies to GPs who are either approaching retirement or who require greater flexibility in their work in general practice. A retainer may only work up to 4 clinical sessions per week in practice.
Locum GP
A GP who deputises temporarily at a practice, usually to cover for an absent GP practitioner. In this stats release, locums are only counted if they have actively worked in the quarter and the sessions were recorded through Locum Hub Wales. Any locum who is registered to work in Wales but did not provide any sessions in the quarter is not counted in the headcount or FTE.
Locum Hub Wales
A service that enables GP Practices across Wales to advertise their short-term vacancies, and choose and book a GP locum, whose preferences match those of the practice, quickly and efficiently. Locums are not required to book shifts through Locum Hub Wales if they do not wish to do so. However, GP locums must join the All Wales Locum Register (hosted on Locum Hub Wales) and must record details of their shifts worked on in order to be captured by The Scheme for General Medical Practice Indemnity (GMPI) from 1 February 2021.
The Scheme for General Medical Practice Indemnity (GMPI), is managed by NHS Wales Shared Services Partnership Legal and Risk Services as part of the Clinical Negligence Scheme for NHS Trusts and Local Health Boards (Administration) (Wales) Directions 2019 and The National Health Service (Clinical Negligence Scheme) (Wales) Regulations 2019.
GP registrar
Sometimes called a GP trainee, are qualified doctors who are training to become a GP through a period of training in general practice and hospitals. Historically, in Wales the training programme consisted of 18 months in approved hospital posts and 18 months in general practice; however from 2019 the training programme changed to 12 months in hospital posts and 24 months in general practice. This explains some of the increase in registrar numbers since 2019. A standard contract for a registrar is for 40 hours per week (rather than 37.5 hours), therefore their FTE is based on a 40 hour week.
F2 doctors
Doctors with a full GMC registration in their second year of postgraduate medical training. They have completed their first foundation year and will be rotating through three specialties. They would typically undertake clinical work under supervision but they are not training to be a GP. A standard contract for an F2 doctor is for 40 hours per week (rather than 37.5 hours), therefore their FTE is based on a 40 hour week.
A partnership
A financial arrangement between two or more bodies of which one must be a general practitioner.
General Medical Services (GMS)
The contract by which all general practices in Wales provide services on behalf of the local health board.
Wider practice staff
Include all non-GP staff employed through a contract with a general practice. There are 3 wider practice staff categories: nurses, direct patient care and administrative/non-clinical staff.
Nurses
Includes practice nurse, advanced nurse practitioner, nurse specialist, extended role practice nurse, nursing partner, trainee nurse and nurse dispenser.
Direct patient care
Typically includes anyone who is directly involved in delivering patient care but who is not a nurse or GP. This includes: health care assistant, dispenser, pharmacy technician, paramedic, occupational therapist, pharmacist, phlebotomist, counsellor, physiotherapist, physician associate, apprentice health care assistant, other therapist, counsellor therapist, apprentice phlebotomist, dietician, health support worker, psychological wellbeing practitioner, social prescribing link worker and other direct patient care.
Administrative/non-clinical
Anyone who is involved in the administration or organisation of the practice. This includes: management partner, receptionist, apprentice, manager, medical secretary, telephonist, estates and ancillary, senior manager, finance director and other admin.
Future plans
From this release onwards, the annual statistical release will be based on the data collected in September of the reference year and published in the early part of the following year. There will continue to be quarterly updates to the high level staff numbers on StatsWales. This will include at least headcounts and FTE of GPs and wider practice staff.
Well-being of Future Generations Act (WFG)
The Well-being of Future Generations Act 2015 is about improving the social, economic, environmental and cultural wellbeing of Wales. The Act puts in place seven wellbeing goals for Wales. These are for a more equal, prosperous, resilient, healthier and globally responsible Wales, with cohesive communities and a vibrant culture and thriving Welsh language. Under section (10)(1) of the Act, the Welsh Ministers must (a) publish indicators (“national indicators”) that must be applied for the purpose of measuring progress towards the achievement of the wellbeing goals, and (b) lay a copy of the national indicators before Senedd Cymru. Under section 10(8) of the Well-being of Future Generations Act, where the Welsh Ministers revise the national indicators, they must as soon as reasonably practicable (a) publish the indicators as revised and (b) lay a copy of them before the Senedd. These national indicators were laid before the Senedd in 2021. The indicators laid on 14 December 2021 replace the set laid on 16 March 2016.
Information on the indicators, along with narratives for each of the wellbeing goals and associated technical information is available in the Wellbeing of Wales report.
Further information on the Well-being of Future Generations (Wales) Act 2015.
The statistics included in this release could also provide supporting narrative to the national indicators and be used by public services boards in relation to their local wellbeing assessments and local wellbeing plans.