
Labour market overview: September 2026
Monthly data on employment, unemployment and economic inactivity.
In this page
Background
Quality of the Labour Force Survey (LFS)
The latest updates from the Office for National Statistics (ONS) on the quality of the Labour Force Survey and the planned improvements for economic statistics outline the actions taken by ONS to improve the quality of labour market statistics. For further information on the interventions ONS have made and our advice on using these statistics for Wales, please see the quality and methodology information section and the Chief Statistician’s update: measuring the labour market in Wales.
Users should note the increased uncertainty around estimates derived from the APS due to a reduction in sample sizes and estimates not being weighted to latest population estimates. At a national level, estimates continue to provide a reasonable indication of trends for Wales, particularly if used as part of a basket of indicators with alternative sources such as HMRC real time information on paid employees, data on workforce jobs, and the claimant count. Estimates for smaller geographies or population sub-groups, however, are less reliable.
The LFS is the primary source for estimates of employment, unemployment and economic inactivity in the UK, whereas HMRC PAYE RTI data currently provides the most reliable measure of employees. For Wales, the APS provides a more robust estimate of the labour market due to the larger sample size.
Main points
- Early estimates from HMRC show that there were 1.31 million paid employees in Wales in August 2026, a decrease of 300 (0.0% to 1 decimal place) over the month and a decrease of 7,300 (0.6%) over the year.
- The claimant count rate was 4.3% in August 2026, up 0.2 percentage points over the year.
- Latest LFS estimates for Wales for the 3 months to July 2026 show an increase in employment and a decrease in unemployment rates and economic inactivity rates over the year.
- There were no statistically significant changes for the LFS headline labour market indicators, suggesting that the observed changes in these indicators are unlikely to reflect real changes in the underlying population.
Figure 1: employment rate, 3 months to July 1999 to the 3 months to July 2026 [Note 1]
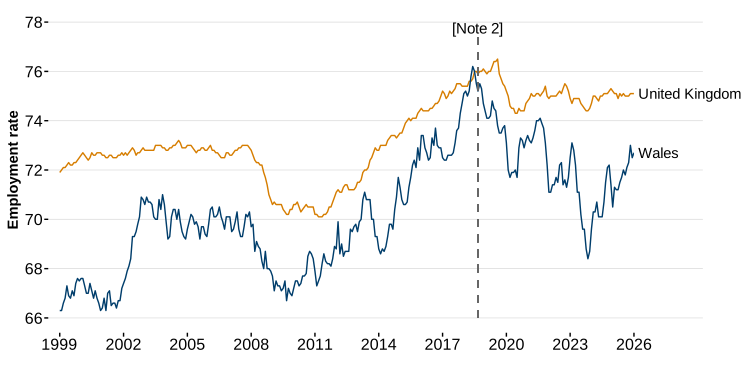
Description of figure 1: a line chart showing the employment rate in Wales and the UK from 1999 onwards. During this time period, the employment rate has generally remained lower than the UK. Both the rates in Wales and the UK have increased overall since 1999.
[Note 1]: the y axis does not start at zero.
[Note 2]: data for the period January to March 2019 onwards are not comparable with previous periods due to a discontinuity in the time series following a reweighting of the data.
Source: LFS, ONS
Employment and jobs
Main points
- The employment rate was 72.7% (approximately 1.52 million) in May to July 2026; up 0.5 percentage points on the previous quarter and up 2.2 percentage points on the year. (LFS, ONS).
- According to the APS, the employment rate was 72.1% in the year ending March 2026, down 1.3 percentage points on the previous year. (APS, ONS).
- Early estimates for August 2026 indicate that there were 1.31 million paid employees, a decrease of 300 (0.0% to 1 decimal place) over the month and a decrease of 7,300 (0.6%) over the year. (Pay As You Earn Real Time Information, HMRC).
- There were 334,000 people employed in the public sector in June 2026, an increase of 3,000 (0.9%) from a year earlier. (Regional Public Sector Employment, ONS).
- The number of workforce jobs in June 2026 was 1.49 million, an increase of 21,100 (1.4%) over the year. (Workforce Jobs, ONS).
Employment
Employment measures those aged 16 and over who:
- did at least one hour of paid work in the reference week (whether as an employee or self-employed)
- had a paid job that they were temporarily away from
- are on government-supported training and employee programmes
- are doing unpaid family work
The employment rate measures the number of employed people aged 16 to 64 as a proportion of the total 16 to 64 population.
Estimates based on the LFS and APS are designated as official statistics.
Labour Force Survey
The employment rate began to fall in early 2020 as a result of the coronavirus (COVID-19) pandemic but returned to pre-pandemic levels in early 2021. Following a period in 2021 when the employment rate was broadly stable it has been volatile since.
Figure 2: employment rate, 3 months to July 2016 to the 3 months to July 2026 [Note 1]
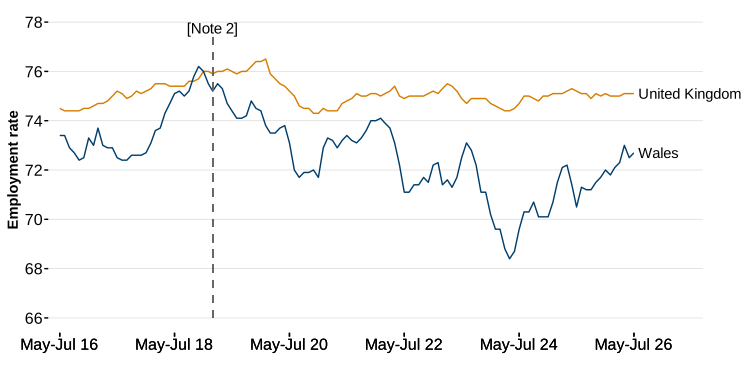
Description of figure 2: a line chart showing the fluctuating employment rates in both Wales and the UK over the last 10 years, with the UK generally having a higher employment rate than Wales. The Welsh rate has seen an overall increase since the end of 2024 however the series has been volatile since 2020.
[Note 1]: the y axis does not start at zero.
[Note 2]: data for the period January to March 2019 onwards are not comparable with previous periods due to a discontinuity in the time series following a reweighting of the data.
Source: LFS, ONS
Employment rate for people aged 16 to 64 on StatsWales
There were 1.52 million people in employment in May to July 2026, up 67,600 (4.6%) from the same period a year earlier. This is a rate of 72.7% of those aged 16 to 64, which is up 0.5 percentage points on the previous quarter and up 2.2 percentage points on the previous year.
Over the year, the employment level in the UK increased by 242,600 (0.7%) to 34.5 million. This is a rate of 75.1% of those aged 16 to 64, which is 2.3 percentage points higher than the employment rate for Wales. The trend in employment rates have differed between Wales and the UK in recent periods, however the changes for Wales are not statistically significant and should be considered alongside the longer-term trend.
Annual Population Survey
According to the APS, there were 1.46 million employed people aged 16 and over in the year ending March 2026. This is an employment rate of 72.1% of those aged 16 to 64, down 1.3 percentage points on the previous year. The UK rate was 75.4%, which is unchanged over the year. For further information on APS labour market estimates please see our Labour market statistics (Annual Population Survey) release.
Paid employees
HMRC’s Pay As You Earn (PAYE) Real Time Information (RTI) data covers the whole population rather than a sample of people or companies, allowing for more detailed and robust estimates of paid employees. PAYE RTI covers employees payrolled by employers only. It does not cover self-employment income or income from other sources such as pensions, property rental and investments. Where individuals have multiple sources of income, only income from employers is included.
Estimates based on this data source are designated as accredited official statistics.
The ONS and HMRC publish data for Wales on payrolled employees, mean pay, aggregate pay and single month estimates for median pay (ONS).
Figure 3: paid employees, Wales, August 2021 to August 2026 [Note 1]
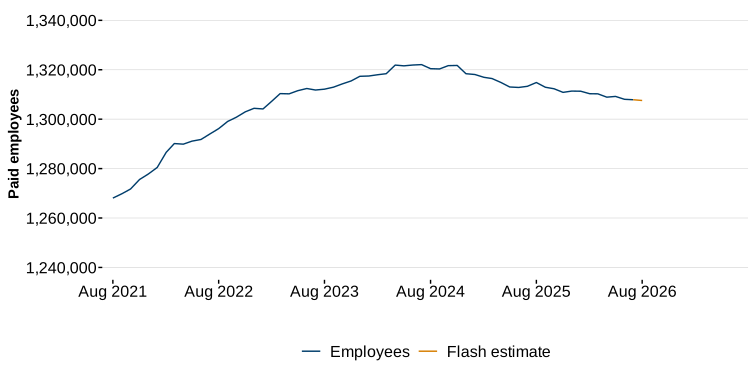
Description of figure 3: a line chart showing the number of paid employees has decreased over the last 2 years following a steady increase since 2021.
[Note 1]: the y axis does not start at zero.
Source: Pay As You Earn Real Time Information, HMRC.
The number of paid employees has seen an overall increase since early 2021. Early estimates for August 2026 indicate that there were 1.31 million paid employees, a decrease of 300 (0.0% to 1 decimal place) over the month and a decrease of 7,300 (0.6%) over the year.
At the UK level, early estimates for August 2026 showed a decrease of 26,100 (0.1%) over the month and a decrease of 144,800 (0.5%) over the year.
HMRC also publish updates on the number of employees in Wales by local authority, age and industry (ONS) on a rolling monthly basis. Latest published data shows:
In August 2026, none of the 22 Welsh local authority areas saw an increase in the number of paid employees when compared with the same month in the previous year. The largest decreases were in:
- Swansea (-1.2%)
- Merthyr Tydfil (-0.8%)
- Conwy (-0.8%)
In July 2026, the energy production and supply sector had the largest increase in the number of paid employees when compared to the previous year, increasing by 4.3%. The largest decrease over the same period was in the households and extraterritorial sector, decreasing by 4.0%.
In June 2026, the age groups: under 18, 25 to 34 and 50 to 64 all experienced decreases in the number of paid employees (10.1%, 2.0% and 0.9% respectively) when compared to the previous year. The age groups: 18 to 24, 35 to 49, and over 65 all experienced increases over the same period (0.4%, 1.3% and 5.8% respectively), with the 65 and over age group having the largest percentage increase.
Workforce jobs
Workforce Jobs measures the number of jobs by region and industry and is the sum of employee jobs from employer surveys, self-employment jobs from the LFS, those in HM Forces and government supported trainees. This differs from the number of people with jobs (as measured by the LFS and APS) as a person can have more than one job.
Estimates based on this data source are designated as accredited official statistics.
Figure 4: workforce jobs (Index June 2016=100), June 2016 to June 2026 [Note 1]
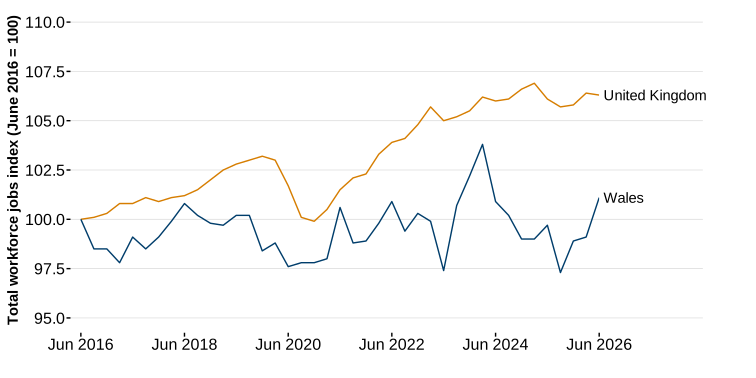
Description of figure 4: a line chart showing that the number of workforce jobs in Wales has been volatile over the last 10 years. However, these have slightly increased overall since June 2016. The number of workforce jobs has increased in the UK over the same period.
[Note 1]: the y axis does not start at zero.
Source: Workforce Jobs, ONS
The number of workforce jobs in June 2026 was 1.49 million, an increase of 21,100 (1.4%) over the year. The number of workforce jobs in the UK increased over the year by 60,500 (0.2%) to 36.7 million.
The number of self-employment jobs in June 2026 was 190,300, an increase of 11,400 (6.4%) over the year. However, it is important to note the volatility of this series. The estimate of the number of self-employment jobs in the UK in June 2026 was 4.18 million, down 9,900 (0.2%) over the year.
In June 2026, human health and social work activities accounted for 17.2% of workforce jobs, the highest of any industry. This was followed by wholesale and retail trade with 12.9% of workforce jobs.
Unemployment
Main points
- The unemployment rate was 4.3% (approximately 68,400 people) in May to July 2026; up 0.3 percentage points on the quarter and down 0.6 percentage points on the year (LFS, ONS).
- According to the APS, the unemployment rate was 4.3% in the year ending March 2026, an increase of 0.8 percentage points compared with the previous year. (APS, ONS).
- The claimant count rate was 4.3% in August 2026, up 0.2 percentage points over the year. (Claimant Count, ONS).
Unemployment
Unemployment measures the number of people aged 16 and over who are out of work and:
- have actively sought work in the last 4 weeks and are available to start work in the next 2 weeks
- have found a job and are waiting to start it in the next 2 weeks
This definition is consistent with the internationally agreed definition recommended by the International Labour Organisation (ILO), an agency of the United Nations.
The unemployment rate measures the number of unemployed people aged 16 and over as a proportion of the total number of economically active people aged 16 and over.
Estimates based on the LFS and APS are designated as official statistics.
Labour Force Survey
Historically the Welsh unemployment rate has generally tracked the UK rate and had been gradually falling since the early 2010s, before rising sharply as a result of the COVID-19 pandemic. In August to October 2019, the Welsh unemployment rate fell below the UK rate and remained below until March to May 2022. Since then, the Wales rate has fluctuated around the UK rate, despite volatility in the data.
Please note in recent years the data presented for the number of those unemployed and the unemployment rate have shown particularly high volatility. This is because the number of unemployed people, as well as the sample sizes, have dropped. Due to this volatility, short-term changes should be considered alongside longer-term trends where possible.
Figure 5: ILO unemployment rate, 3 months to July 2016 to the 3 months to July 2026 [Note 1]
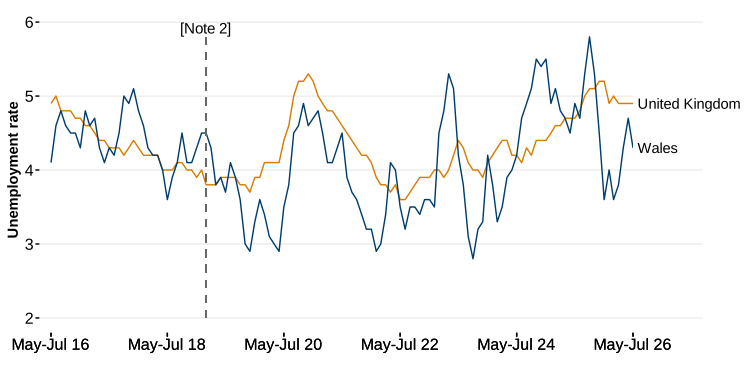
Description of figure 5: a line chart showing that the unemployment rate in both Wales and the UK have shown similar movements, however the unemployment rate has fluctuated more than the UK rate.
[Note 1]: the y axis does not start at zero.
[Note 2]: data for the period January to March 2019 onwards are not comparable with previous periods due to a discontinuity in the time series following a reweighting of the data.
Source: LFS, ONS
Unemployment rate for people aged 16 and over on StatsWales
During May to July 2026 there were 68,400 unemployed people. This is a rate of 4.3% of the economically active population, up 0.3 percentage points compared to the previous quarter and down 0.6 percentage points compared to a year earlier. Short term changes in the unemployment rate should be considered alongside longer-term trends where possible due to the volatility of the series.
There were 1.78 million unemployed people in the UK in May to July 2026. This is a rate of 4.9%, an increase of 0.2 percentage points compared to the previous year.
Annual Population Survey
According to the APS, there were 66,000 unemployed people aged 16 and over in the year ending March 2026. This is an unemployment rate of 4.3% of the economically active population, an increase of 0.8 percentage points compared with the previous year. The UK rate was 4.4%, an increase of 0.6 percentage points over the year. For further information on APS labour market estimates please see our Labour market statistics (Annual Population Survey) release.
Claimant count
The claimant count measures the number of people claiming unemployment-related benefits.
The claimant count rate is the number of claimants resident in an area as a percentage of the sum of claimants and workforce jobs in the country or region.
Estimates based on this data source are designated as official statistics in development.
Figure 6: claimant count, August 2021 to August 2026 [Note 1]
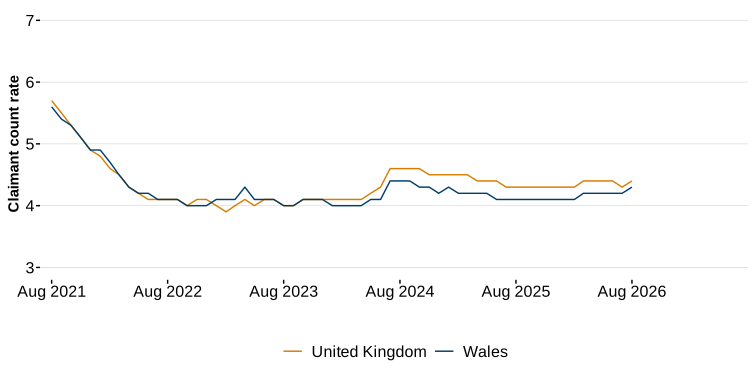
Description of figure 6: a line chart showing the claimant count rate for Wales and the UK over the past 5 years. The claimant count rate decreased in 2021 and 2022 for both Wales and the UK, followed by a slight increase in 2024 after a period of stability. Since then, the rates in both Wales and the UK have been relatively stable, with Wales showing an overall decrease over this time period.
[Note 1]: the y axis does not start at zero.
Source: Claimant Count, ONS
Claimant count rate for Wales and the UK on StatsWales
In August 2026 the claimant count was 65,500, up 1,300 (2.0%) compared to the previous month and up 2,800 (4.5%) over the year. This is a claimant count rate of 4.3%, up 0.1 percentage points compared to the previous month and up 0.2 percentage points compared to the previous year. The claimant count rate in the UK was 4.4% in August 2026.
Economic inactivity
Main points
- The economic inactivity rate was 23.8% (approximately 465,800 people) in May to July 2026; this is down 0.9 percentage points on the quarter and down 1.9 percentage points on the year. (LFS, ONS).
- According to the APS, the economic inactivity rate was 24.5% in the year ending March 2026, up 0.6 percentage points over the year. (APS, ONS).
Economic inactivity
Economic inactivity measures those without a job who:
- have not actively sought work in the last 4 weeks
- not available to start work in the next 2 weeks
The economic inactivity rate measures the number of inactive people aged 16 to 64 as a proportion of the total 16 to 64 population.
Estimates based on the LFS and APS are designated as official statistics.
Labour Force Survey
Inactivity rates in Wales have been persistently higher than the UK for decades but fell steeply to below the UK rate at the end of 2018. The rate generally rose until mid-2020 and then decreased as it corresponded with opposite movements in the employment rate. Since 2022, the economic inactivity rate has become increasingly volatile, with large changes in the series being seen over recent years.
Figure 7: economic inactivity rate, 3 months to July 2016 to the 3 months to July 2026 [Note 1]
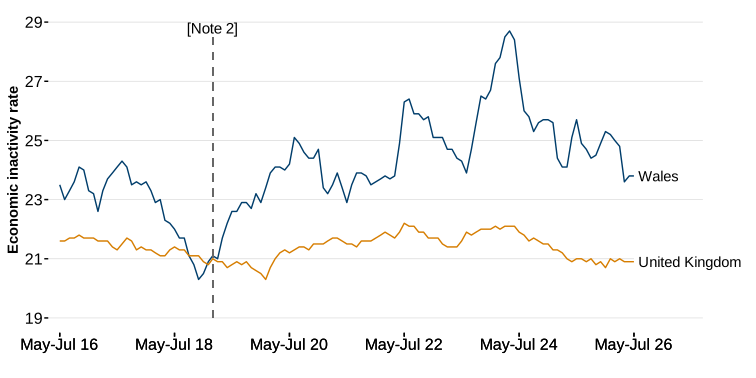
Description of figure 7: a line chart showing over the past 10 years inactivity rates in Wales have been more volatile than in the UK, with the rate remaining higher than the UK since December to February 2019.
[Note 1]: the y axis does not start at zero.
[Note 2]: data for the period January to March 2019 onwards are not comparable with previous periods due to a discontinuity in the time series following a reweighting of the data.
Source: LFS, ONS
Economic inactivity rate for people aged 16 to 64 on StatsWales
There were 465,800 people who were economically inactive in May to July 2026, down 34,800 (7.0%) from the same period a year earlier. This is a rate of 23.8% of those aged 16 to 64, down 0.9 percentage points over the quarter and down 1.9 percentage points compared to the same period a year earlier. The number of economically inactive people in the UK increased by 11,600 (0.1%) over the year to 9.12 million. This is a rate of 20.9% of those aged 16 to 64, down 0.1 percentage points from the previous year.
Annual Population Survey
According to the APS, there were 474,900 economically inactive people aged 16 to 64 in the year ending March 2026. This is an economic inactivity rate of 24.5% of those aged 16 to 64, up 0.6 percentage points over the year. The UK rate was 21.0%, down 0.6 percentage points over the year. For further information on APS labour market estimates please see our Labour market statistics (Annual Population Survey) release.
Quality and methodology information
This section presents the main quality and methodology information that is relevant to this version of the report. Further information on the quality and methodology is available in the accompanying labour market overview: quality and methodology report.
Changes to this publication
We recently consulted on the content of this publication. There was broad support for reducing the level of detail included in this bulletin whilst still reporting on the main points for relevant data sources. The changes made include:
Removing sections covering:
- the number of hours worked
- online job adverts
- Universal Credit
Reducing the level of detail on:
- APS labour market statistics
- public sector employment
- workforce jobs
Publishing a separate quality information report to reduce the size of the quality section included within this report.
We continue to signpost to data available on the removed and reduced sections within the quality and methodology report published alongside this release. For further information please see the response to the consultation on proposed changes to Welsh Government statistics outputs.
Relevance
These statistics are used by the Welsh Government to monitor the headline statistics for the Welsh labour market as well as providing comparisons to the UK. This release complements the Welsh Economy in Numbers dashboard, which provides a broad picture of the Welsh economy.
The LFS remains the primary source for headline labour market indicators at a Wales level, however the larger sample of the APS allows for more robust and detailed estimates. Additional labour market information from the APS is available in the quarterly Labour market statistics (APS) publication and provides labour market data by:
- Welsh economic regions
- local authority
- age
- sex
- disability
- ethnicity
- long-term unemployment
Given the current challenges with maintaining the quality of LFS and APS estimates, ONS are introducing a new Transformed Labour Force Survey (TLFS). This is planned to become the main data source for information on the labour market in the UK and Wales in the future. In their latest update (Labour market transformation – update on progress and plans: August 2026 (ONS)) and accompanying blog post (The road ahead for the Transformed Labour Force Survey (ONS)), ONS announced that following feedback from users, the transition to the TLFS has been deferred until later in 2027. November 2027 has been identified as the expected transition date. In the meantime, ONS will continue to use the LFS as its lead measure of the labour market, however for Wales we continue to recommend that consideration should be given to the trends exhibited by other sources.
Accuracy
Some of the data in this bulletin is based on sample surveys meaning it is subject to sampling variability. The LFS is a sample survey and, as such, estimates obtained from it are subject to sampling variability. If we drew many samples, each would give a different result.
If the quarterly or annual change of an estimate is larger than the confidence interval around that change, the change is statistically significant. If none of the quarterly or annual changes are statistically significant, then the recorded changes did not exceed the variability expected from a sample survey of this size and therefore do not provide strong evidence of a real change in the underlying population.
| Indicator | Estimate | Confidence interval |
|---|---|---|
| Employment rate | 72.7% | ±2.3 percentage points |
| Unemployment rate | 4.3% | ±1.1 percentage points |
| Economic inactivity rate | 23.8% | ±2.3 percentage points |
| Indicator | Quarterly change | Confidence interval | Statistical significance |
|---|---|---|---|
| Employment rate | 0.5 percentage points | ±3.0 percentage points | Not statistically significant |
| Unemployment rate | 0.3 percentage points | ±1.5 percentage points | Not statistically significant |
| Economic inactivity rate | -0.9 percentage points | ±3.0 percentage points | Not statistically significant |
| Indicator | Annual change | Confidence interval | Statistical significance |
|---|---|---|---|
| Employment rate | 2.2 percentage points | ±3.3 percentage points | Not statistically significant |
| Unemployment rate | -0.6 percentage points | ±1.7 percentage points | Not statistically significant |
| Economic inactivity rate | -1.9 percentage points | ±3.2 percentage points | Not statistically significant |
Description of tables 1a, 1b and 1c: 3 tables showing the latest estimate, quarterly change and annual change for employment, unemployment and economic inactivity rates in Wales with corresponding 95% confidence intervals and statistical significance.
Source: LFS, ONS
Tables 1a, 1b and 1c show there were no statistically significant changes for headline labour market indicators for the 3 months to July 2026. This suggests that the quarterly and annual changes observed for these indicators may reflect sampling variability rather than real changes in the underlying population.
Headline estimates from the LFS for Wales remain volatile and provide an uncertain view of the labour market when viewed in isolation. Given this, we continue to recommend that consideration should be given to the trends exhibited by other sources. Headline labour market indicators from the APS have been added to this report in order to provide a more rounded picture of the labour market in Wales.
For further information on the interventions ONS have made to improve the quality of LFS and APS labour market estimates and our advice on using these statistics for Wales, please see our Chief Statistician’s update: measuring the labour market in Wales.
Timeliness and punctuality
This release follows the ONS publication schedule of labour market data, available on the National Statistics Release Calendar (GOV.UK). The date of last update and next update for each data source used in this release is listed below.
Labour Force Survey (LFS) (ONS)
- last updated: 15 September 2026
- next updated: 20 October 2026
Annual Population Survey (APS) (ONS)
- last updated: 21 July 2026
- next updated: 20 October 2026
Pay As You Earn (PAYE) Real Time Information (RTI) (HMRC, ONS)
- last updated: 15 September 2026
- next updated: 20 October 2026
Workforce Jobs (WFJ) (ONS)
- last updated: 15 September 2026
- next updated: 15 December 2026
Claimant count (ONS)
- last updated: 15 September 2026
- next updated: 20 October 2026
Accessibility and clarity
Much of the data behind the charts shown in this bulletin can be found on StatsWales. This bulletin covers important statistics for Wales as a whole. Additional breakdowns are available on StatsWales and the ONS website - alongside comparisons to other UK countries - by:
- age
- sex
- disability
- ethnicity
Links to StatsWales, Welsh Government statistical headlines and ONS analysis on information presented in this bulletin as well as other economic and labour market data are available in the additional quality and methodology report.
Contact details
Labour Market and Skills Statistics
Email: labourmarket.stats@gov.wales
Media: 0300 025 8099
SB: 29/2026