Land Transaction Tax statistics: April 2018 to March 2019
The annual statistical release for Land Transaction Tax (LTT) published by the Welsh Revenue Authority (WRA).
In this page
1. Things you need to know about these statistics
From 1 April 2018, LTT replaced Stamp Duty Land Tax (SDLT) on residential and non-residential property and land interests purchased in Wales. The tax rates and tax bands for LTT vary depending on the type of transaction. The full list of tax rates and tax bands can be found on the WRA website.
LTT statistics are not fully comparable to previous SDLT statistics because different rates and bands are used in LTT. The reliefs may also be different for the two taxes (for example, first time buyers’ relief applies to SDLT, but not to LTT).
To date, we have published monthly and quarterly LTT statistics and this release is our first annual statistical publication. In our quarterly release for January to March 2019 (published in April 2019), we included provisional estimates for 2018-19. These statistics have been revised in this release and we now expect to have received virtually all transactions relating to 2018-19. However, statistics for 2018-19 may be revised again in future to account for any amendments to transactions. In particular, this will be due to higher rate refunds (relating to transactions which were effective during 2018-19) continuing to be made for the next few years.
Users should refer to the separate glossary and key quality information while reading this statistical release. Relevant terms are defined in the glossary as they are used in the release.
Unless stated otherwise, all data relates to the financial year 2018-19 (April 2018 to March 2019). Where monthly data is presented in charts, this is usually presented up to May 2019. This is because alongside this annual release published on 27 June 2019, we are also publishing our latest monthly data-only release, which includes data up to May 2019.
These statistics relate to transactions which were effective during 2018-19. A property or piece of land may have been sold more than once in 2018-19, and if so, would feature multiple times in the statistics. Our best estimate is that between 3.5% and 4% of transactions involved a piece of land or property which has been sold more than once in 2018-19.
The following symbols are used in this release:
r This value has been revised in this publication
p This value is provisional and will be revised in a future publication
2. Transactions, tax due and property value taxed
Figure 2.1 Number of reported notifiable transactions, by effective date [1]

- At the close of 17 June 2019, there were 61,750 reported notifiable transactions with an effective date during 2018-19. 90% of transactions were residential and 10% were non-residential.
- We expect that we have now received virtually all transactions with an effective date in 2018-19, although it is still possible that existing transactions may be amended (for example due to a refund of the higher residential rate). If in future any further transactions are received or amended relating to 2018-19, future statistical releases will present revised data.
Figure 2.2 Tax due on reported notifiable transactions, by effective date [1]

- At the close of 17 June 2019, £226.9 million tax was due for transactions with an effective date during 2018-19. This value for 2018-19 has been revised marginally downwards since our previous publication in May 2019 (data-only update) when the figure was £227.5 million. This decrease is due to refunds being paid out in the past month (for higher rates transactions which were effective during 2018-19).
- Residential transactions accounted for just over two-thirds of total tax due and non-residential transactions accounted for just under a third of total tax due.
Figure 2.3 Value attributed to properties subject to LTT, by effective date [1]
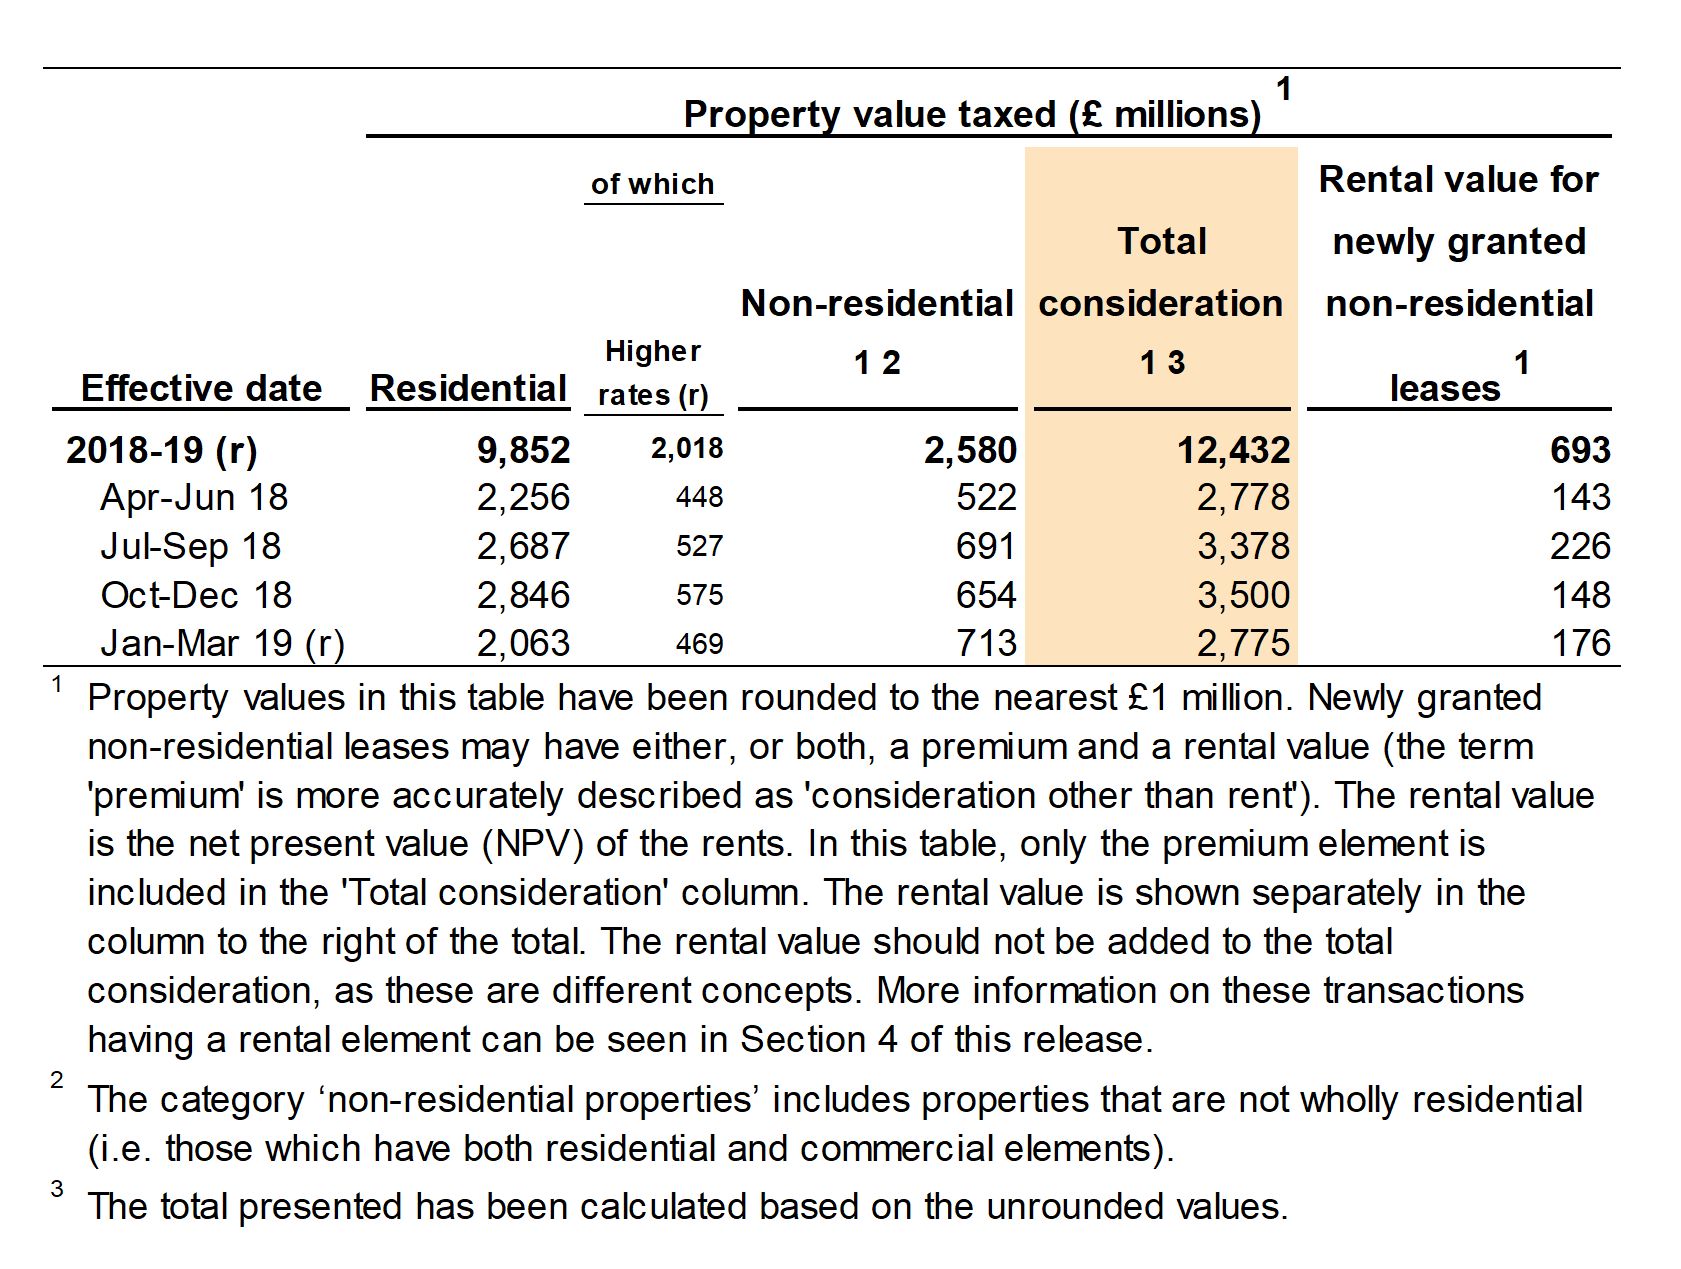
- The value of property taxed in 2018-19 was £12.4 billion, and separately, the rental value for newly granted non-residential leases was £693 million.
Figure 2.4 Number of reported notifiable transactions, by month transaction was effective

- The numbers of transactions by effective month has varied greatly since April 2018. Higher numbers were generally seen in the second half of 2018, peaking in November 2018. This was partially due to there being five Fridays in November 2018 (Figure 10.8 in section 10 of this release shows that nearly half of transactions have an effective date that is a Friday).
- In March 2019, there was an increase from the previous month in non-residential transactions. This may be expected, as it is common for non-residential leases to be renewed at the end of the financial year
Figure 2.5 Tax due on reported notifiable transactions, by effective month
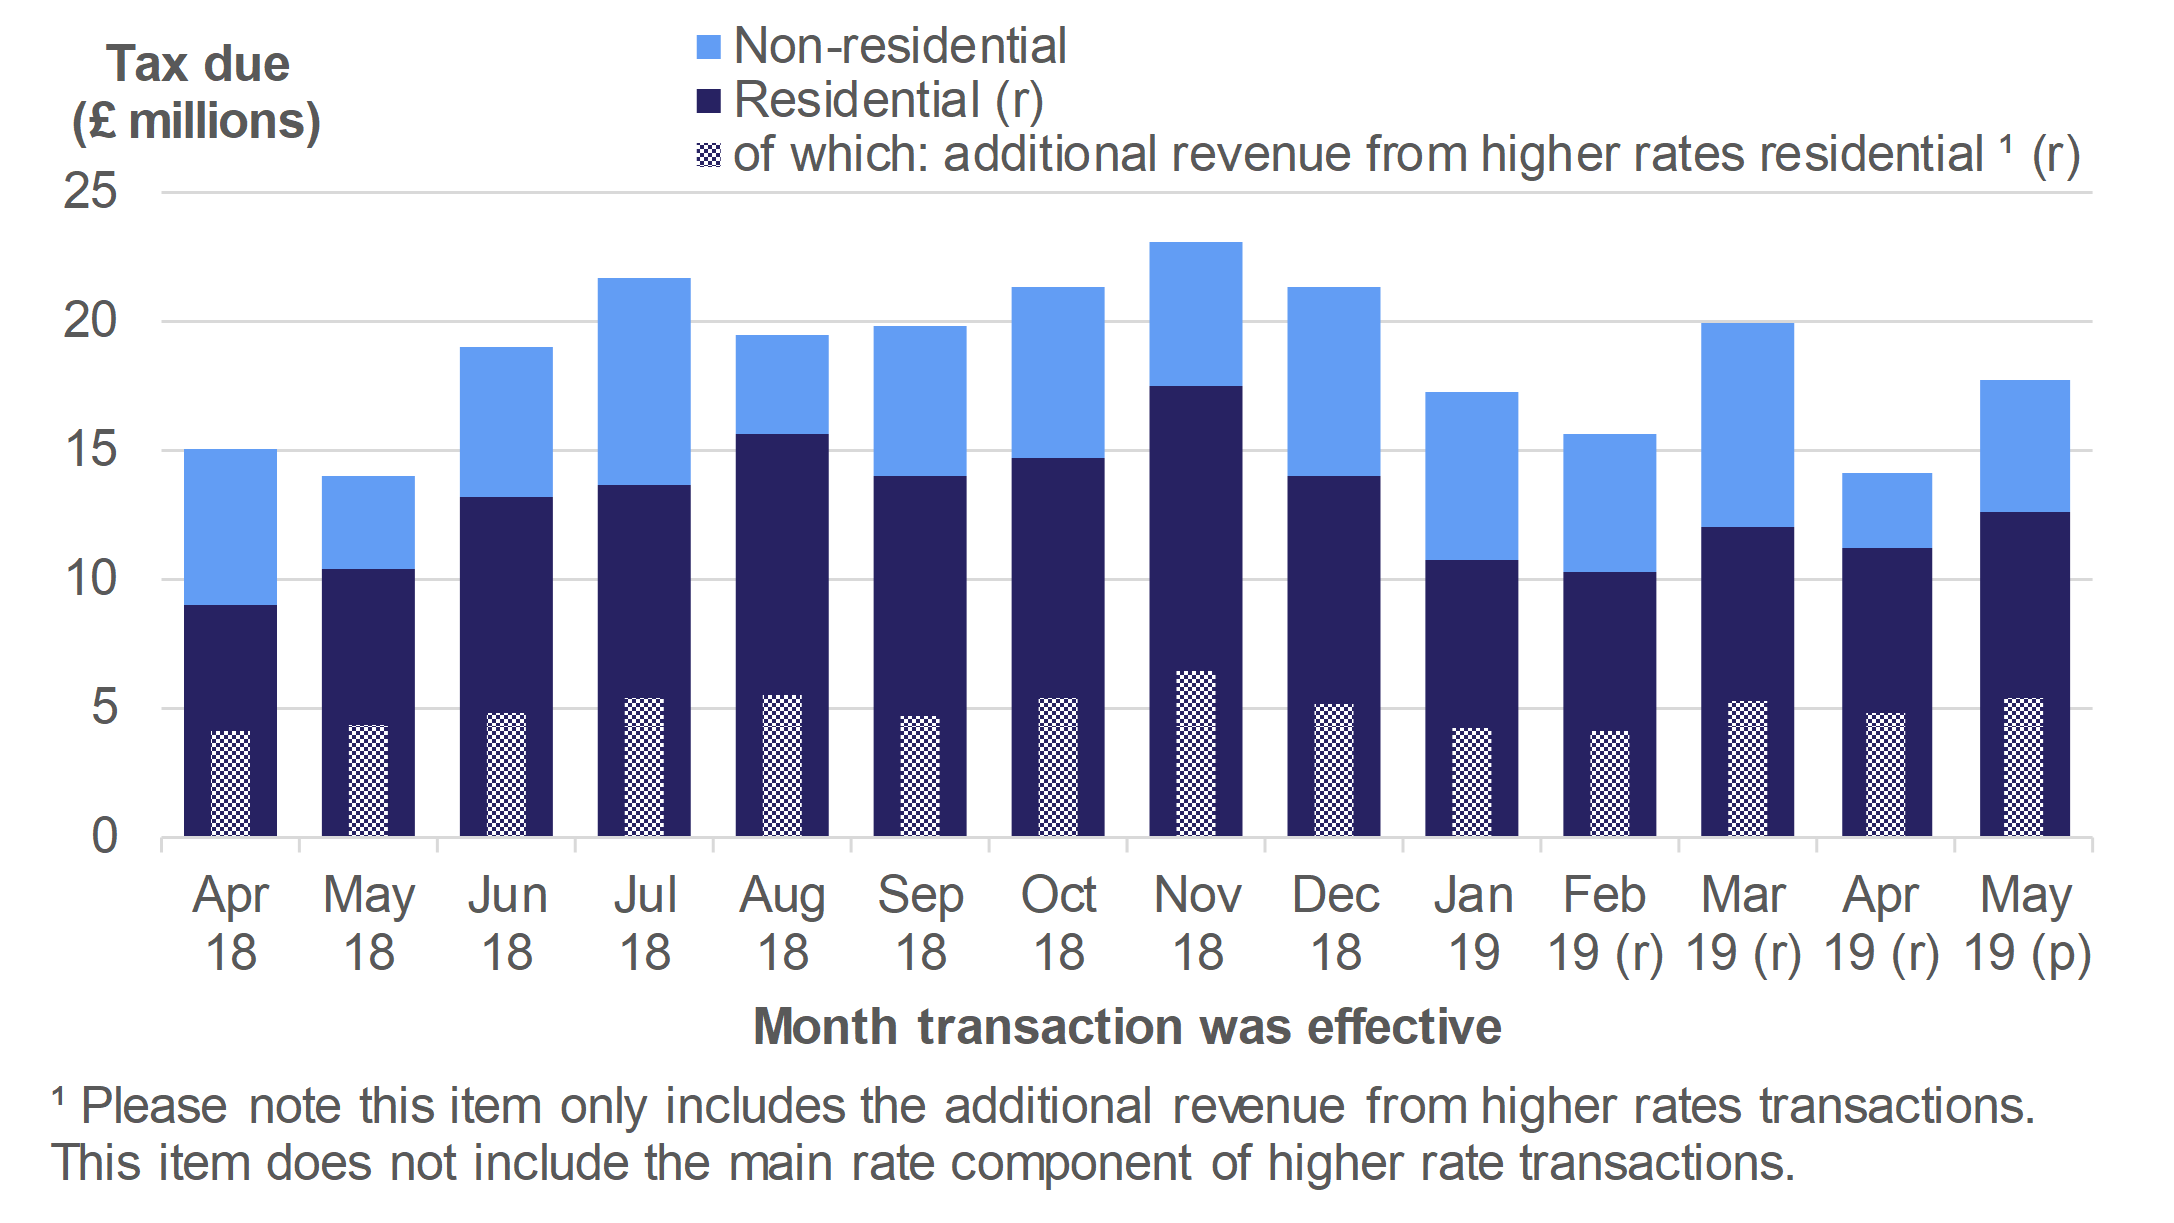
- As may be expected, similar trends are seen in the monthly tax due as are seen in the monthly counts of transactions.
- However, there is greater volatility in this comparison when considering only non-residential transactions.
- The tax due for non-residential transactions also makes up a larger share of total tax due than when considering numbers of transactions. The same is true for the additional revenue from higher rates residential transactions
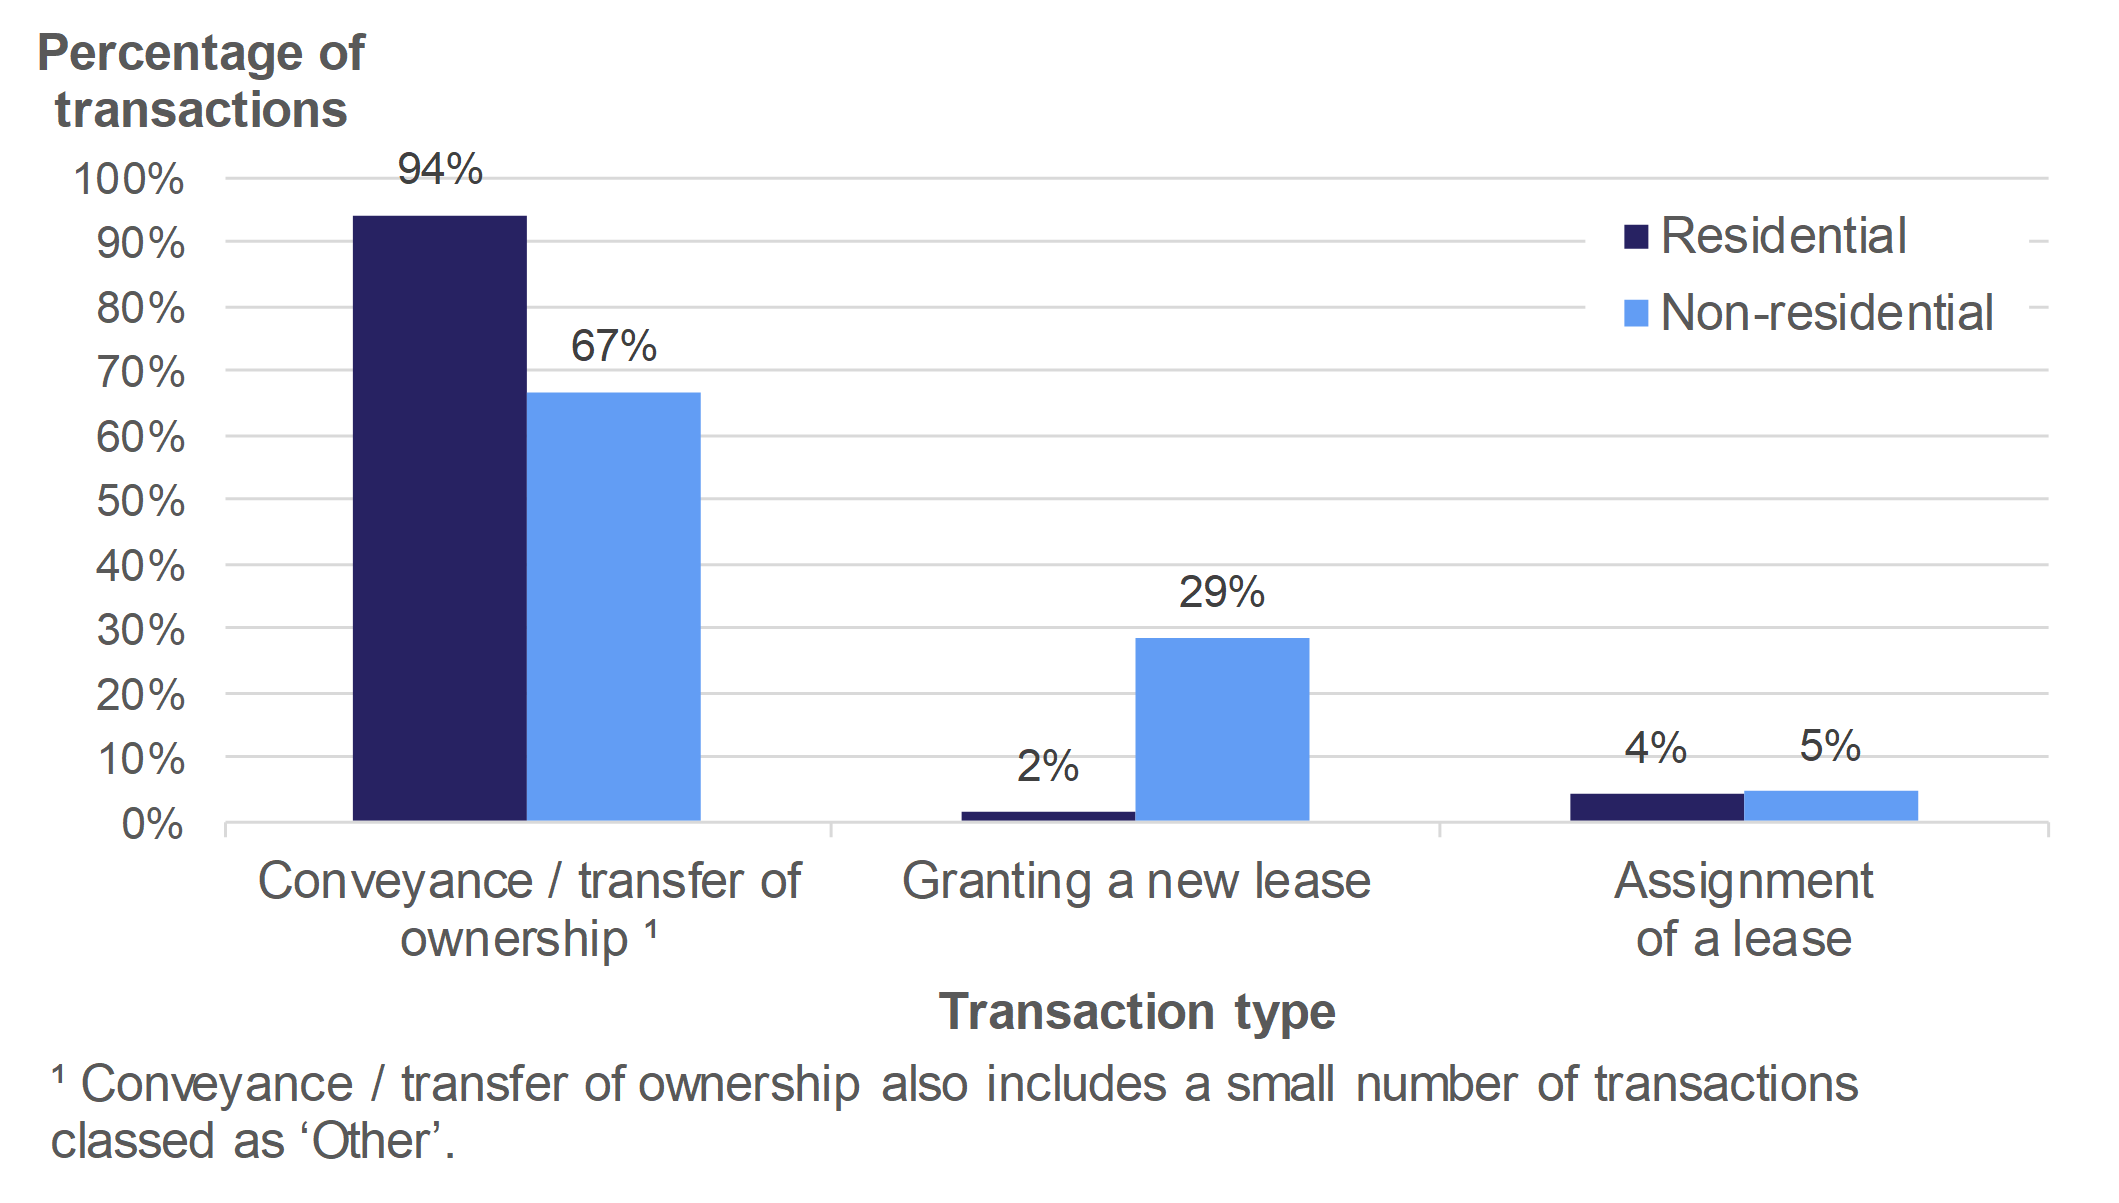
Figure 2.6 Transactions by transaction type
- The valuation of the properties associated with those conveyances and transfer of ownership during 2018-19 was £11.6 billion (not shown in Figure 2.6).
- Conveyance or transfer of ownership accounted for most of reported notifiable transactions in 2018-19. This figure was 94% for residential transactions and 67% for non-residential transactions.
- A new lease was granted in 29% of non-residential transactions (compared with 2% of residential transactions).
3. Residential transactions by value
Figure 3.1 Number of residential transactions and tax due on those properties, by residential tax band

- Nearly two thirds of residential transactions were within the first tax band (purchase price £180,000 or lower). Although the main tax rate on residential transactions of up to £180,000 is 0%, these transactions still accounted for nearly a fifth of total residential tax due, which all relates to the higher rates residential component of the tax.
- Combining the fourth, fifth and sixth bands (purchase price of greater than £400,000), these accounted for only 4% of transactions. However, the tax due for these transactions accounted for nearly a third of the total residential tax due.
4. Non-residential transactions by value
Figure 4.1 Number of non-residential transactions, by value

Figure 4.2 Tax due on non-residential transactions, by value
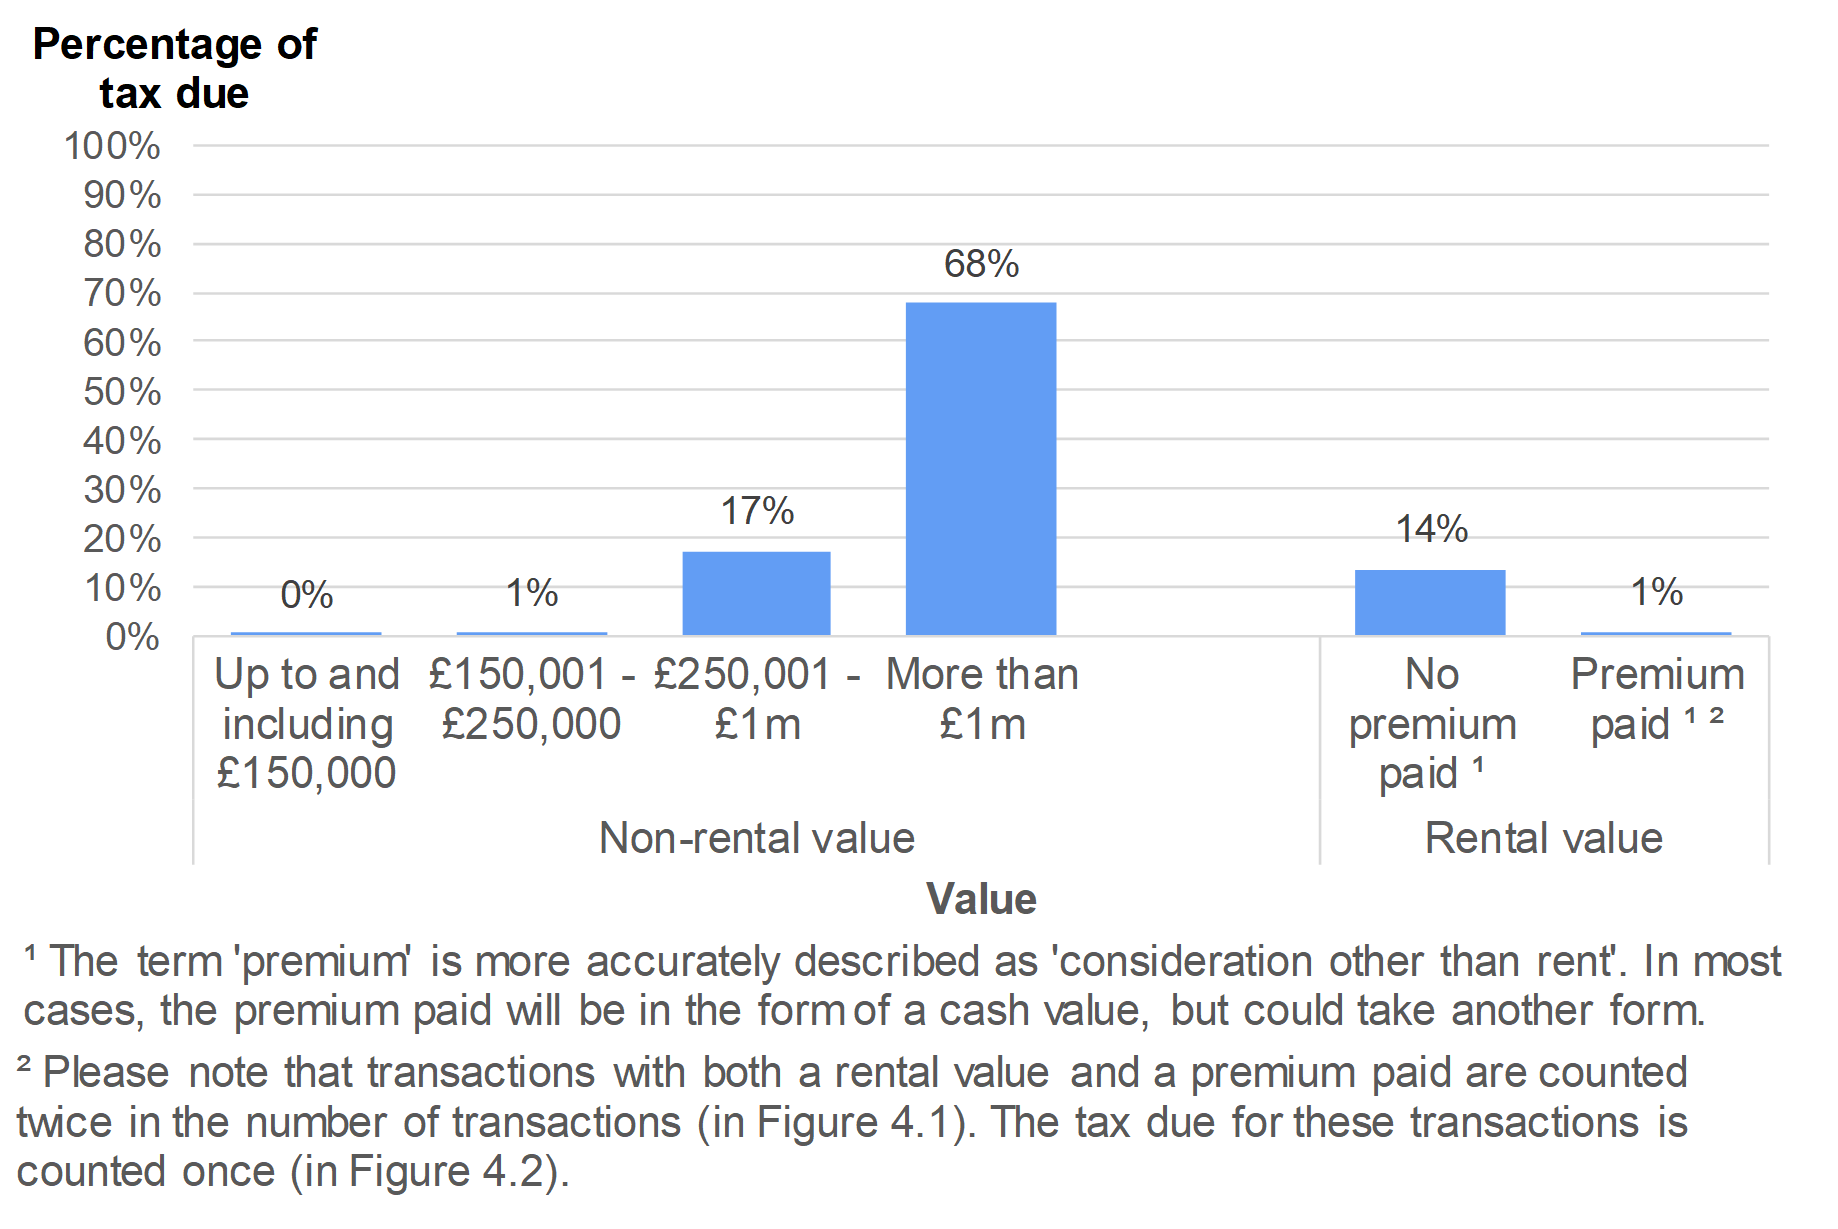
- There were 6,090 reported notifiable non-residential transactions effective in 2018-19, with £72.5 million tax due.
- Figure 4.1 shows that while only 6% of these transactions had a non-rental value of more than £1 million, these transactions accounted for just over two thirds of the non-residential tax due (Figure 4.2).
- Figure 4.1 also demonstrates that for just over a fifth of non-residential transactions, a rental value was associated with the property (which contributed to the tax paid on the transaction).
- The rental value of non-residential properties accounted for 14% of the total non-residential tax due (Figure 4.2).
5. Reliefs
Reliefs can be claimed on both residential and non-residential properties. Reliefs reduce the amount of tax due when certain conditions are met. Multiple reliefs can be applied to a single transaction and reliefs may reduce the tax due to zero (known as a full relief) or by a certain percentage or amount (known as a partial relief).
Figure 5.1 Number of transactions relieved, by type of relief [1]

- Figure 5.1 shows that there were 1,130 non-linked transactions in 2018-19 which had reliefs applied to them that reduced the associated tax due. The most common relief used was charity relief, which was applied on 300 transactions.
- Figure 5.1 also shows that 440 reliefs were claimed in 2018-19 which had no impact on the tax due (these are shown separately). Many of them have been reported unnecessarily by the organisations completing the tax return. As an example, some of these apply to low value residential transactions. Indications are that they are due to a perceived but mistaken need to claim first time buyer relief (which applies for the predecessor tax, but not to LTT). This is known following queries raised with several agents asking why tax reliefs have been claimed where there is no impact on value of the tax. Further information about this category of reliefs is provided in Example 4 in our key quality information.
- This example also describes some adjustments that have been made to more correctly identify the value of tax relieved associated with these transactions. Further adjustments are expected in future; and we therefore expect to revise this final item in Figure 5.1 in future.
Figure 5.2 Tax relieved, by type of relief [1]

- The type of relief with the largest impact on tax due in 2018-19 was group relief, predominantly in non-residential transactions. This relief accounted for nearly two-thirds of the total tax relieved for non-linked transactions. The total value of reliefs claimed for non-linked transactions in 2018-19 was £51.0 million.
6. Higher rate refunds
Figure 6.1 Number and value of refunds of higher rate residential issued, by effective date [1]

When a refund for higher rates residential LTT is claimed, the original transaction is amended to a main rate residential LTT transaction. The data in this release is adjusted for any refunds approved by WRA up to and including 17 June 2019.
Figure 6.1 shows that 880 higher rate refunds were claimed for transactions with an effective date in 2018-19, with £6.7 million refunded to taxpayers.
With up to three years for taxpayers to sell their previous main residence and claim a refund, this data for 2018-19 will continue to be revised upwards in future editions of our statistics (with a consequent reduction in the total tax due shown in other tables).
The number and value of refunds presented for January to March 2019 are lower than for earlier periods. This is because compared with earlier periods, insufficient time has passed since the transaction was effective for many of the relevant taxpayers to sell their previous main residence and claim their refund.
Further information on the refund payments made to taxpayers, by the month in which they were made, can be found in Table 6a of our monthly and quarterly statistics. These are provided, in the main, to support forecasting requirements.
Figure 6.2 below shows another useful way of presenting data on higher rates refunds, using the date when the refund was approved by the WRA.
Figure 6.2 Refunds of higher rates residential issued, by quarter the refund was approved
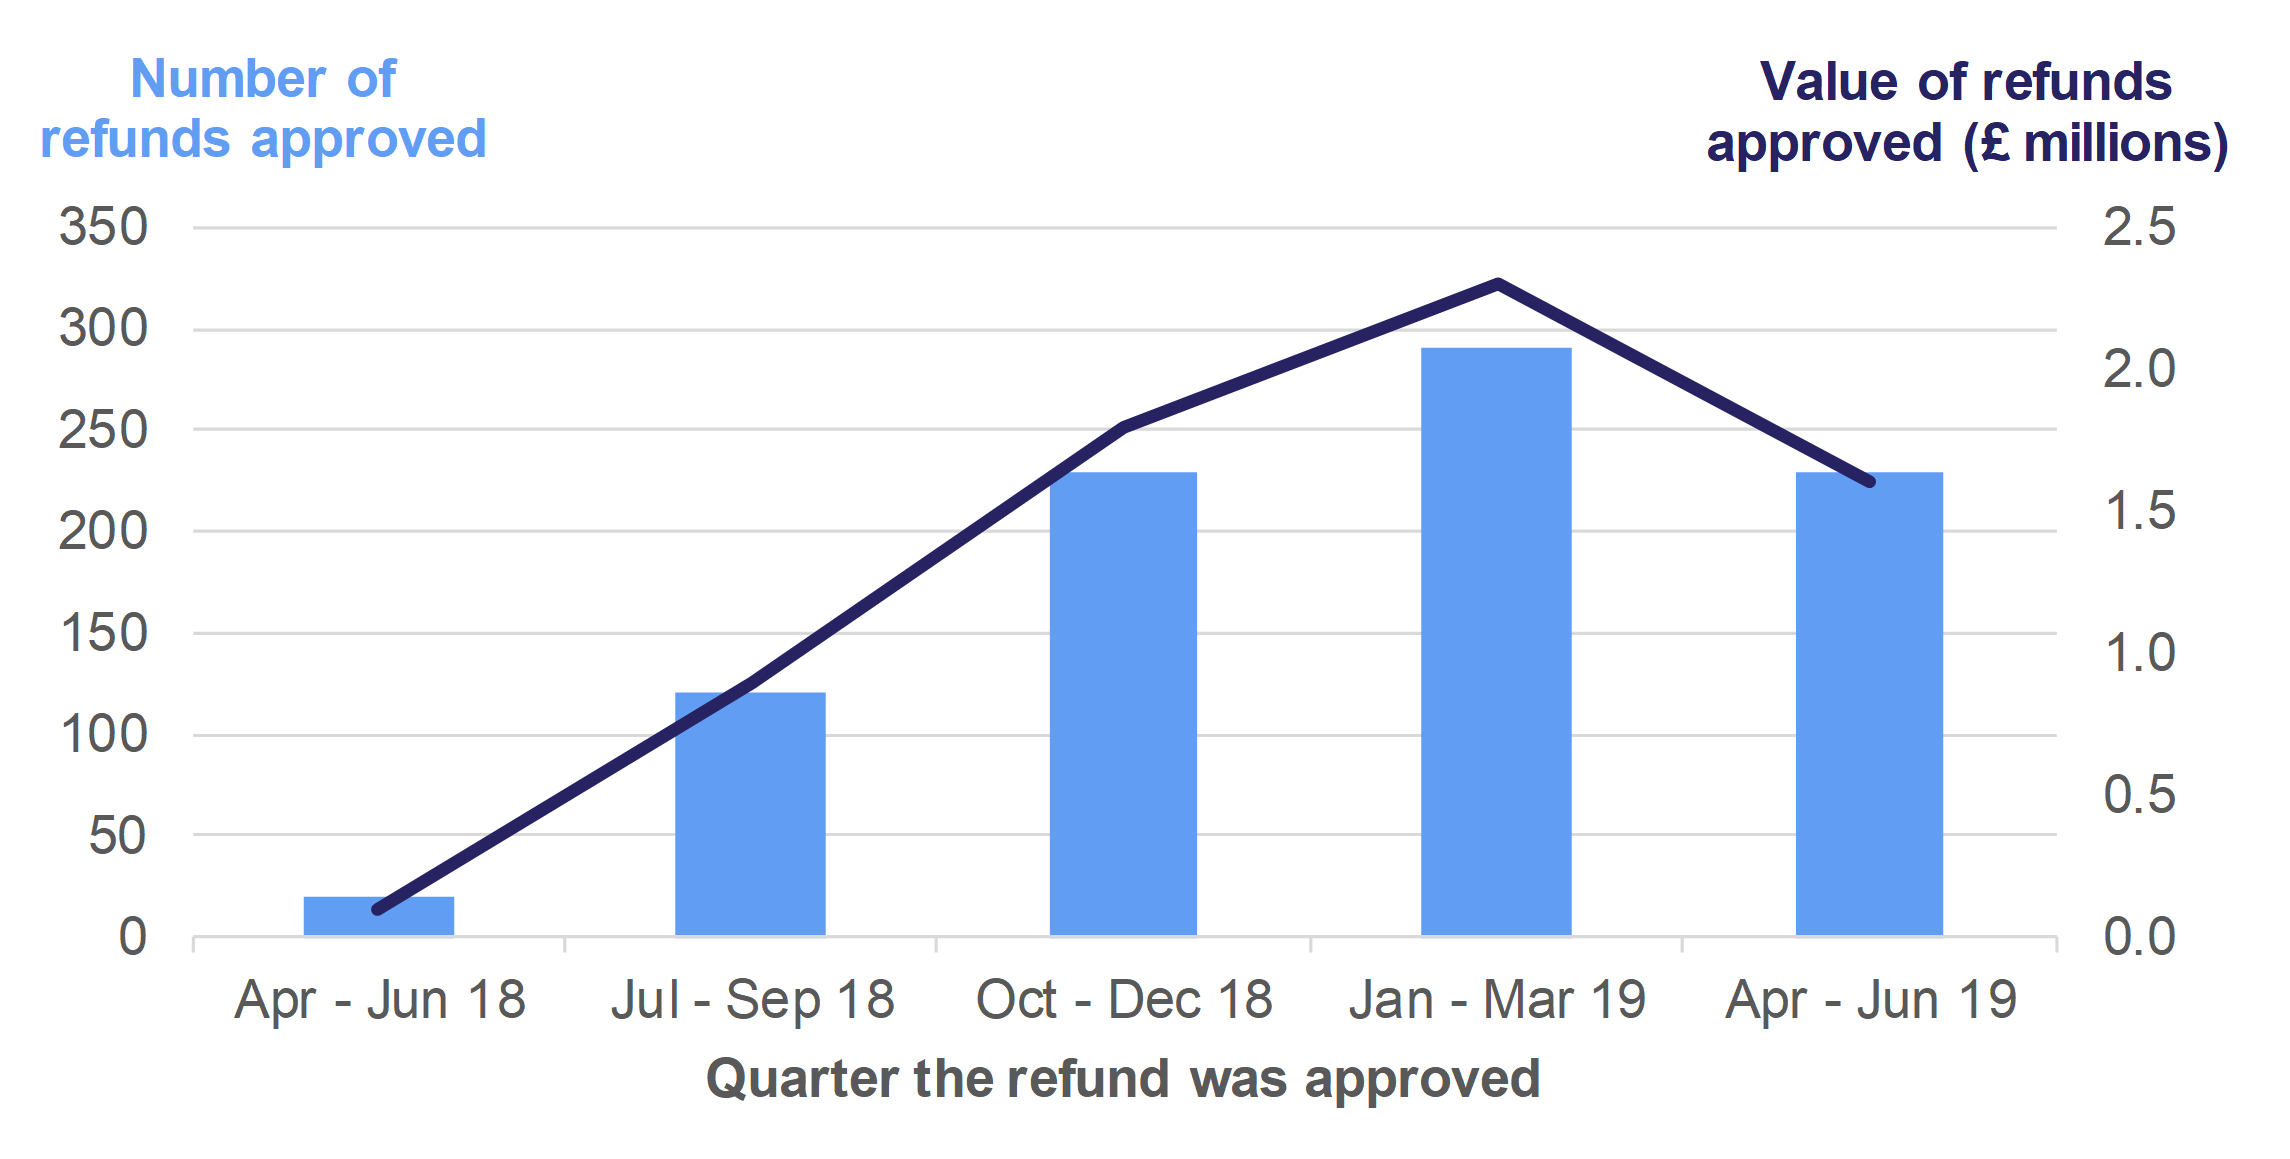
The number of refunds approved (and value of those refunds) increased during each quarter in 2018-19, reflecting expectations as sufficient time has passed for claims to be made. There has been a fall in the data for quarter 1 of 2019-20, but it should be noted that only refunds approved up to 17 June 2019 are included in Figure 6.2 (namely, that the data for quarter 1 of 2019-20 is not yet complete).
For all higher rates transactions, the WRA asks the question whether the taxpayer intends to reclaim the higher rates element in future. While it will take several years before we know how likely someone is to claim based on their stated intentions (it can take up to three years to make the claim), we do currently know that around 70% of those who do claim answer this question in the positive.
7. Tax paid
Figure 7.1 Land Transaction Tax (LTT) paid to the Welsh Revenue Authority (WRA)
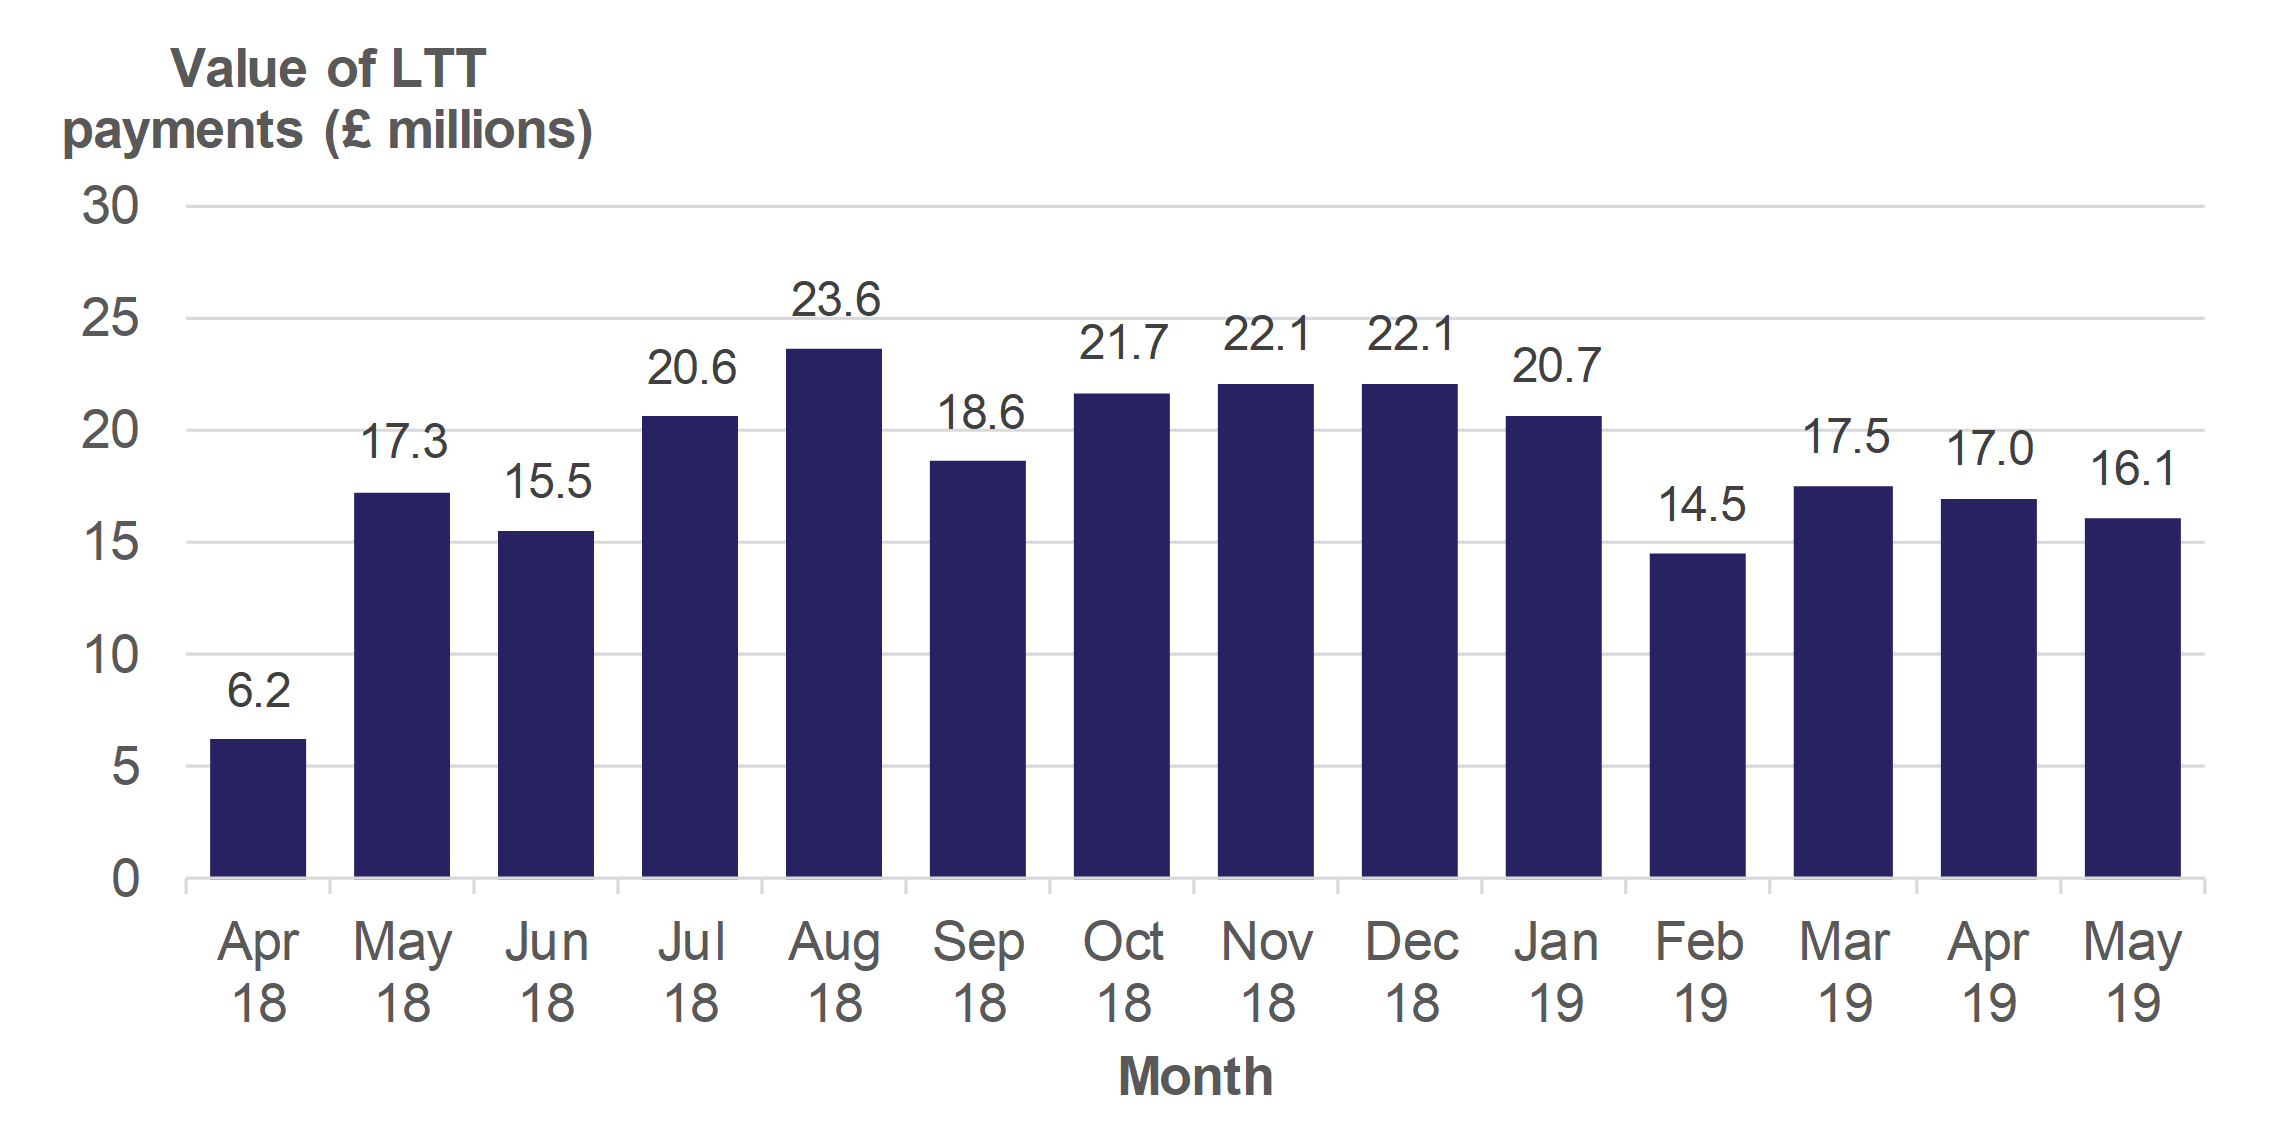
- In 2018-19, the WRA received £220.2 million in LTT payments. These figures are less than those reported in Figure 2.2 as they relate to the payments actually received in each month (often referred to as ‘on a cash basis’), as opposed to the amounts due on transactions that were effective in the month.
- In particular, there is a difference in April 2018, as the WRA only started collecting the tax in that month. Therefore, no payments relating to transactions effective in prior months were relevant.
- After April 2018, receipts generally increased to August 2018, followed by a period of relative stability until February 2019 which saw the lowest figure since April 2018. Figures since have been slightly higher.
WRA accounts
LTT transactions are subject to revision for various reasons, for example following a review into their accuracy, or the granting of higher rates refunds. As the data in this release is largely based on the effective date of the transaction, and because the effective date is usually unchanged by these revisions, then much of the data published here can still change.
Whilst virtually all the transactions relating to 2018-19 should now be included in this release (due to the time that has elapsed since the end of the year), data for 2018-19 will never be fully finalised until the window for revisions closes. In the case of higher rate refunds this can be as much as three years after the original transaction, with a potentially longer window available for certain other transactions, such as those which WRA choose to open an enquiry into.
For the purposes of accounting and forecasting, it is necessary to create a final figure at the Wales level for the total tax due for 2018-19. Whilst the value of the money received in figure 7.1 is fixed as soon as each period ends, this is too simplistic for this purpose.
Instead this final accounting figure is defined by including transactions (or any amendments to transactions) received up until 30 April 2019 with an effective date in 2018-19. Any transactions received (or amendments made) since 30 April 2019, or yet to be received are excluded. This figure is currently in draft and stands at £227.8 million, with £155.4 million from residential transactions and £72.4 million from non-residential transactions. It will be formally published when the WRA’s accounts for 2018-19 are laid before the National Assembly for Wales in July 2019.
Note any changes to this figure will be reflected here when the accounts are formally laid and in future the figure will form part of a table covering data for each of the years from 2018-19 onwards.
8. Analysis within Wales
For the first time, this release presents geographic breakdowns for LTT (on an annual basis only). We have not provided breakdowns by month or quarter, as there would be too few transactions in most local authorities to provide reliable statistics.
The local authority in which the transaction occurs is a mandatory question on the tax return. The postcode where the transaction occurs is an optional question on the tax return. We have combined these two pieces of information to derive our local authority statistics. Further information on this process and the data quality is available in our key quality information for LTT statistics.
Local authority data is presented for residential and non-residential transactions and tax due, whilst local authority data on the value of properties taxed (known as the consideration) is presented for residential transactions only. This is because there are some non-residential transactions with a particularly large consideration and a possible risk of identifying a taxpayer if we were to publish annual local authority data on these. In future, we will investigate the viability of combining several years of non-residential transactions to support safe publication of consideration data.
We are also publishing annual statistics for National Assembly constituencies. These statistics are not analysed in this release but are available on the StatsWales website. These statistics are published for residential transactions only. Where supplied, the postcode on the tax return is used to derive the National Assembly constituency. Where the postcode is not supplied, there is a clear bias towards larger non-residential transactions, and as these cannot be allocated to a National Assembly constituency area, the resulting statistics are not reliable. Therefore, it is not currently appropriate to produce statistics on non-residential transactions for National Assembly constituencies.
Where Wales averages are presented in this section, these are a weighted mean which takes account of different numbers of transactions in each local authority.
Figure 8.1 Tax due per residential transaction, by local authority (£)

- Figure 8.1 shows that for residential transactions, the average tax due per transaction was highest in Monmouthshire (£6,640) and Vale of Glamorgan (£5,090).
- The average tax due per residential transaction was lowest in Blaenau Gwent (£810) and Merthyr Tydfil (£940).
Figure 8.2 Tax due per non-residential transaction, by local authority (£)

- Figure 8.2 shows that for non-residential transactions, the average tax due per transaction was highest in Cardiff (£31,570).
- The average tax due per non-residential transactions was lowest in Blaenau Gwent (£4,230).
- As with residential transactions, the tax due for individual transactions in a local authority varied widely around the average figure for Wales.
- Although the patterns seen for residential and non-residential are quite similar, there are some clear differences in the ordering of the local authorities between the two charts.
Figure 8.3 Higher rate transactions as a percentage of all residential transactions, by local authority

Figure 8.3 shows the wide variation between local authorities in the level of higher rate residential transactions. This data is presented as a percentage of all residential transactions.
- Higher rates transactions were generally more common in north and west Wales authorities. The highest percentages were seen in Gwynedd (37%), Isle of Anglesey (33%) and Swansea (28%).
- The lowest percentages were seen in Torfaen (16%) and Flintshire (18%).
Figure 8.4 Average property value per residential transaction, by local authority (£)
- For residential transactions, the highest average property values (or consideration) per transaction were in Monmouthshire (£274,000) and Vale of Glamorgan (£245,700), and lowest in Blaenau Gwent (£102,200) and Merthyr Tydfil (£109,000).
9. Analysis by Welsh Index of Multiple Deprivation area
We have also been able to include an analysis of LTT for Welsh Index of Multiple Deprivation (WIMD) areas. This analysis shows the level of transactions and tax due in the most and least deprived areas of Wales.
These statistics for WIMD areas are published for residential transactions only. Where supplied, the postcode on the tax return is used to derive the WIMD area. Where the postcode is not supplied, there is a clear bias towards larger non-residential transactions, and as these cannot be allocated to a WIMD area, the resulting statistics are not reliable. Therefore, it is not currently appropriate to produce statistics on non-residential transactions for WIMD areas.
What is WIMD and how are we using it?
WIMD is designed to identify the small areas of Wales that are the most deprived. WIMD is currently made up of eight separate domains (or types) of deprivation. Each domain is compiled from a range of different indicators. The eight domains are income, employment, health, education, access to services, community safety, physical environment, and housing. Further information is available on the WIMD webpage.
Where provided, we have linked the postcode from the tax return to around 1,900 small areas in Wales. These small areas are ranked by WIMD from the most to least deprived. These areas are grouped into ten equal sized bands from the most to least deprived (known as ‘deciles’ or ‘tenths’).
The latest update of the WIMD ranks was in 2014. Each update of WIMD ranks is designed to last for around three to six years. The next update of WIMD ranks has been announced for November 2019.
Where averages are presented in this section, this is a weighted mean which takes account of different numbers of transactions in each WIMD tenth.
Furthermore, most of the variation in terms of deprivation is found in the most deprived tenths. The difference (in relative deprivation) between the most deprived and second most deprived tenths is greater than that at the other end of the distribution.
Figure 9.1 Number of transactions, by WIMD tenth

Figure 9.2 Tax due, by WIMD tenth (£)

- Because each of these tenths are of a similar size in terms of population, we can analyse the data without scaling for their size, as was necessary for local authorities (see the green box in section 8 of this release). This allows us to consider the number of transactions and tax due separately rather than the ratio between the two items that we analysed for local authorities.
- Figure 9.2 shows, as might be expected, that the total residential tax due grows considerably and quite uniformly through the range of areas (from most deprived to least deprived). This represents likely differences in the value of property in these areas.
- However, Figure 9.1 also shows that the number of residential transactions is lowest in the most deprived areas of Wales, peaking towards the middle and latter part of the distribution, and dropping down a little for the least deprived tenth. This suggests that deprivation not only has an impact on prices but also in the level of activity in the housing market in Wales.
- The additional revenue from higher rates also generally grows from the most deprived areas to the latter end of the distribution, before dropping in the least deprived two tenths.
Figure 9.3 Higher rate transactions as a percentage of all residential transactions, by WIMD tenth

- Figure 9.3 shows the percentage of higher rates transactions within total residential transactions for each WIMD tenth. The proportion of residential transactions which are taxed at the higher rates generally falls from the most deprived areas to the least deprived areas (with some exceptions).
- As stated in section 8 of this release, there are various reasons for the higher rates tax being chargeable, two of these being purchases of buy-to-let properties and purchase of second or holiday homes. Figure 9.3, taken together with Figure 9.1 (which shows that the number of higher rates transactions varies only very little between WIMD tenths), may give some insight into the balance between these two items.
- Assuming that buy-to-let properties are more likely to be bought in more deprived areas, while second or holiday homes are more likely to be bought further up the distribution, then a tentative conclusion can be drawn that buy-to-let properties are at least as prevalent as second or holiday homes as a factor on why the higher rates of tax are charged. It is therefore important not to assume that any single factor is the driver for the higher rate charge.
10. Operational data
Performance analysis
The WRA has a mixed approach to measuring its performance, combining a series of numerical indicators with a narrative on the approach taken in managing day-to-day business.
Some of the performance measures set out in the WRA’s 2019-2022 Corporate Plan can already be measured, and these are presented below covering the financial year 2018-19. The measures in the Plan which correspond to these analyses is stated below each.
Figure 10.1 The percentage of payments received electronically, by month received

Figure 10.1 corresponds to Measure 1.2 in the WRA Corporate Plan and covers all payments made to the WRA.
This shows there was a general improvement over the year in the proportion of payments received electronically, which includes both Land Transaction Tax and Landfill Disposals Tax.
Figure 10.2 The percentage of Land Transaction Tax returns received within 31 days, by month transaction was effective

Figure 10.2 corresponds to Measure 5.1 in the WRA Corporate Plan and covers only Land Transaction Tax.
It shows that the level of timeliness in receiving Land Transaction Tax returns (i.e. the proportion received within a month of the date the transaction became effective) has remained near 100% over the course of the year, with an increase in the proportion received within 14 days over the course of the year. The latter is likely to be related to a change in HMRC in which returns for the Stamp Duty Land Tax are now required within 14 days.
Figure 10.3 The percentage of Land Transaction Tax debts collected within 30 days, by month transaction was effective

Figure 10.3 corresponds to Measure 5.2 in the WRA Corporate Plan and covers only Land Transaction Tax.
It demonstrates that timeliness in respect of collecting Land Transaction Tax amounts that have ended up in debts is also improving, particularly in the last two months of the year.
Figure 10.4 The percentage of Land Transaction Tax returns received electronically or by paper, by month received

Figure 10.4 above corresponds to Measure 1.1 in the WRA Corporate Plan and covers only Land Transaction Tax.
It demonstrates that the rate of electronic submission for returns has fluctuated a little around an average of 97%. The upturn in this measure in March 2019 (more easily seen in the percentage of returns received on paper), followed an earlier dip which led to action by the WRA customer service team. Note that Landfill Disposals Tax returns are all filed electronically and excluded from the above as a paper return is not offered as an option.
Figure 10.5 The percentage of transactions that automatically progress to initial* closure with no WRA action, by received date

Figure 10.5 only includes initial submission and payment (if relevant) but not any future work the WRA might undertake to manage tax risk. It corresponds to measure 6 in the WRA Corporate Plan and covers all tax transactions.
It shows that automatic processing (i.e. returns received digitally and where relevant paid with no manual intervention) has improved over the year. This covers both Land Transaction Tax and Landfill Disposals Tax.
Figure 10.6 The percentage of Land Transaction Tax higher rate refunds made within 30 days of approval, by approval date

Figure 10.6 corresponds to measure 5.3 in the WRA Corporate Plan.
The processing time (from approval to payment) for Land Transaction Tax higher rates refunds has met the WRA’s target of payment within 30 days since summer 2018 (when the first significant applications were received). The average number of days to process has been around the five-day mark for the latter half of the year.
The WRA is aware that meeting this target in future is likely to be more challenging as the number of refunds is expected to increase, and also acknowledges that the measure should include some information on the time taken to initially approve the refund. This will be added in the coming year and included in a future annual statistical release.
Analysis by submission date of the return
We are aware that some other statistical publications in the UK base their analysis on the date that the tax return is submitted. We have therefore produced some comparable figures to other UK countries (using date submitted) and we have also compared these to our effective date statistics.
Figure 10.7 Transactions notified to the WRA, by month the transaction was submitted versus its effective date
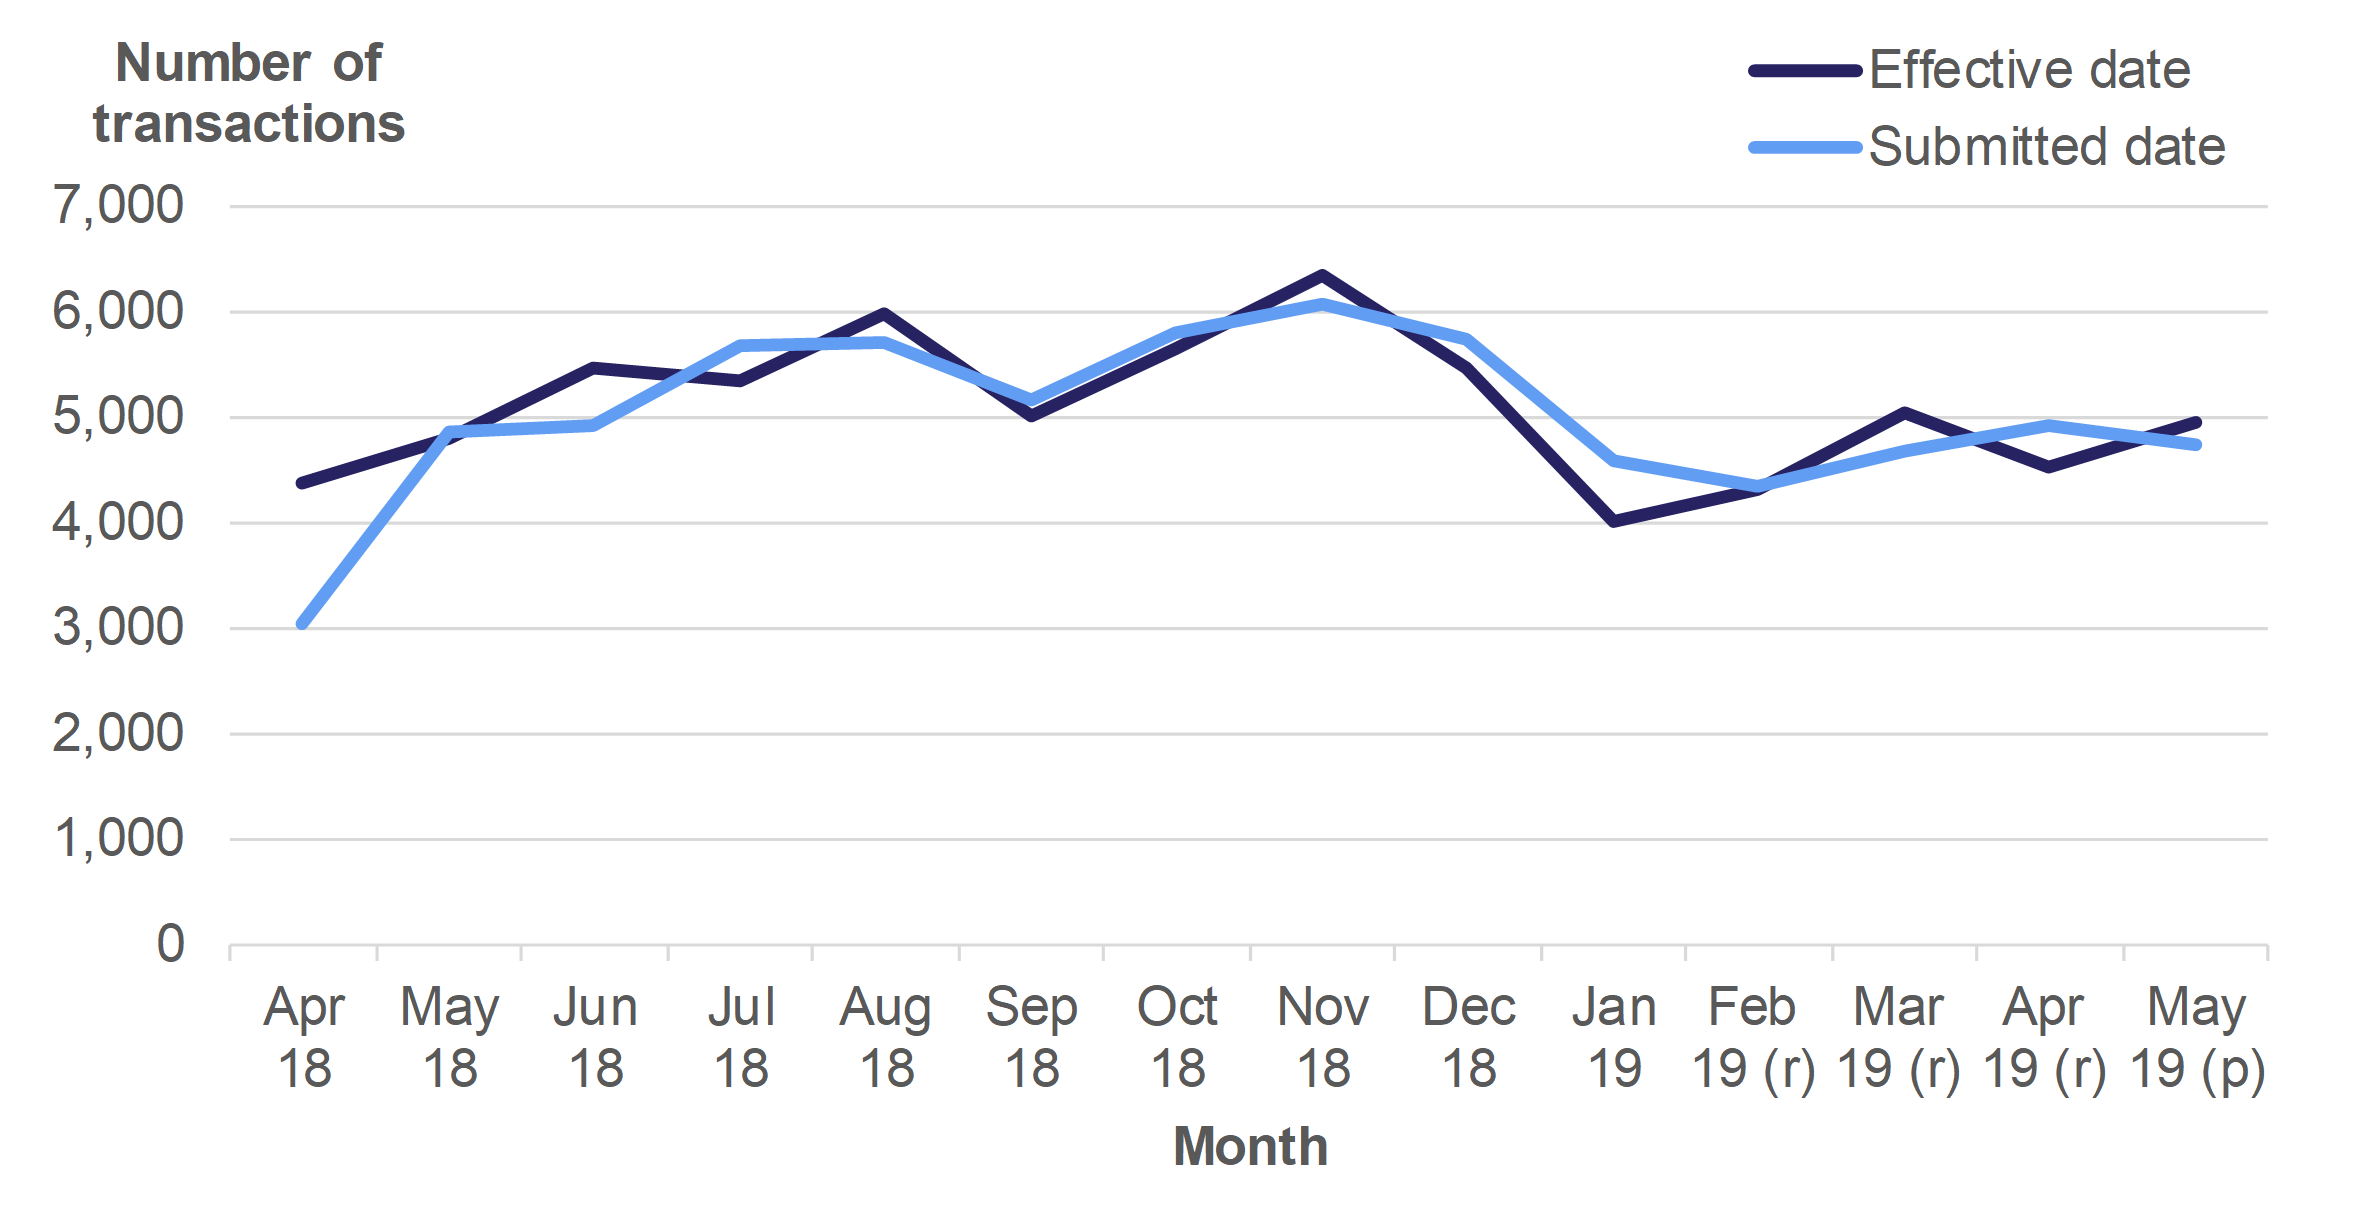
In 2018-19 (April 2018 to March 2019), 61,750 transactions were effective, while 60,460 of those were submitted to the WRA in the same period. The balance of these transactions has been submitted since 31 March.
As might be expected, the monthly trend is generally quite similar for the two series. The largest differences between the two numbers were seen in the following months.
- In April 2018, 1,350 more transactions were effective than were submitted. This is largely because there were no LTT transactions which would have been effective in March 2018 to act as a balance for those effective in April that were received in May 2018. These March 2018 transactions were still being submitted to HMRC under the predecessor tax regime of Stamp Duty Land Tax.
- In January 2019, 560 more transactions were submitted than were effective. This is likely to have been due to Christmas holidays and the submission in January 2019 of a greater volume of transactions effective in December 2018.
Figure 10.8 Transactions notified to the WRA, by day of the week the transaction was submitted versus its effective date
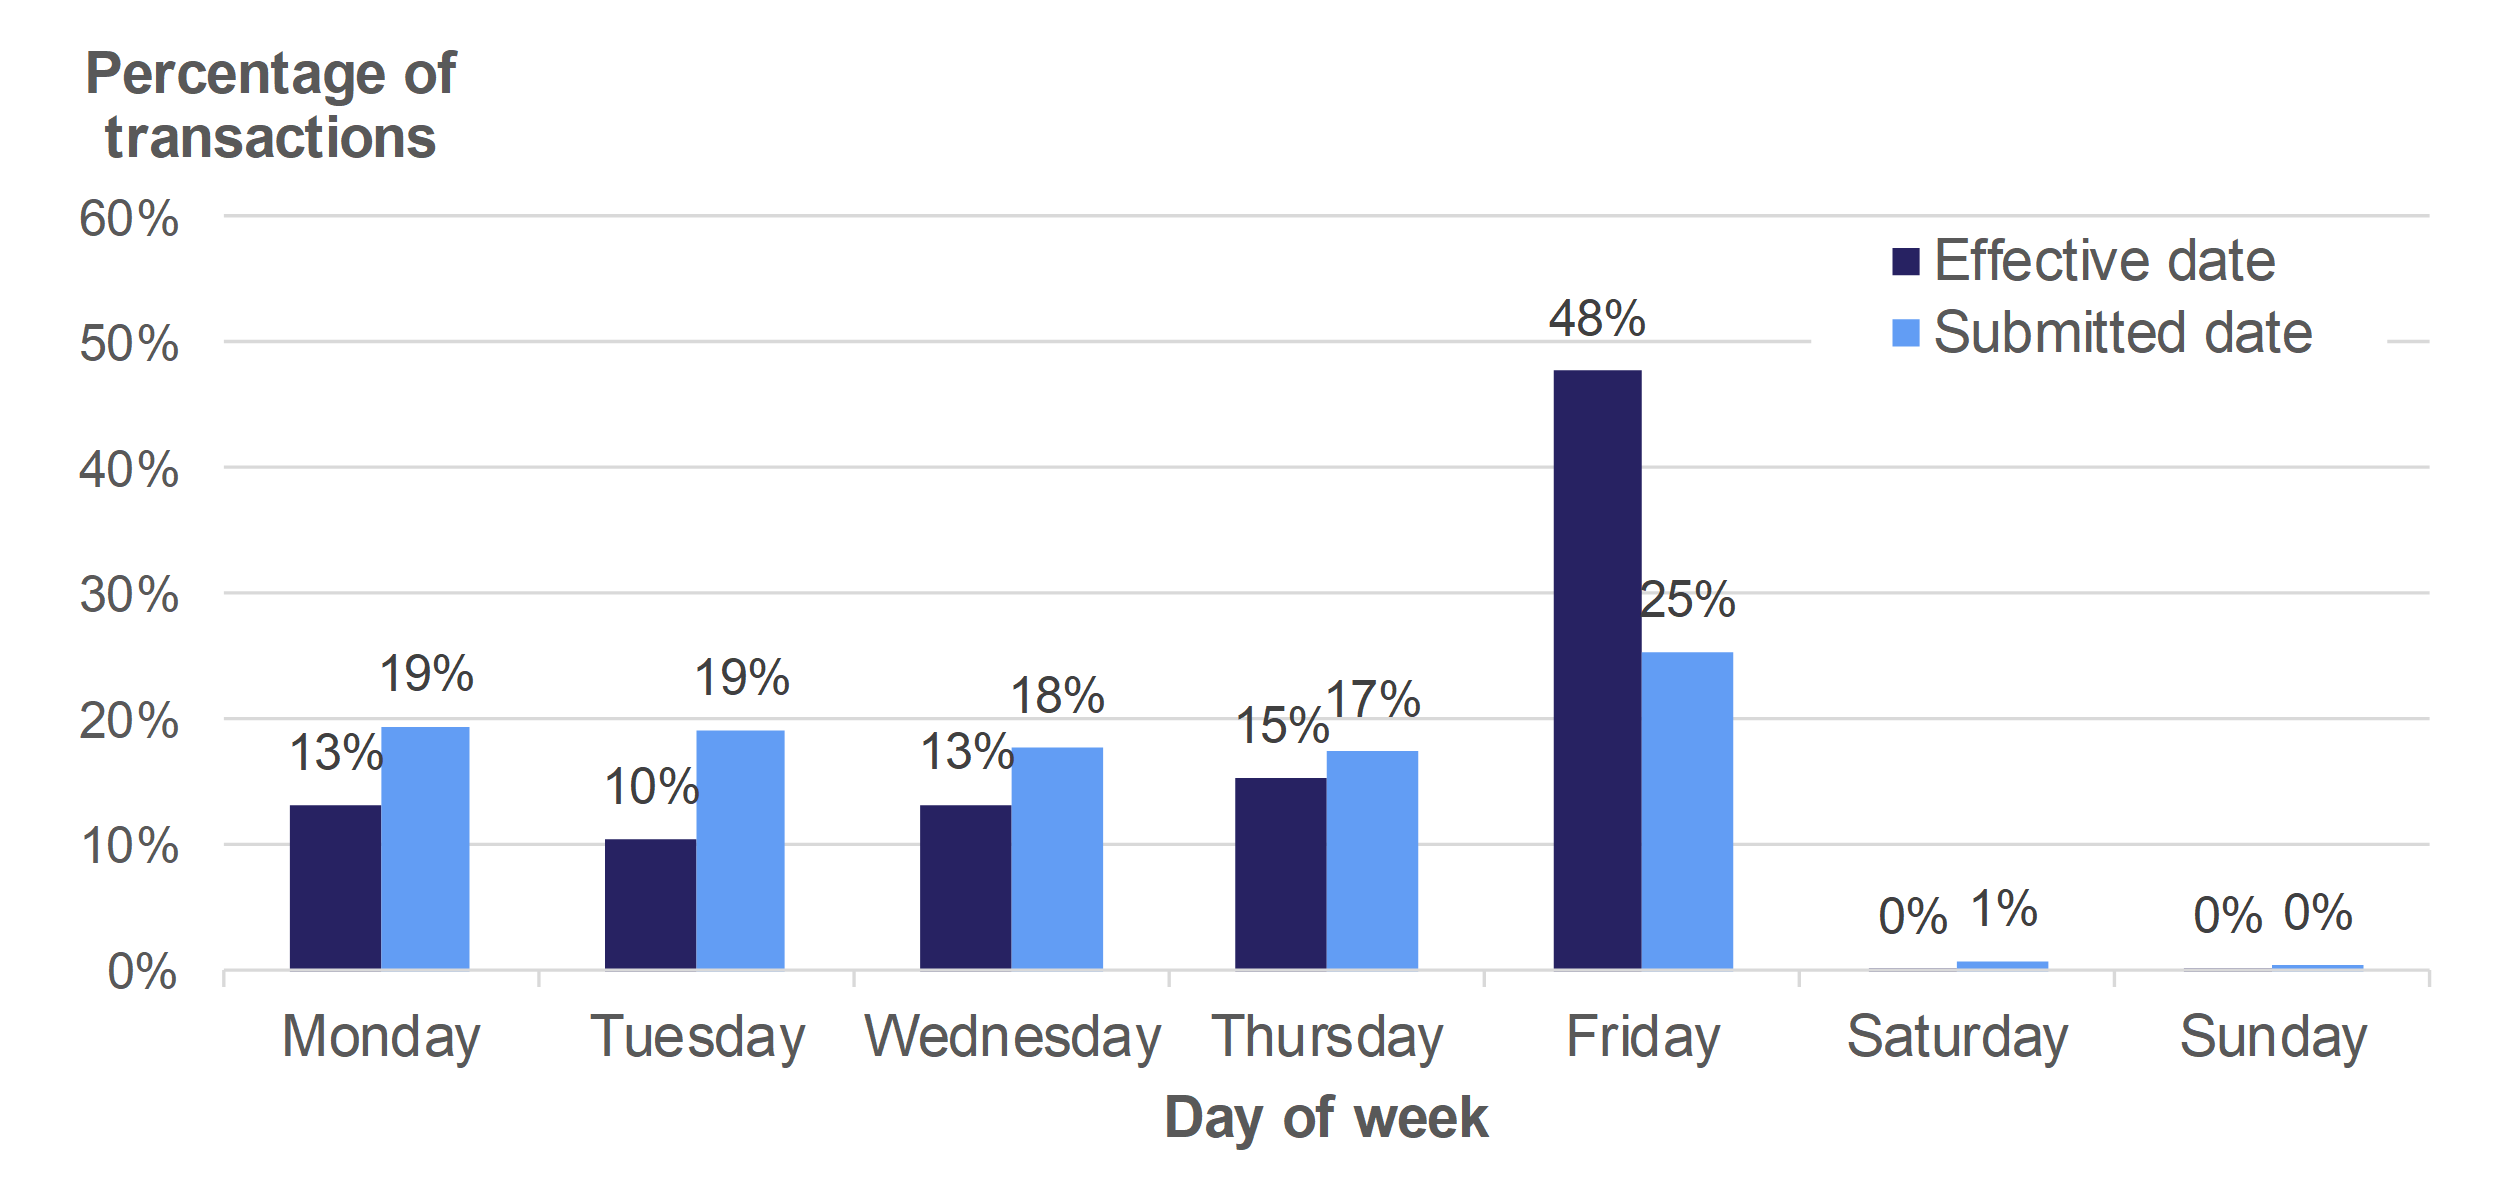
Friday was the most popular day for both transactions to be submitted and for transactions to become effective, with very few on a weekend. This reflects the typical working week of agents who complete LTT returns.
Nearly half of transactions effective in 2018-19 became effective on a Friday. While an above average proportion of returns were submitted on a Friday, the difference is far less pronounced than for effective date. This suggests that returns are generally not submitted on the same day that the transaction completes.