Land Transaction Tax statistics: April to June 2026
Our quarterly Welsh Revenue Authority (WRA) statistics for Land Transaction Tax (LTT). Data includes the number of transactions, tax due and a breakdown for areas within Wales.
In this page
Introduction
Please see the article on intent behind higher rates transactions for Land Transaction Tax (LTT) which accompanies this statistical release. This includes analysis of the third year of data available for higher rate intent. If you have any feedback on this article, please contact us at data@wra.gov.wales.
LTT is payable on residential and non-residential property and land interests purchased in Wales. The tax rates and tax bands for LTT vary depending on the type of transaction.
This statistical release analyses the main trends in transactions and tax due for LTT. The accompanying spreadsheet and our StatsWales datasets contain more detailed data, which we have begun publishing on the new StatsWales website. Please see the Digital and Data blog about the new StatsWales service.
LTT statistics provide relatively timely information on activity in the Welsh property market. The statistics are also used by the Office for Budget Responsibility to forecast LTT revenues.
The glossary defines relevant terms used in this release. Our key quality information describes how LTT statistics satisfy the Code of Practice for Statistics.
LTT statistics are accredited official statistics. In February 2022, the Office for Statistics Regulation independently reviewed and accredited these statistics as complying with the standards of trustworthiness, quality and value in the Code of Practice for Statistics. Accredited official statistics are called National Statistics in the Statistics and Registration Service Act 2007.
Our statistical output policy explains the policies and procedures we have in place for publishing official statistics, including our approach to revisions. We also publish the list of posts which have pre-release access to our statistics, including for LTT.
When comparing LTT statistics over time, users should be aware of previous changes to LTT rates which affect the amount of tax due:
- changes to the nil rate threshold from 27 July 2020 to 31 March 2021
- extension of the temporary tax reduction period from 31 March 2021 to 30 June 2021
- increase to the higher residential rates and changes for non-residential property from 27 December 2022
- changes to main residential rates and bands from 10 October 2022
- increase to the higher residential rates from 11 December 2024
Main points
Residential transactions
- In April to June 2026, residential transactions were up 2% from the same quarter a year earlier and tax due was up 5%.
- In each month from April to June 2026, the monthly numbers of transactions and amount of tax due were higher than the same month a year earlier.
- The share of transactions in the higher property bands has generally been stable in the past 4 years, though was generally increasing in the 3 years before that. The trend has been similar for the contribution of these transactions to overall tax due.
Non-residential transactions
- In April to June 2026, non-residential transactions were down 2% from the same quarter a year earlier with the tax due down 36%.
- In April 2025 to June 2026, the monthly tax due on non-residential transaction was lower than the monthly average (£6.8 million) most of the time.
- In April to June 2026, 69% of non-residential tax due was contributed by transactions where there was a purchase involved of over £1 million, despite only representing 6% of non-residential transactions in this period.
Analysis within Wales (data for the year ending June 2026)
By local authority, higher rates transactions as a percentage of all residential transactions varied from 13% in Monmouthshire to 33% in Merthyr Tydfil.
Several local areas which used to be at the higher end of the distribution of this statistic (up to 2021-22) have seen considerable falls since. Areas which are now highest tend to be where buy-to-let activity is more common, with both Merthyr Tydfil and Blaenau Gwent seeing increases in their percentage in the latest year. Those western and northern areas more typically associated with second home purchases are now much closer to the Welsh average.
The LTT statistics only include properties sold in the past year. They don’t represent the full stock of properties in any local authority.
Statistician’s comment
Dave Jones, a statistician in the WRA, commented on these statistics:
For the year to June, the areas with the highest percentages of residential transactions at the higher rates were several authorities in the South Wales valleys, typically associated with buy-to-let purchases. Some western and northern areas typically associated with second home purchases were closer to the Wales average. This contrasts with several years ago when those western and northern areas were near to or at the top of the distribution.
Nationally in April to June, quarterly residential revenues were higher than the same quarter a year earlier but lower than the all-time high seen in the previous October to December. Quarterly non-residential revenues increased slightly from the previous quarter but remained relatively low compared with previous years.
Analysis at the Wales level
Please note that throughout this release, any use of the term ‘non-residential’ includes transactions that are not wholly residential. That is, those transactions which have both residential and commercial elements.
Users should be aware that if a property or piece of land is sold multiple times within a quarter or a year, it would feature multiple times in the statistics for that period. In April 2025 to March 2026, we estimate that between 2.5% and 3% of transactions involved a piece of land or property which has been sold more than once in the year.
The data presented in this release has been extracted on 20 July 2026 unless otherwise stated.
| Transaction type | Transactions (number) April to June 2026 [provisional] | % change (compared with April to June 2025) [note 2] |
|---|---|---|
| Residential | 12,570 | 2% |
| Of which: higher rates residential | 2,580 | -1% |
| Non-residential | 1,410 | -2% |
| All transactions | 13,970 | 2% |
| Transaction type | Tax due (£ millions) April to June 2026 [provisional] | % change (compared with April to June 2025) [note 2] |
|---|---|---|
| Residential | 72.1 | 5% |
| Of which: Additional revenue from higher rates [note 1] | 24.2 | -2% |
| Non-residential | 16.1 | -36% |
| All transactions | 88.2 | -6% |
Source: LTT statistics, by transaction type, transaction description, measure and effective date on StatsWales (includes data back to April 2018, not presented above)
Note 1: This item only includes the additional revenue from higher rate transactions. This item does not include the main rate component of higher rate transactions.
Note 2: Estimates for April to June 2025 were made in July 2025.
Largely due to seasonal patterns in the property market, it can be helpful to compare the current period with data from the same period a year earlier. Therefore, when comparing April to June 2026 on a like-for-like basis with April to June 2025:
- the total number transactions rose by 2% and the tax due on those transactions fell by 6%
- residential transactions increased by 2% and the tax due on those transactions increased by 5%
- of which, higher rates transactions fell by 1%
- additional revenue from higher rates residential transactions fell by 2%
- non-residential transactions fell by 2% and the tax due from non-residential transactions decreased by 36%
Figure 1: Weekly number of transactions submitted to the WRA
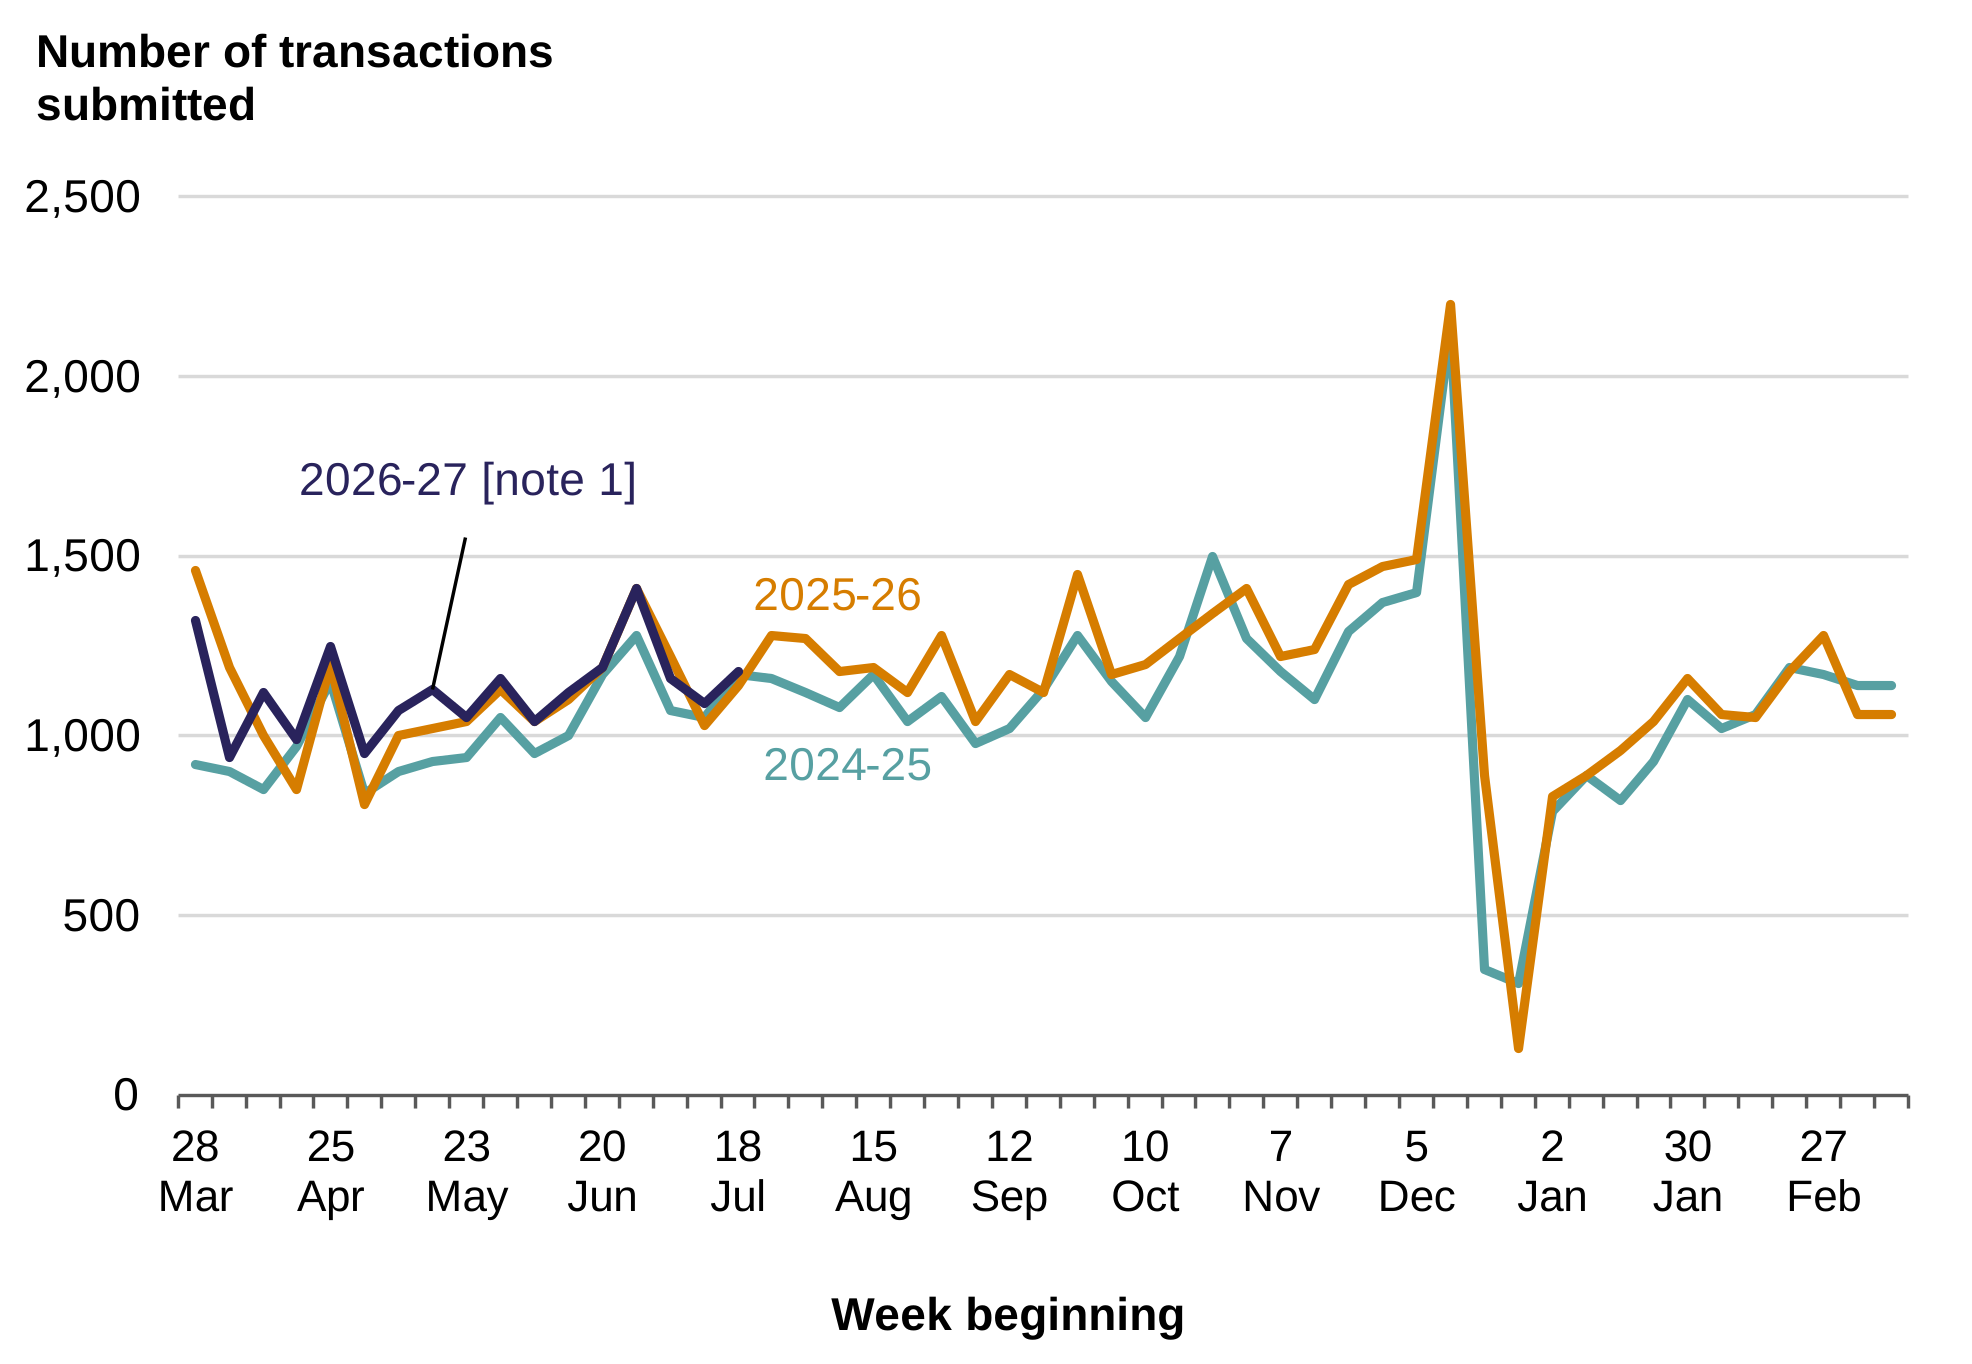
Description of Figure 1: The line chart shows the weekly number of transactions submitted to the WRA had a sharp drop during holidays. Generally, the weekly numbers of transactions submitted since April 2025 were higher than the same week in the previous year.
Source: Weekly number of transactions submitted to the WRA (Open Document Spreadsheet, 168 Kb) (includes data back to April 2018, not presented above)
Note 1: This includes a small number of transactions effective in July 2026.
Figure 1 above shows the total number of transactions submitted to the WRA in each 7-day period for the latest 3 financial years. These periods begin on a Saturday and end on the following Friday. For example, the point ’29-Mar’ in 2025-26 shows the number of residential and non-residential transactions submitted to the WRA from 29 March to 4 April 2025 (inclusive). The actual dates differ slightly in the previous year. For example, the equivalent week in the previous year ran from 30 March to 5 April 2024 (inclusive).
Figure 1 shows data by submitted date up to and including 24 July 2026. This differs from effective date, which is the date we use for most analysis in this release and for which we extract data as at a particular date (20 July 2026 in this release).
Figure 2: Number of transactions, by type and month the transaction was effective
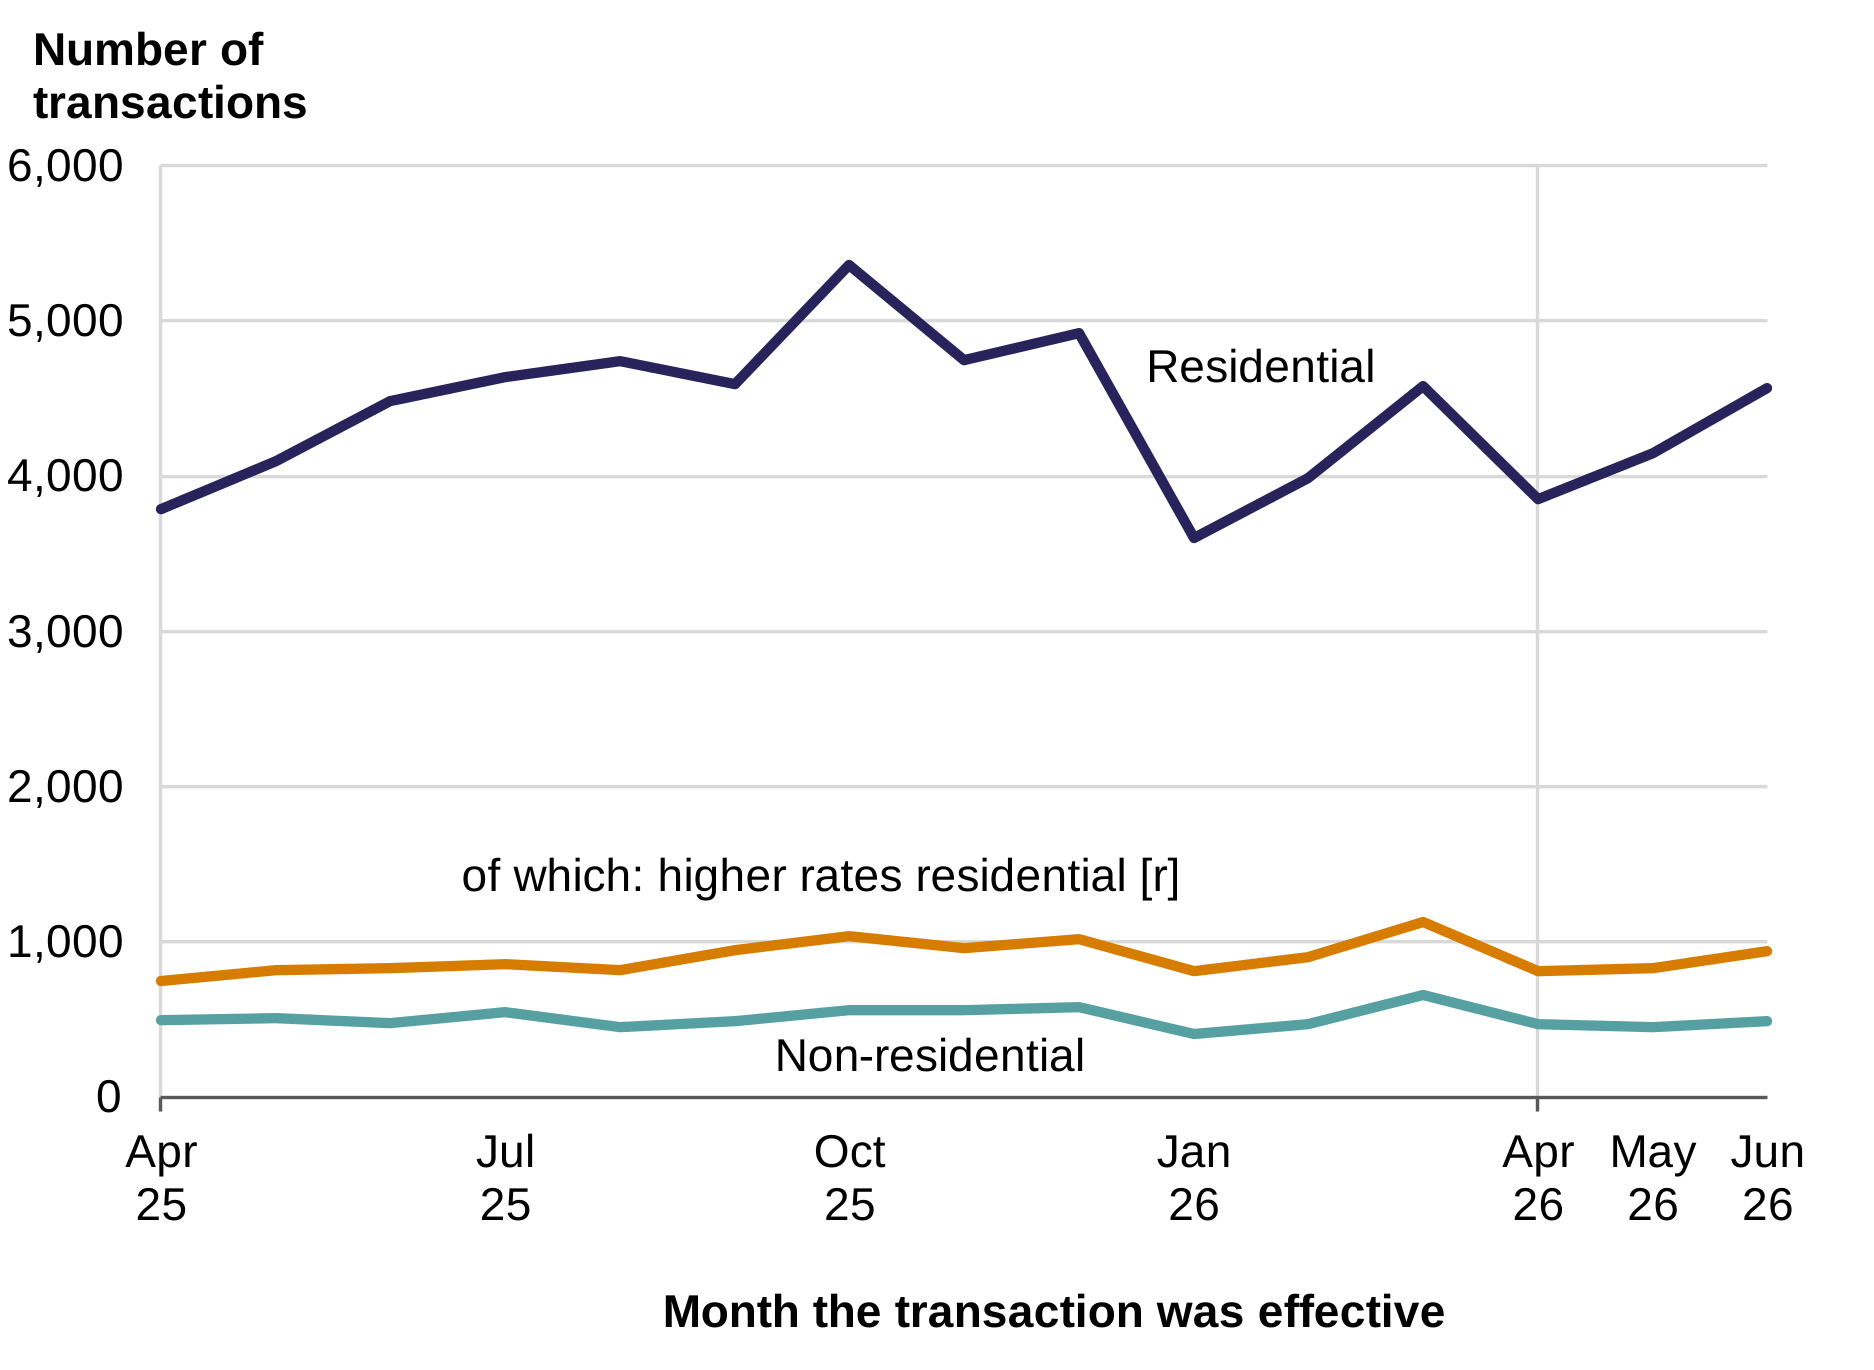
Description of Figure 2: The line chart shows that from April 2026, the monthly number of residential transactions was higher than the same month a year earlier. Non-residential transactions were at a lower level and fluctuated with large rises seen in March 2026 from the previous month.
Source: LTT statistics, by transaction type, transaction description, measure and effective date on StatsWales (includes data back to April 2018, not presented above)
[p] Values for June 2026 are provisional and will be revised in a future publication.
[r] Values for May 2026 are revised in this publication. Higher rates residential transactions for earlier periods have been revised downwards due to higher rate refunds being claimed.
In a typical year, the number of residential transactions by effective month vary somewhat. There is general seasonality with more transactions in the summer and autumn months, although some fluctuation is due to there being five Fridays in particular months rather than four, with Friday being the most common day of the week on which transactions come into effect.
For each month from April to June 2026, the number of residential transactions was higher than the same month in the previous year.
For non-residential transactions, in March each year we see an increase from the previous month (February). This may generally be due to non-residential leases to be renewed at the end of the financial year. However, in March 2026, the increases in non-residential transactions over the previous month were mainly due to purchases and the reasons for this are unclear.
Figure 3: Tax due on transactions, by month transaction was effective [£ million]
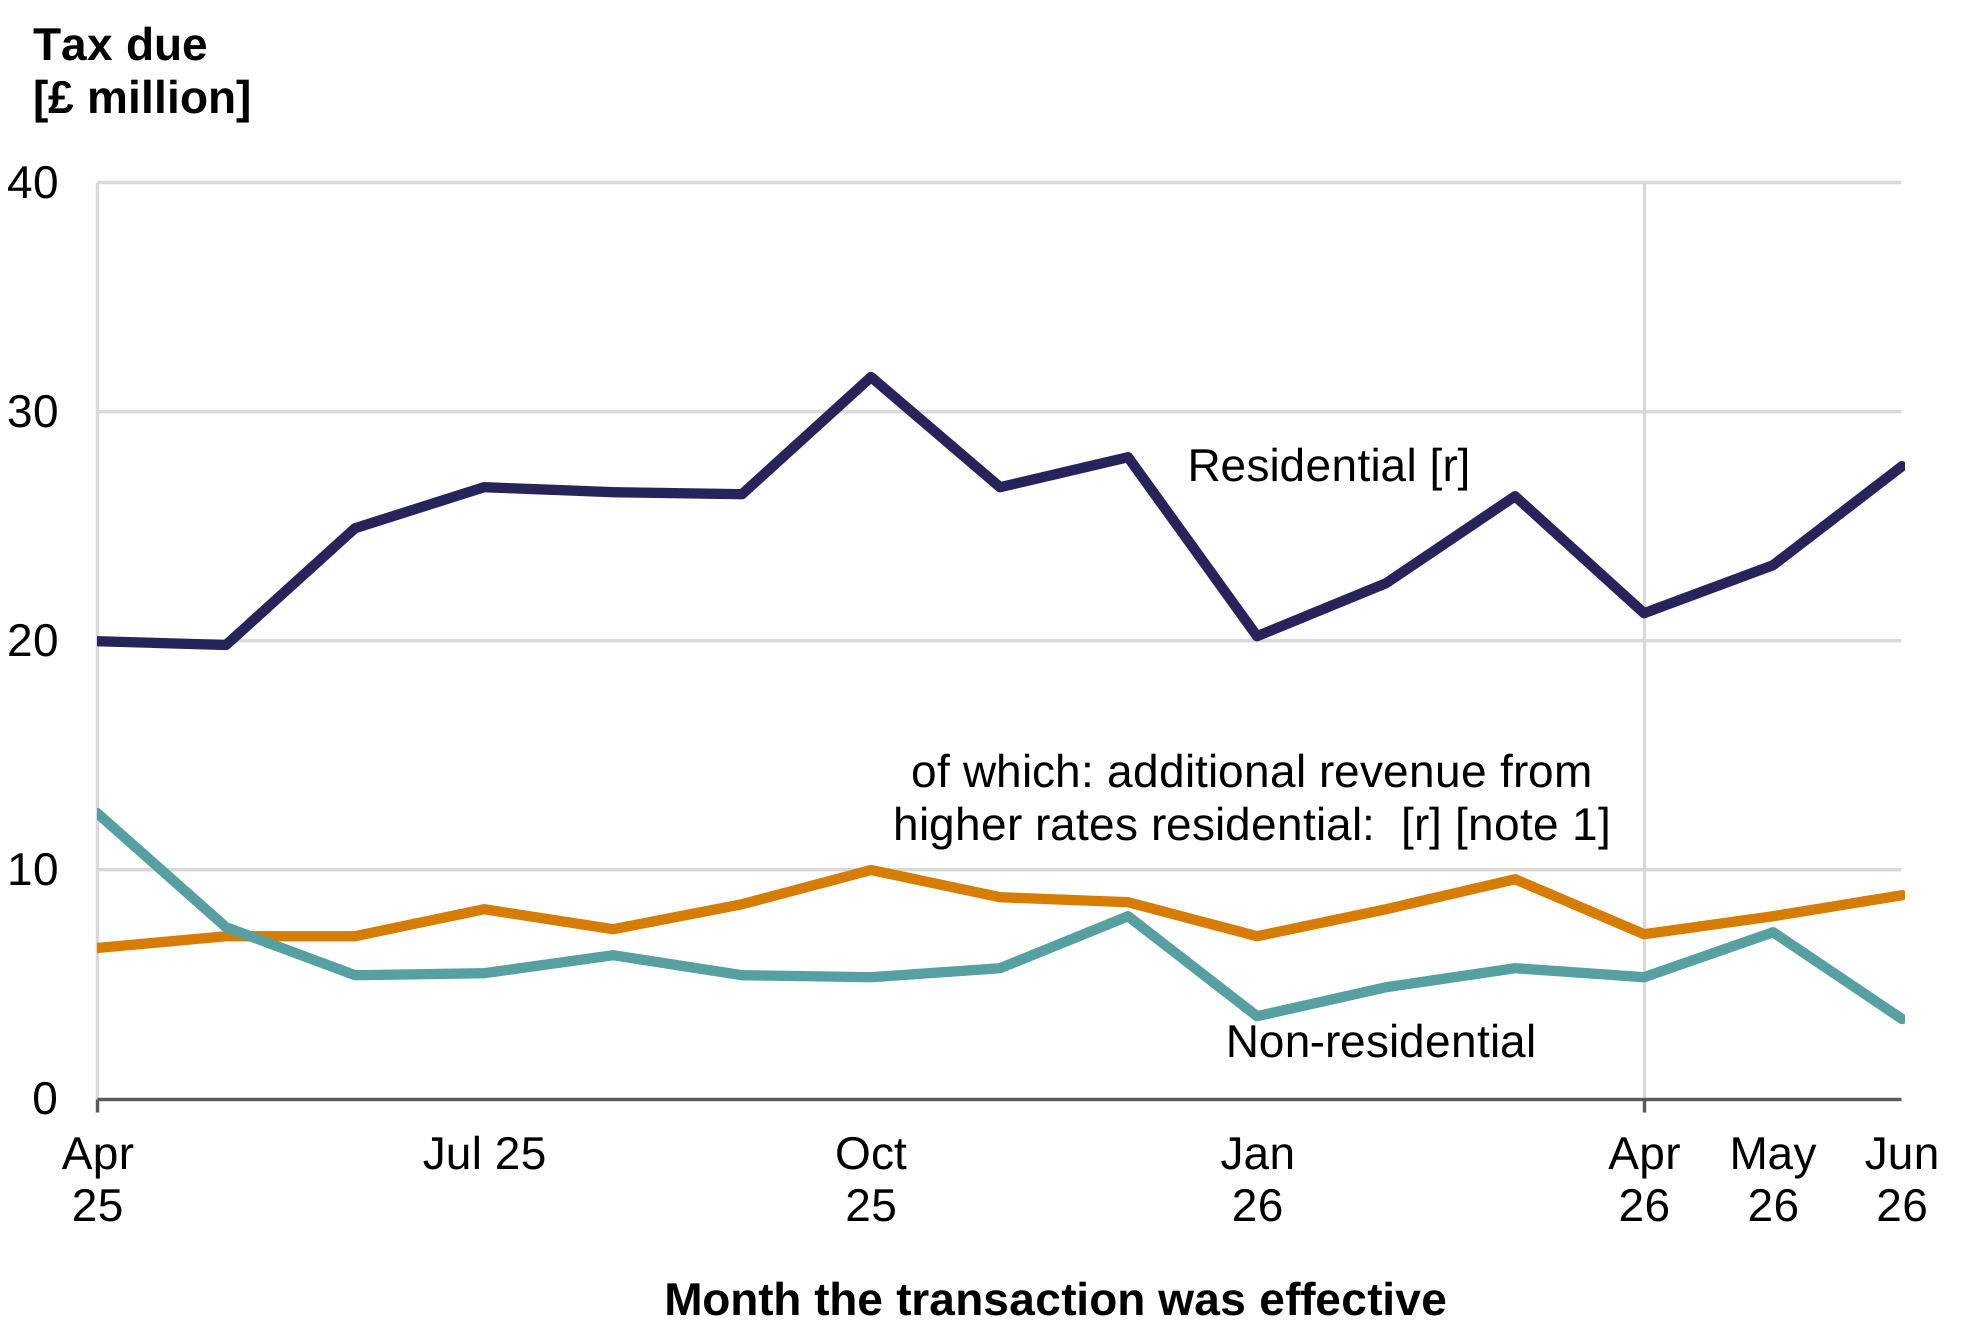
Description of Figure 3: The line chart shows that from April 2026, the monthly amount of tax due on residential transactions was higher than the same month in the previous year. From April 2025 to June 2026, the monthly non-residential tax due was lower than the monthly long-term average (£6.8 million) most of the time. The non-residential tax due can vary considerably from month to month, often influenced by a small number of high value transactions.
Source: LTT statistics, by transaction type, transaction description, measure and effective date on StatsWales (includes data back to April 2018, not presented above)
[Note 1] This item only includes the additional revenue from higher rate transactions. This item does not include the main rate component of higher rate transactions.
[p] Values for June 2026 are provisional and will be revised in a future publication.
[r] Residential values for May 2026 and earlier have been revised downwards in this publication. This is to account for refunds of the higher rates of residential tax being paid out.
Residential transactions by value
Figures 4 and 5 below shows quarterly trends in the number of residential transactions and amount of tax due in each tax band. There are six residential tax bands. We have combined the largest two bands here to show results for properties purchased for more than £750,000.
Transactions below £400,000 have been split into two categories based on the nil rate threshold for main rates transactions that was in place at the relevant times in the past five years.
For higher rates transactions, the nil rate threshold has been static over the last five years at £180,000. However, the nil rate threshold for main rate transactions has varied over time and is currently at £225,000. For our analysis, we have grouped these transactions as ‘up to and including the nil rate threshold’ based on thresholds in effect at the time of the transaction. For the full series of the nil rate thresholds, please see Land Transaction Tax rates and bands.
Figure 4: Number of residential transactions, by residential tax band and quarter the transaction was effective
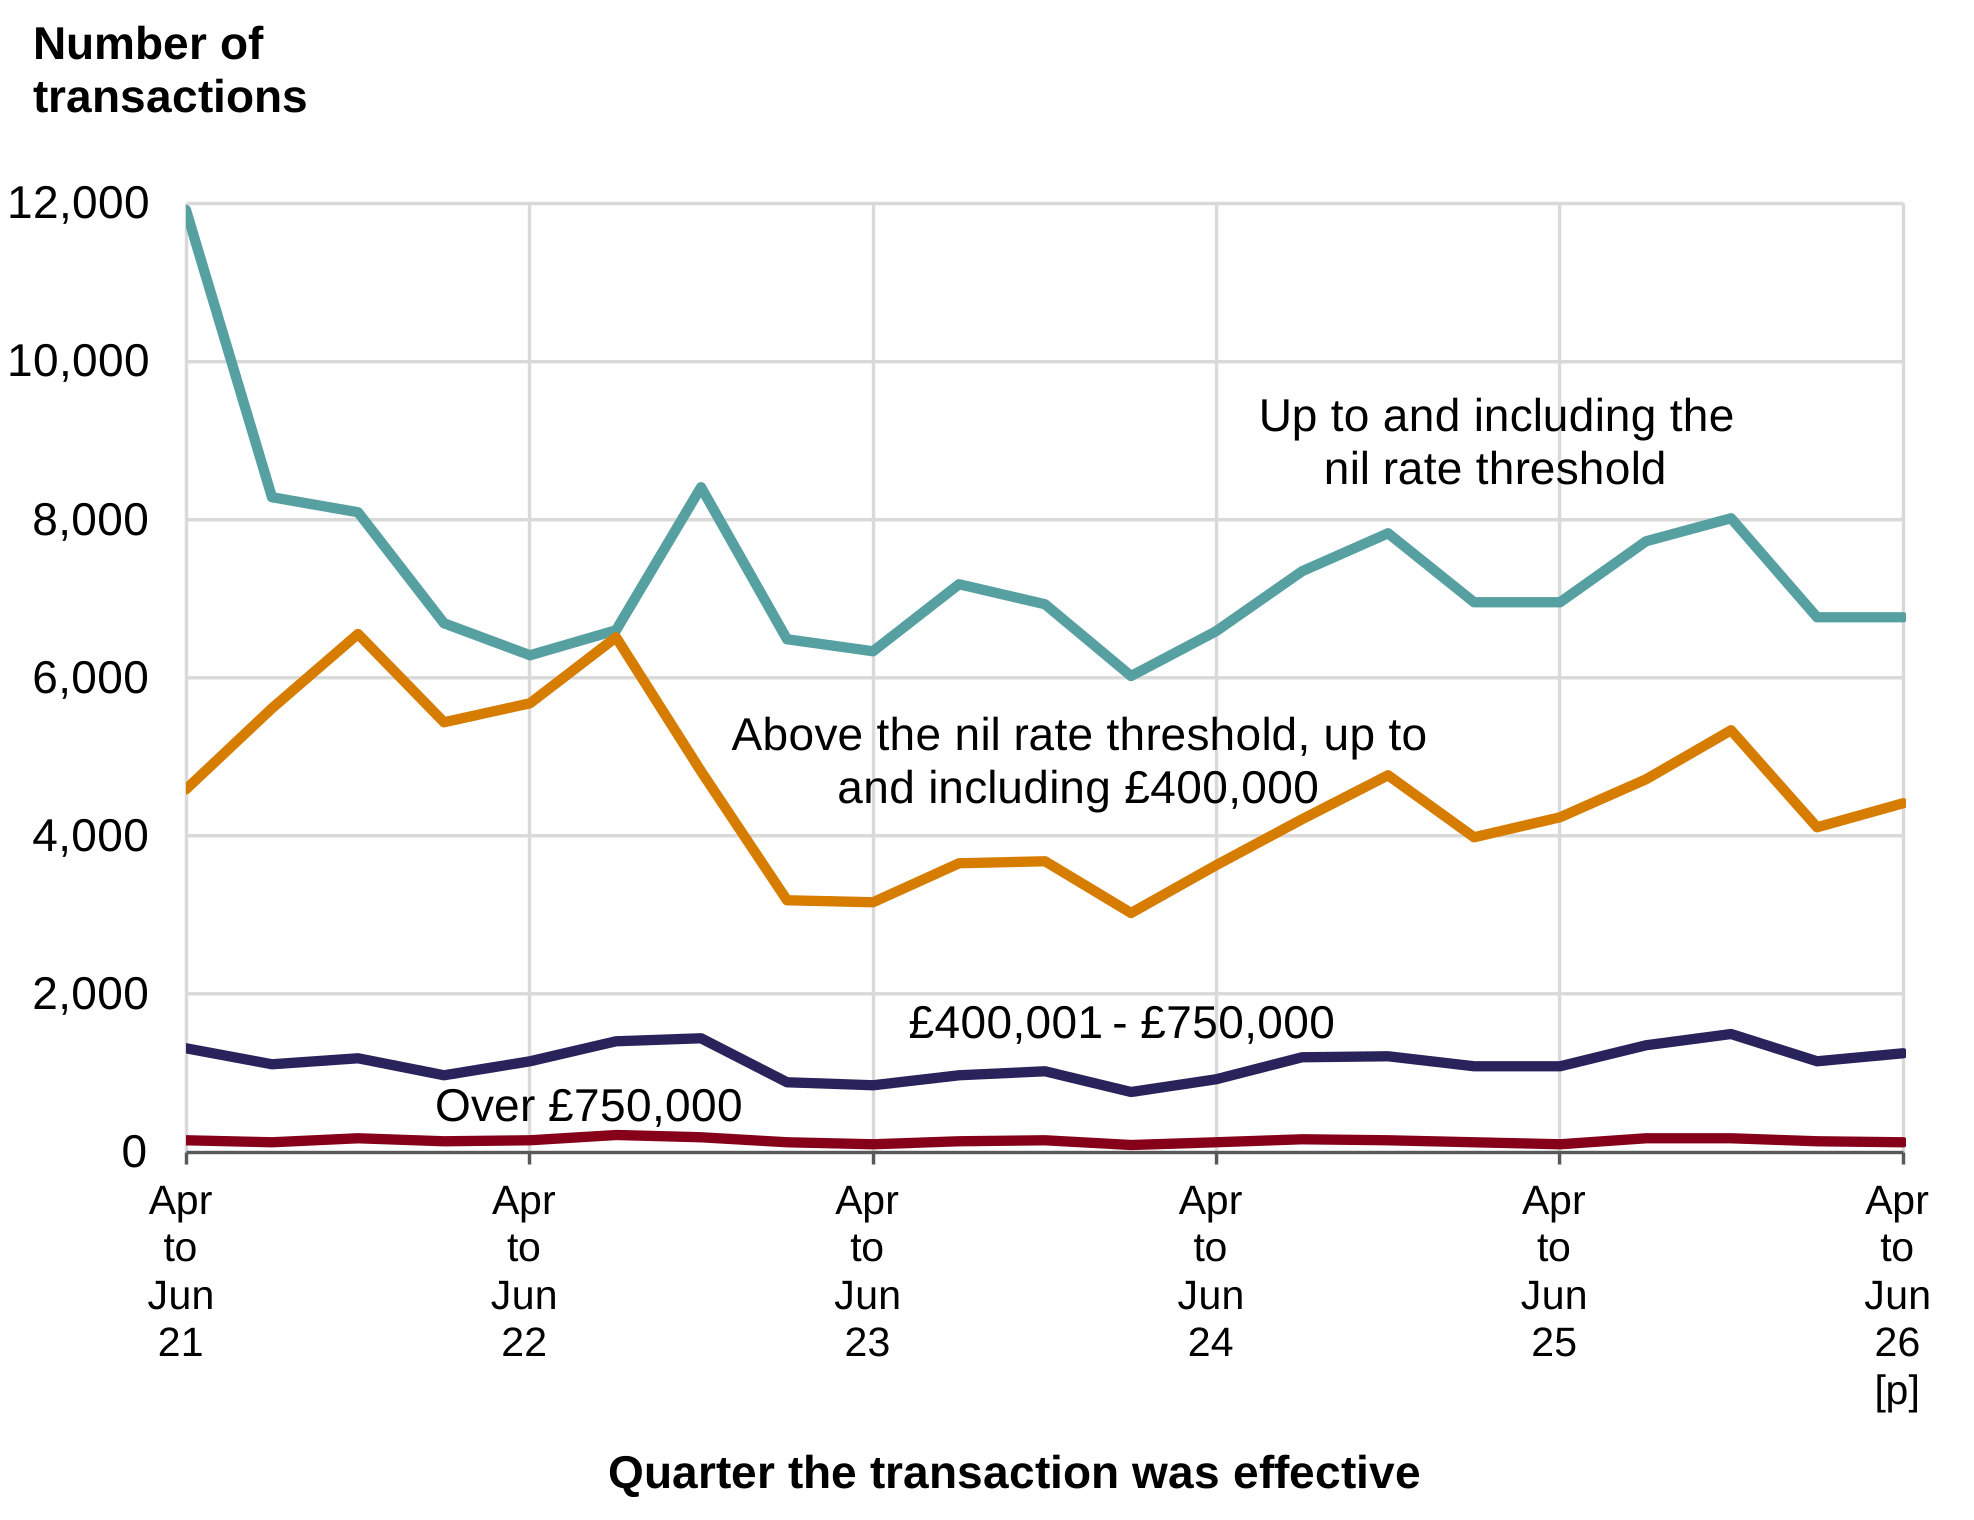
Description of Figure 4: The line chart shows that the number of residential transactions in the bands ‘up to and including the nil rate threshold’ and ‘above the nil rate threshold up to and including £400,000’ generally followed a seasonal pattern in the past several years, with higher values in the July to September and October to December quarters than at other times of year. In October to December 2025, the quarterly number of transactions in the ‘£400,001 to £750,000‘ band was highest seen to date with lower values seen in the latest 2 quarters. The quarterly number of transactions in the ‘over £750,000’ band was highest in July to September 2022, and fluctuating at a lower level since then.
Source: Residential LTT statistics, by transaction type, transaction value, measure and effective date on StatsWales (includes data back to April 2018, not presented above)
[p] The values for April to June 2026 are provisional and will be revised in a future publication.
Figure 5: Tax due on residential transactions, by residential tax band and quarter the transaction was effective [£ million]
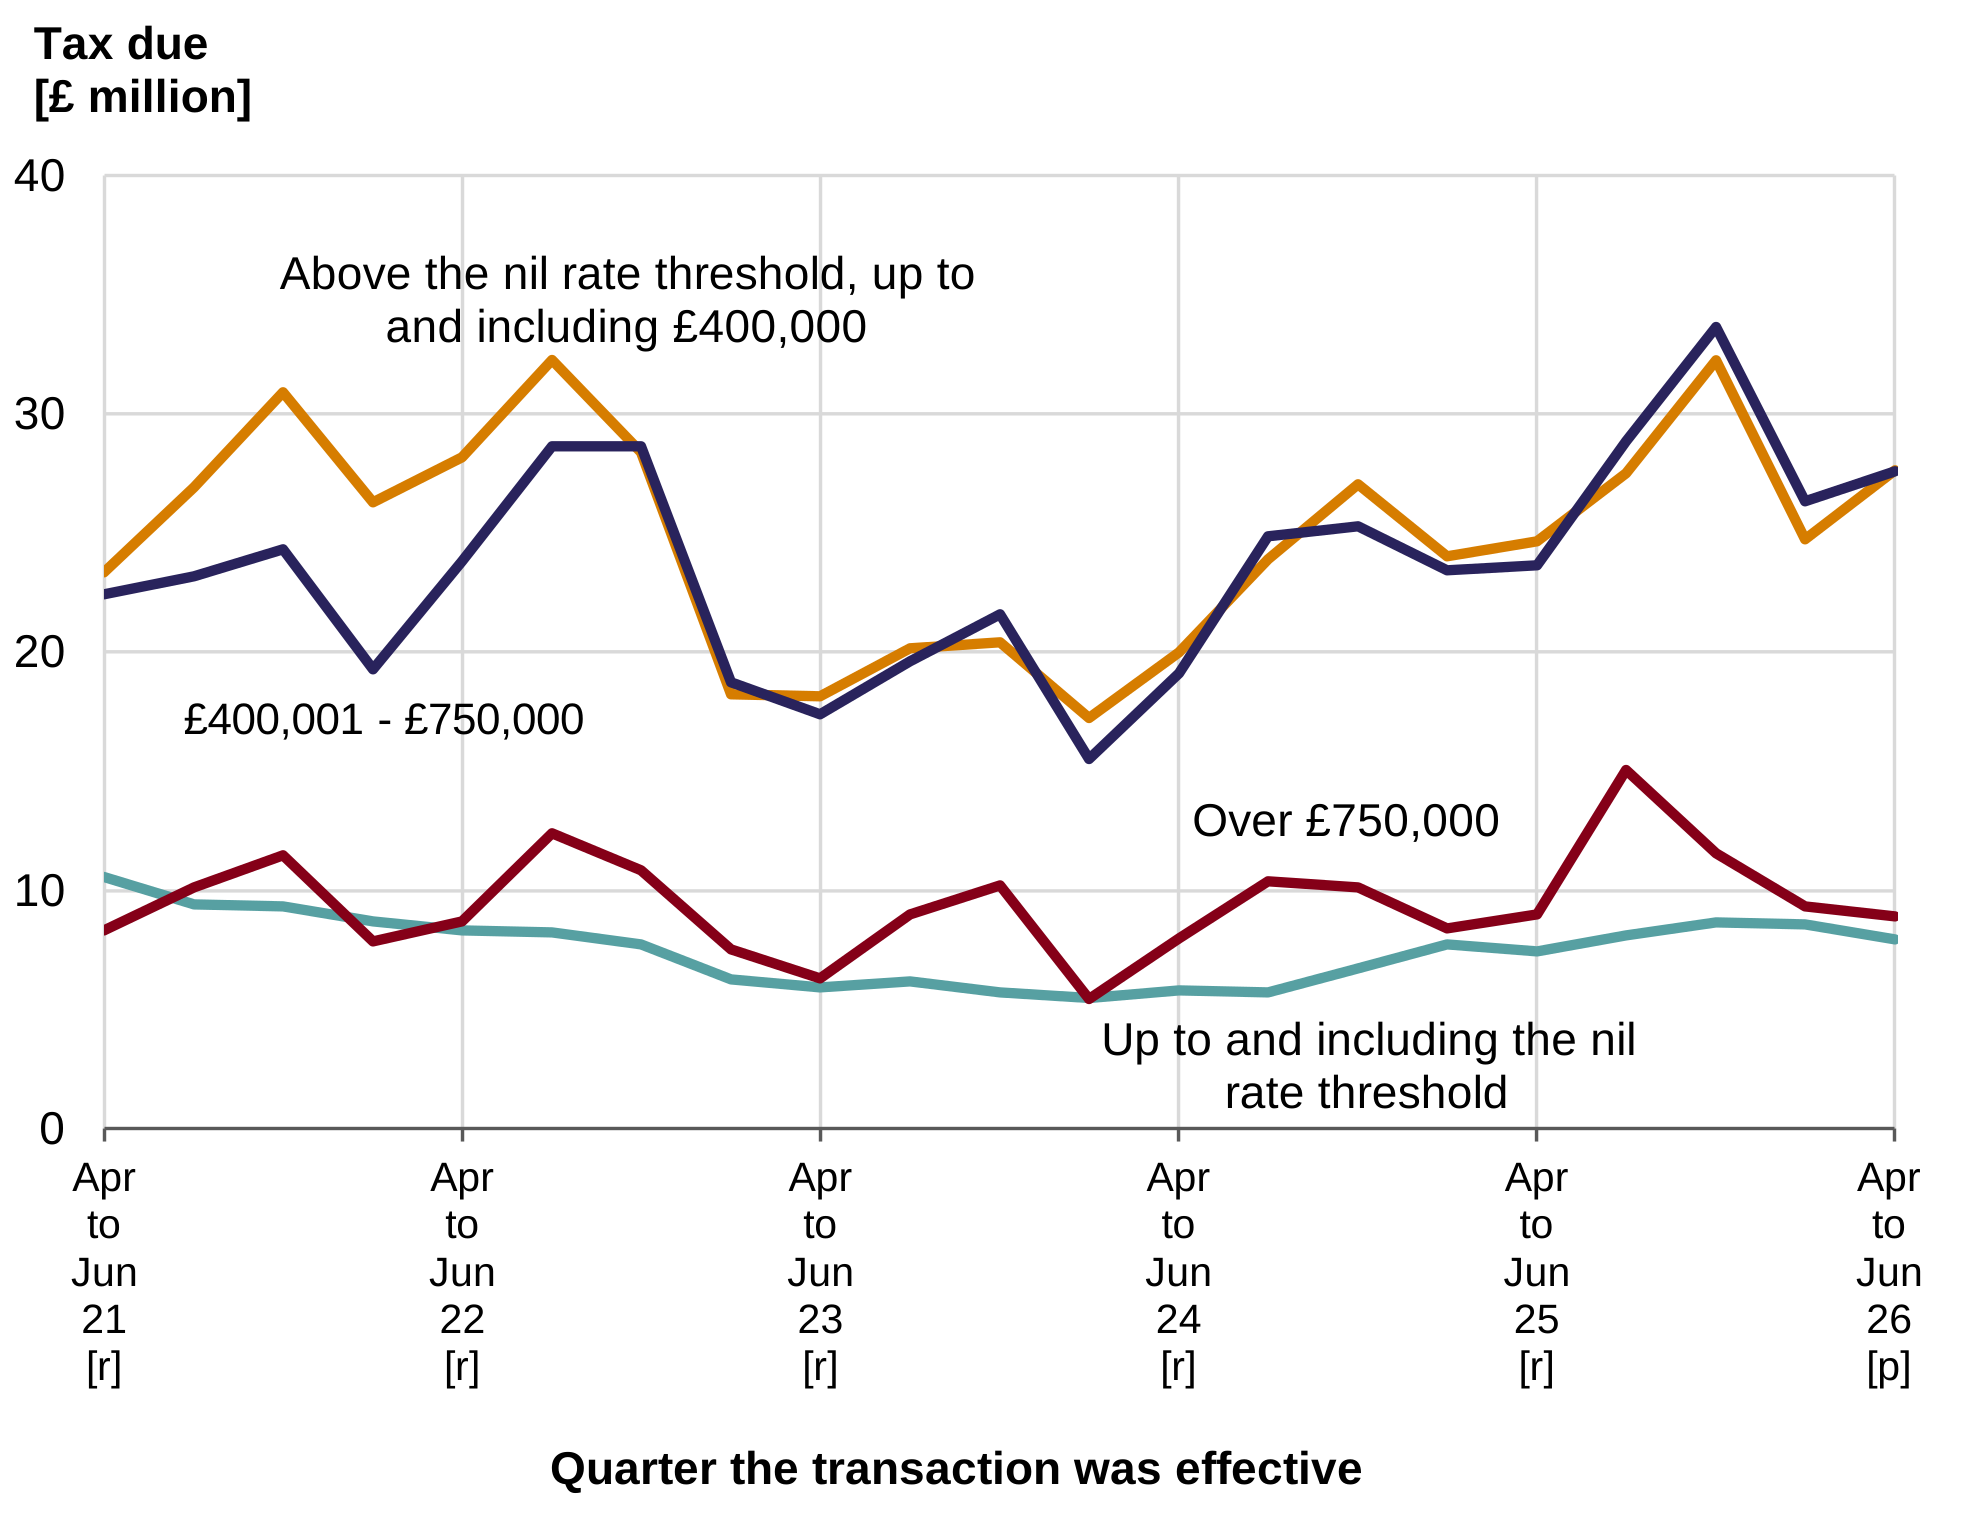
Description of Figure 5: The line chart shows that the quarterly amounts of tax due in the ‘above the nil rate threshold, up to and including £400,000’ and ‘£400,001 to £750,000’ bands followed similar trends in the past several years, generally increasing since 2023 but with seasonal fluctuations. For the ‘over £750,000’ band, July to September 2025 and October to December 2025 saw the highest and second highest amounts of tax due respectively, before falls in the latest 2 quarters.
Source: Residential LTT statistics, by transaction type, transaction value, measure and effective date on StatsWales (includes data back to April 2018, not presented above)
[p] Values for April to June 2026 are provisional and will be revised in a future publication.
[r] Values for January to March 2026 and earlier have been revised downwards in this publication. This is to account for refunds of the higher rates of residential tax being paid out.
Figure 6: Percentage of residential transactions and tax due in each tax band, April to June 2026 [provisional]
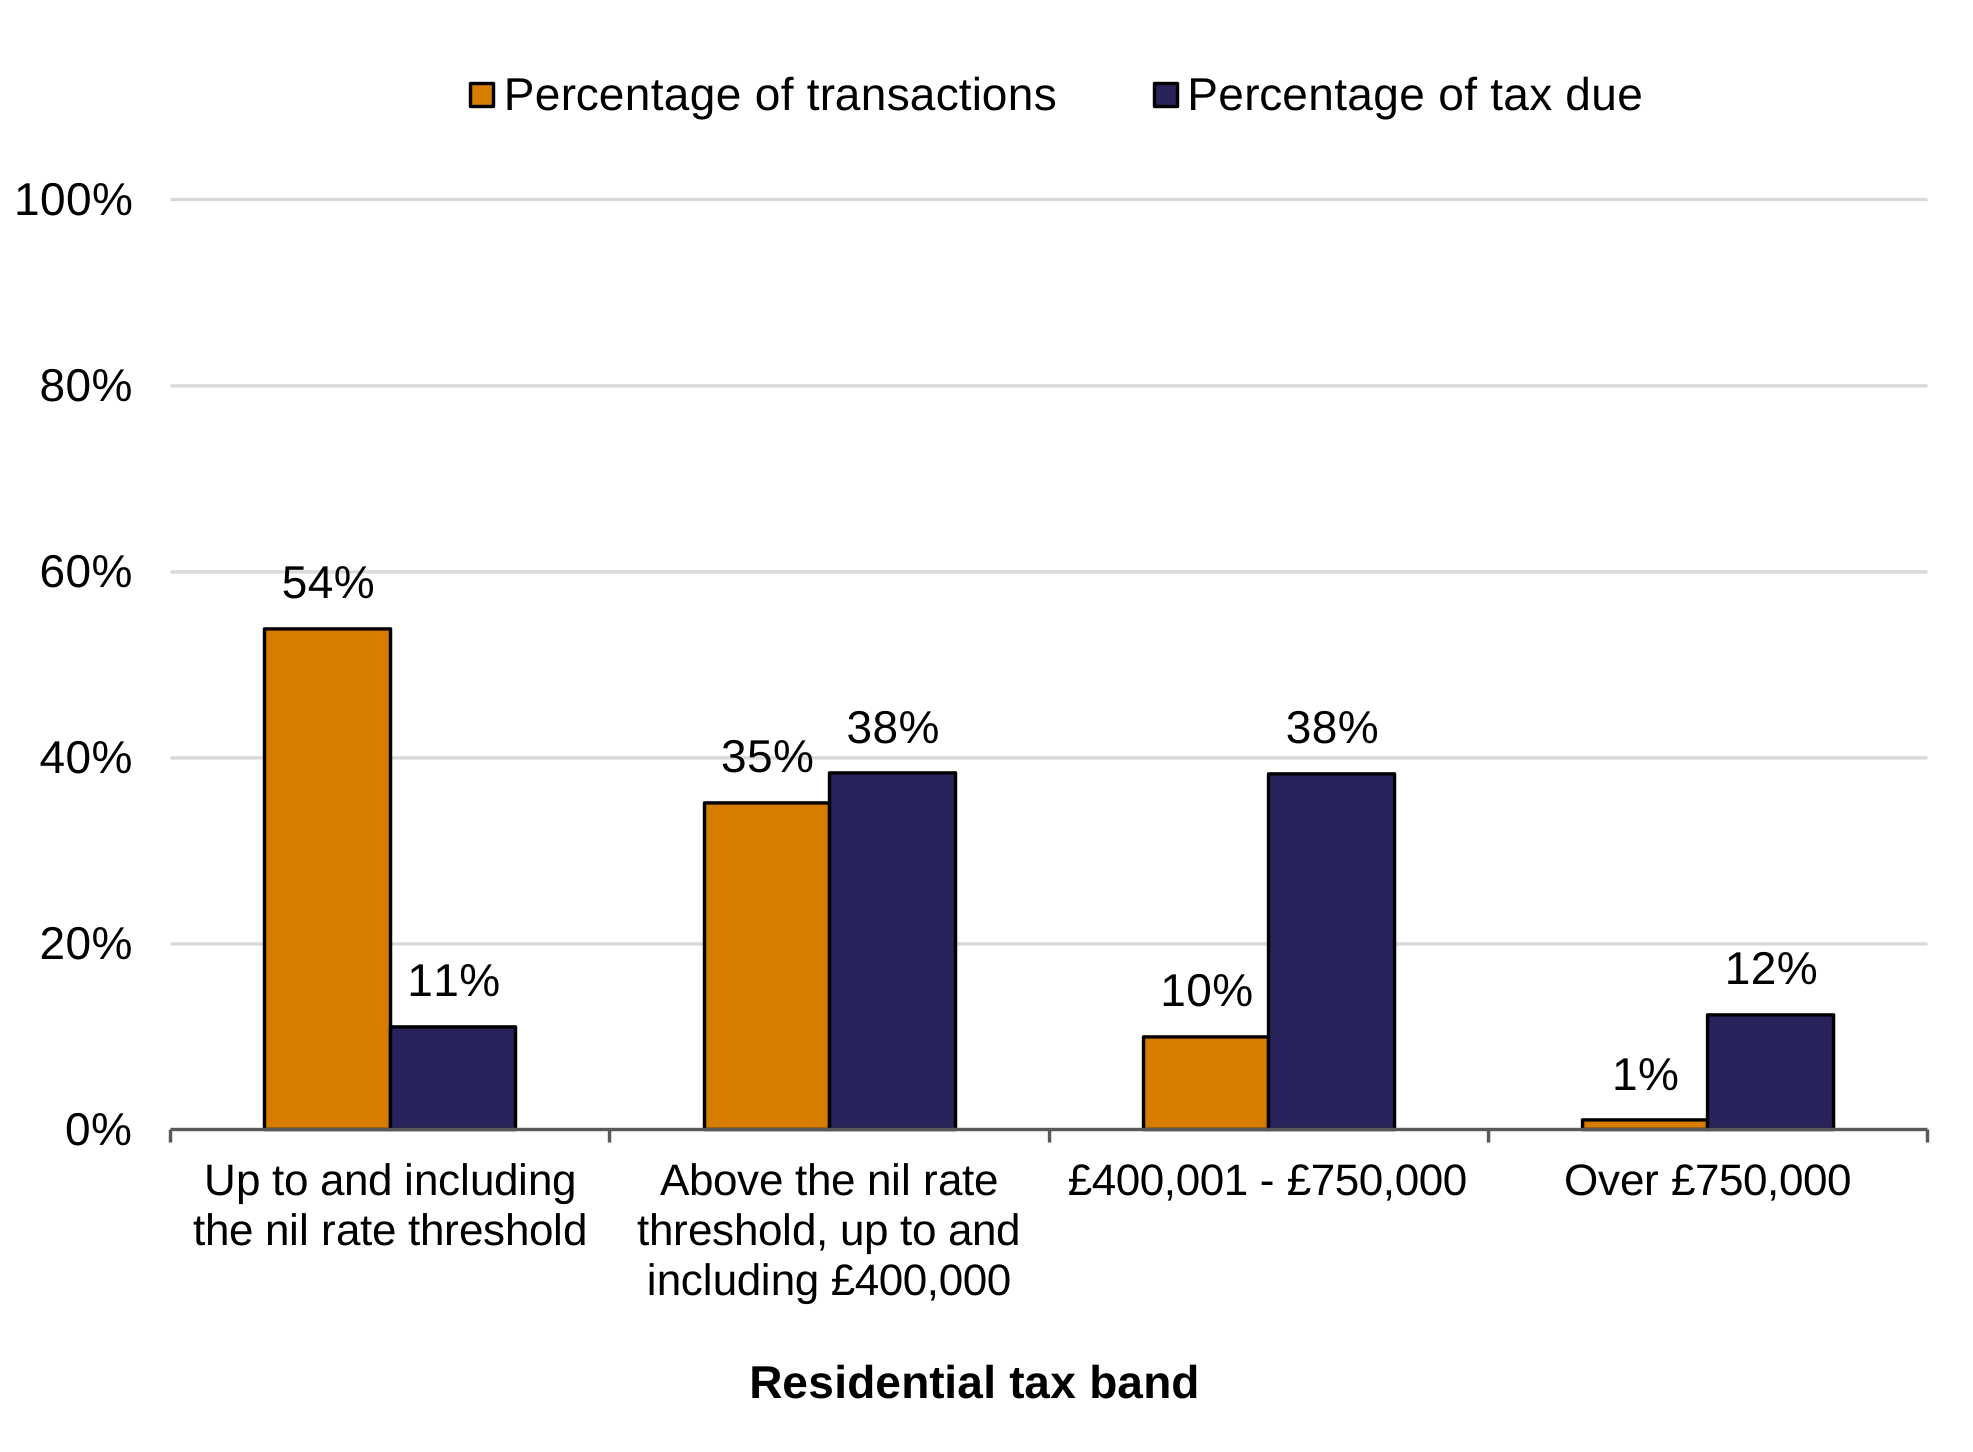
Description of Figure 6: The bar chart shows that in April to June 2026, residential transactions which were up to and including the nil rate threshold accounted for 54% of all transactions and 11% of the total tax due. Meanwhile, the 1% of transactions which were over £750,000 accounted for 12% of the total tax due.
Source: Residential LTT statistics, by transaction type, transaction value, measure and effective date on StatsWales (includes data back to April 2018, not presented above)
Figure 6 shows that in April to June 2026, 54% of residential transactions were up to and including the nil rate threshold (defined below Figure 4). Percentages for previous quarters varied between 45% and 71%. In April to June 2026, the transactions for this band accounted for 11% of residential tax due. This is lower than the 22% seen in April to June 2018 (not shown in Figure 6), generally decreasing in the following 4 years to 2022 though remaining more stable since then.
In April to June 2026, the 1% of residential transactions with a value over £750,000 contributed 12% of residential tax due. This was lower than the high of 19% for tax seen in July to September 2025. For previous quarters, the percentage of transactions in this category remained small. For residential tax due, the percentages generally rose from the 4% seen in April to June 2018 for the following 3 years (not shown in Figure 6) though remaining more stable since then.
The percentage of transactions with a value £400,001 to £750,000 generally rose in most quarters, from 3% in April to June 2018 to 10% in April to June 2026, though has been more stable in the past 4 years. Similarly, the percentage of residential tax due contributed by these transactions generally rose from 24% in April to June 2018 to 39% in October to December 2025, the highest quarterly figure seen to date, before falling slightly to 38% in the latest 2 quarters.
Non-residential transactions by value
For each tax band, Figures 7 and 8 show the quarterly trends in the number of non-residential transactions and tax due. There are 4 tax bands for the non-rental value. We have combined the smallest 2 bands here to show results for properties with a non-rental value less than £250,000.
Figure 7: Number of non-residential transactions, by value and quarter the transaction was effective [Note 1]
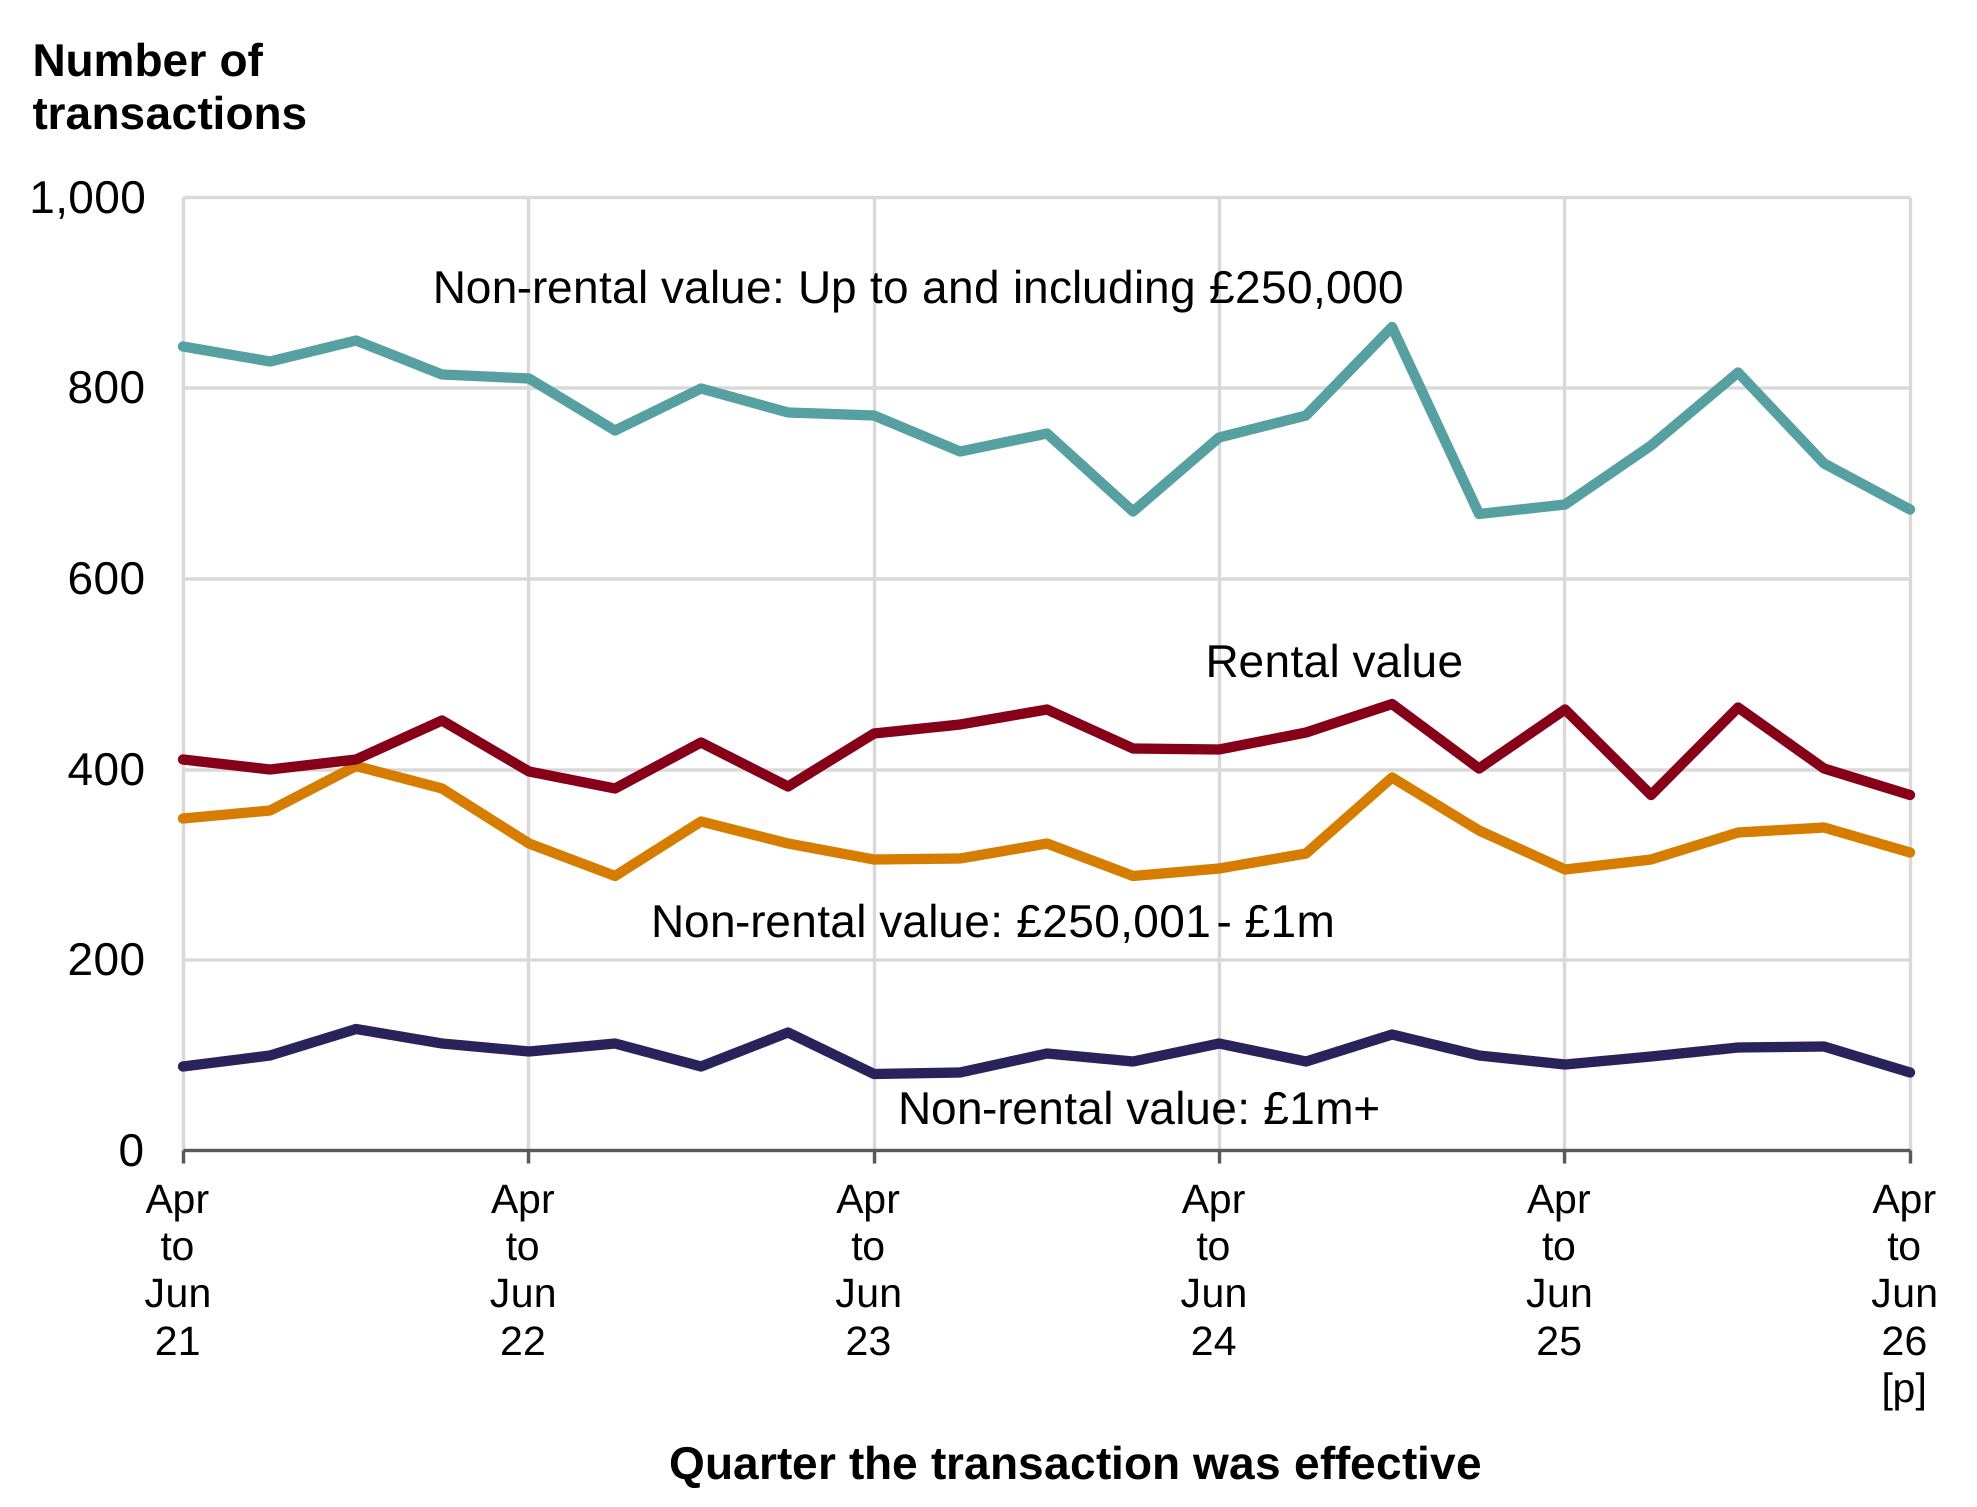
Description of Figure 7: The line chart shows that the quarterly numbers of non-residential transactions in different value bands have fluctuated small amounts in the past 5 years, with some larger peaks in October to December 2024 and to a lesser extent, October to December 2025.
Source: Non-residential LTT statistics, by transaction value, measure and effective date on StatsWales (includes data back to April 2018, not presented above)
Note 1: A small number of newly granted leases have both a premium paid and a rental value. Therefore these transactions are included twice in Figure 7, under both the non-rental value and the rental value.
[p] The values for April to June 2026 are provisional and will be revised in a future publication.
Figure 8: Tax due on non-residential transactions, by value and quarter the transaction was effective [£ million]
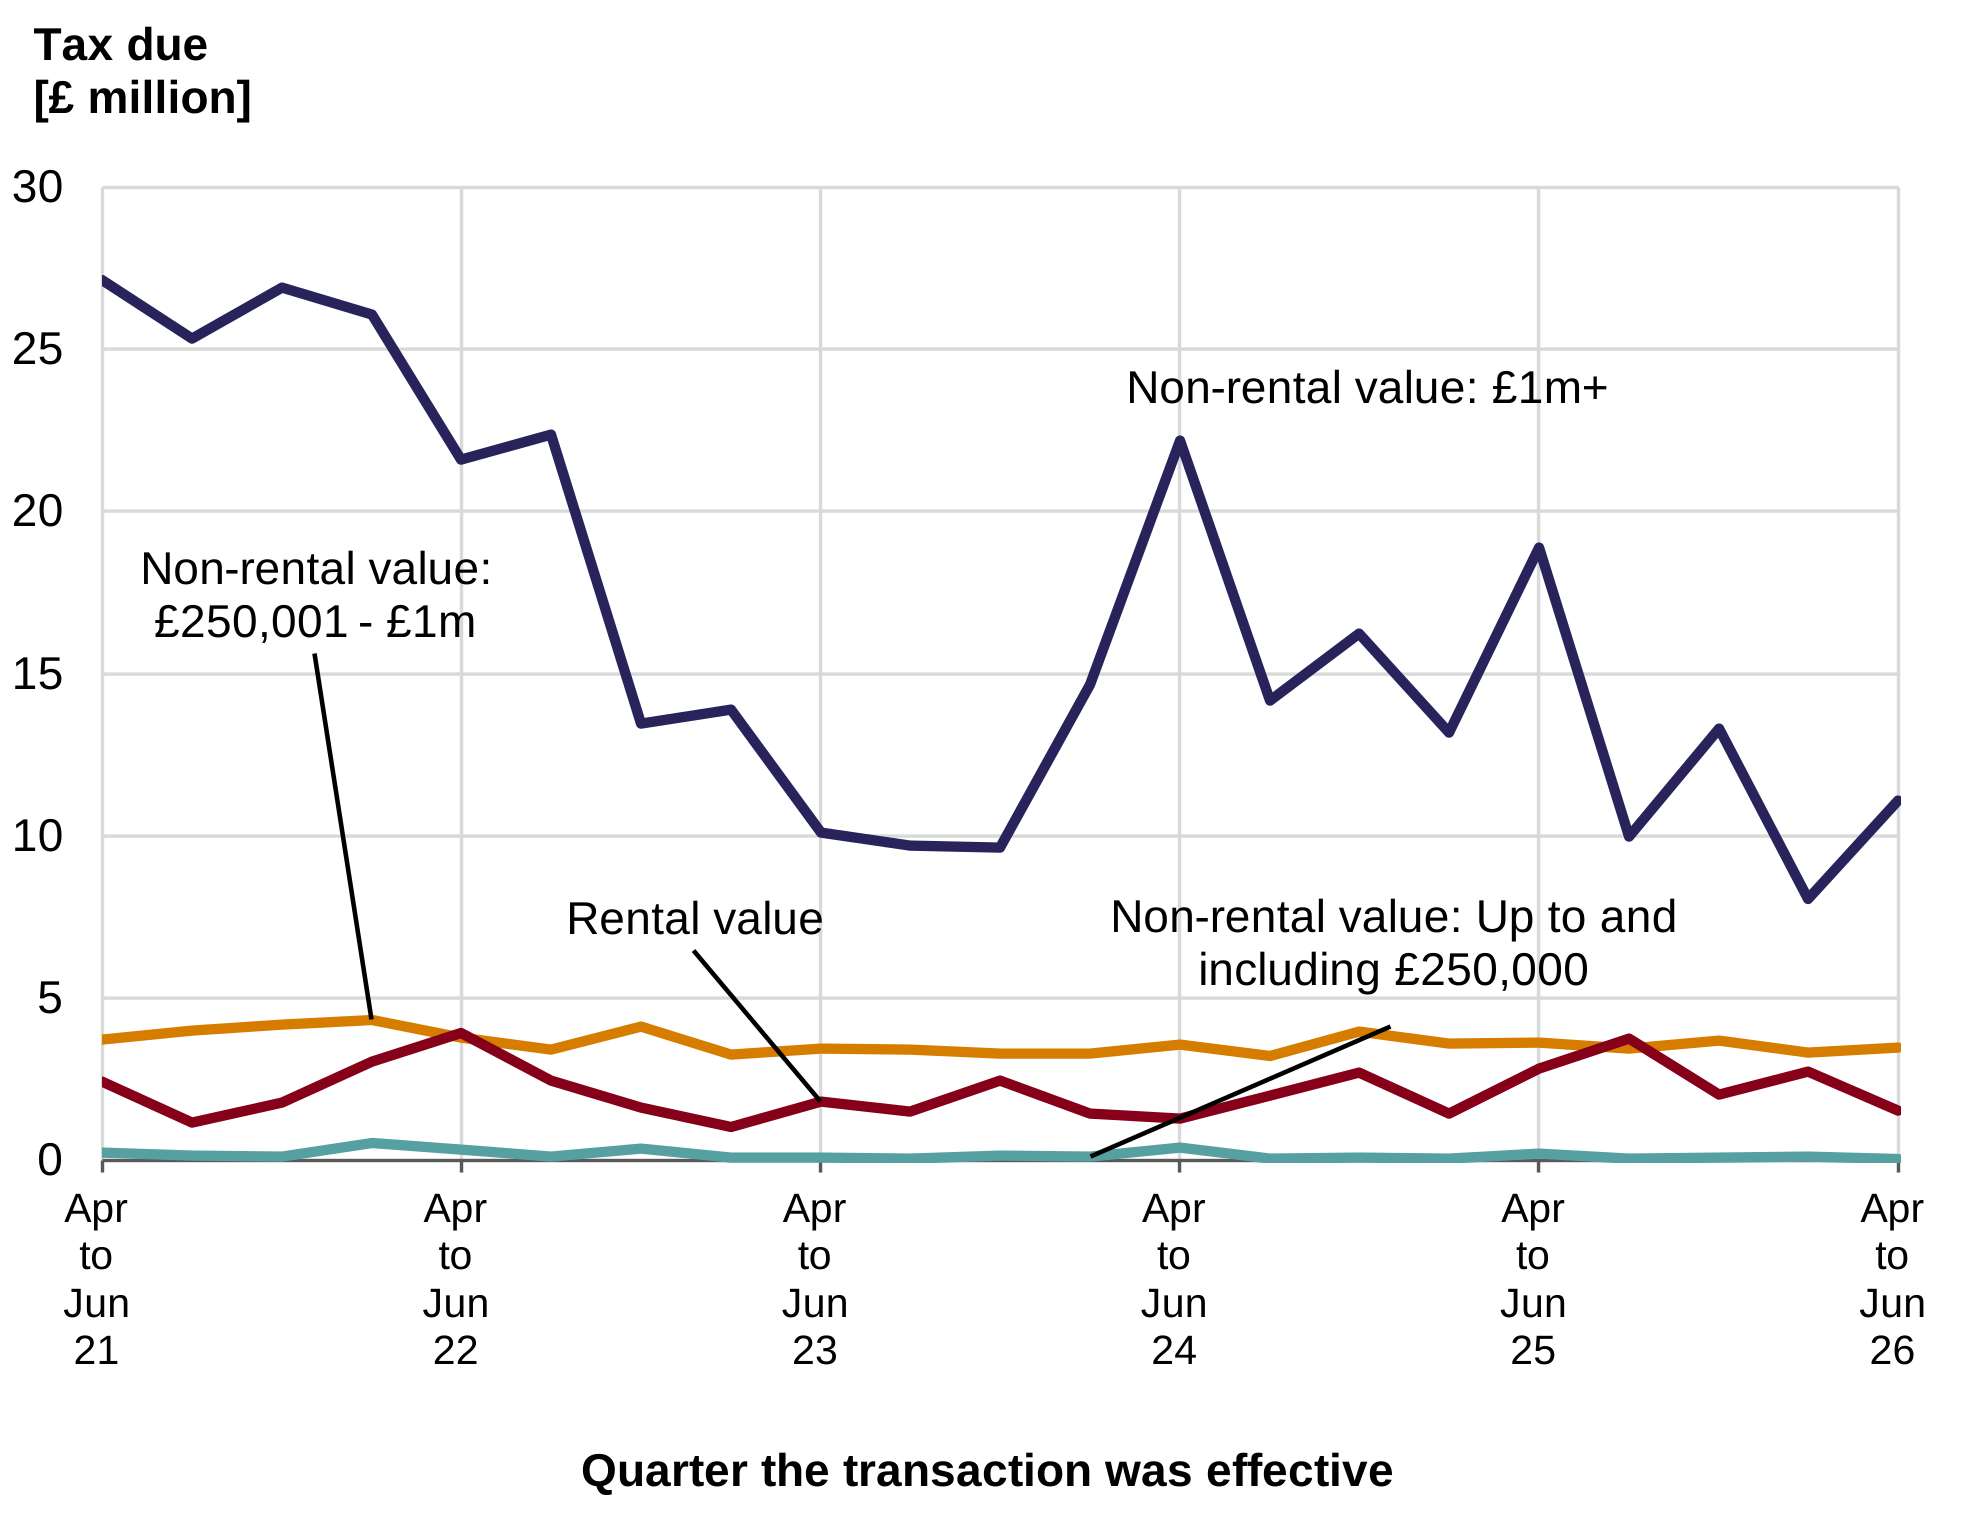
Description of Figure 8: The line chart shows that the quarterly tax due from non-rental value of properties over £1 million has fluctuated greatly over time with the highest values seen in the 6 quarters April 2021 to September 2022, and April to June 2024. The value in the previous quarter was the lowest seen in the past 5 years, with the latest quarter also being relatively low historically. For all quarters, the tax due from this category was considerably higher than the other two non-rental bands presented and the rental value. The non-residential tax due can vary considerably from quarter to quarter, often influenced by a small number of high value transactions.
Source: Non-residential LTT statistics, by transaction value, measure and effective date on StatsWales (includes data back to April 2018, not presented above)
[p] The values for April to June 2026 are provisional and will be revised in a future publication.
Figure 9: Percentage of tax due on non-residential transactions in each value band, April to June 2026 [provisional]
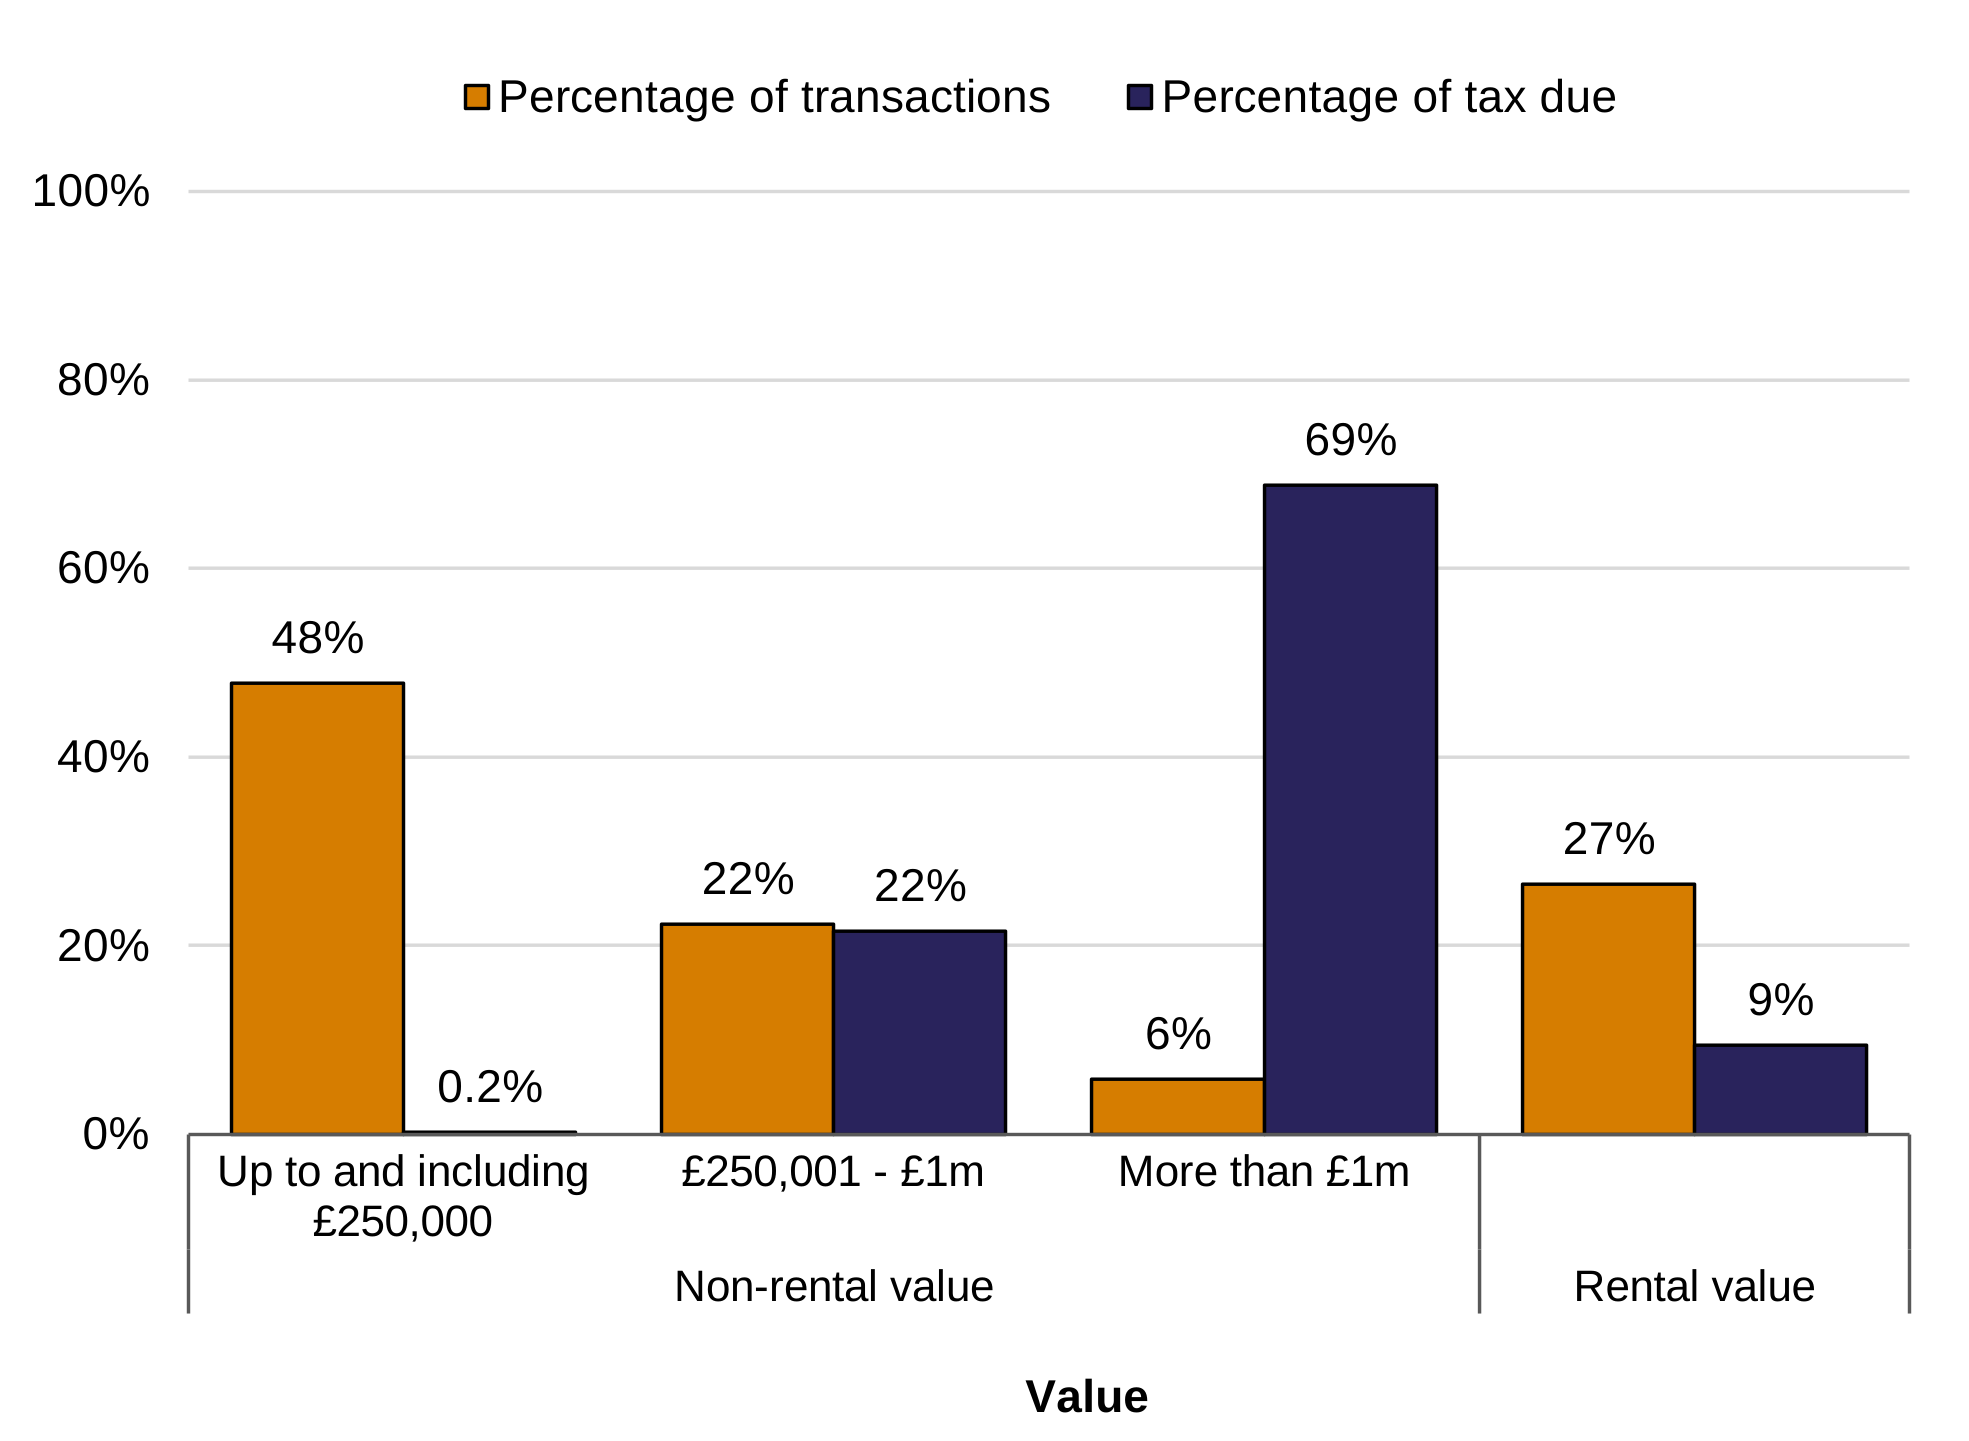
Description of Figure 9: The bar chart shows that in April to June 2026, 48% of non-residential transactions had a non-rental value of up to and including £250,000, with those transactions contributing 0.2% of non-residential tax due. The 6% of non-residential transactions with a non-rental value of more than £1 million contributed 69% of tax due. Just over a quarter of non-residential transactions had a rental value associated with the transaction, contributing 9% of non-residential tax.
Source: Non-residential LTT statistics, by transaction value, measure and effective date on StatsWales (includes data back to April 2018, not presented above)
Analysis within Wales
This release presents geographic breakdowns for residential LTT. We present data for years ending June with data for each relevant period extracted the following month (for example, the data for the year July 2020 to June 2021 was extracted in July 2021). More detailed data for local authorities, National Parks, Senedd and Westminster Parliamentary constituencies is available on StatsWales.
We have not provided breakdowns by month or quarter, as there would be too few transactions in most local authorities to provide reliable statistics.
The local authority in which the transaction occurs is a mandatory question on the tax return, whereas the postcode where the transaction occurs is an optional question. We have combined these two pieces of information to derive our local authority statistics. Further information on this process and the data quality is available in our key quality information for LTT statistics.
Where supplied, the postcode on the tax return is used to derive the Senedd and Westminster Parliamentary constituencies, the National Park and built-up area.
Figure 10: Higher rates transactions as a percentage of all residential transactions for selected local authorities, by year, July 2020 to June 2026 [Note 1]
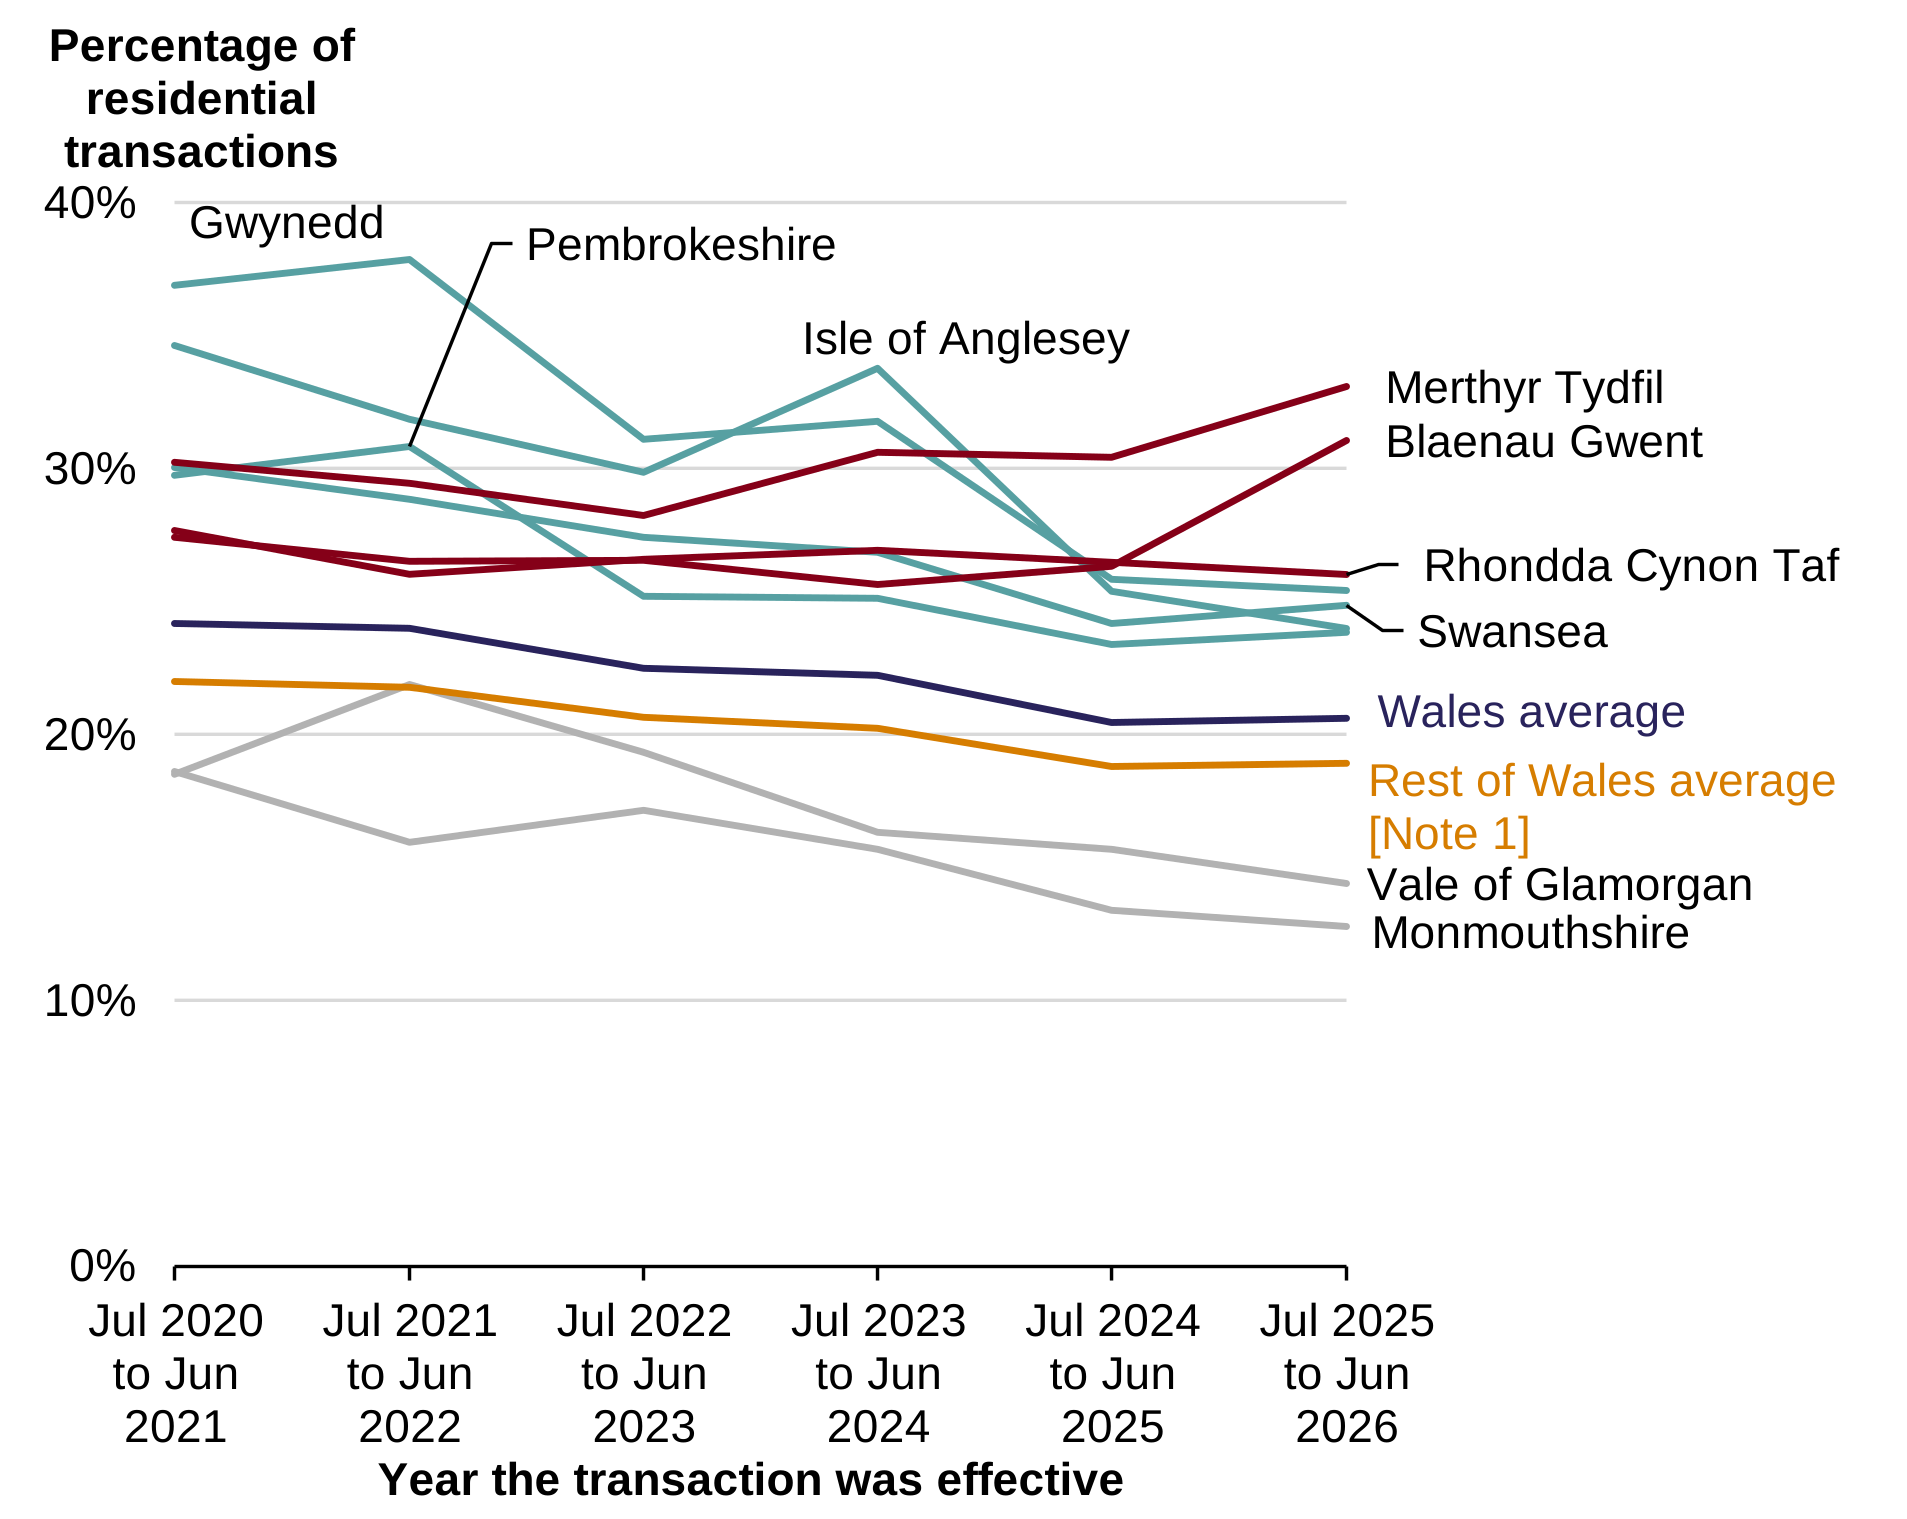
Description of Figure 10: The line chart shows that over 5 years, the percentage of residential transactions which were higher rates has fallen considerably in several authorities in the north and west typically associated with second home purchases. At the start of the period, Gwynedd and Isle of Anglesey had the highest percentages of all local authorities but after falls of 11 percentage points in 5 years, those authorities now have lower percentages than some authorities where buy-to-let activity is more common (Merthyr Tydfil, Blaenau Gwent and Rhondda Cynon Taf). Both Merthyr Tydfil and Blaenau Gwent saw increases in their percentages in the latest year and are now at 33% and 31% respectively.
The Wales average has generally fallen each year (with a 4 percentage point fall over the 5 years), though was flat in the latest year. Monmouthshire and Vale of Glamorgan had the lowest percentages in the latest year (13% and 14% respectively), though some other authorities were at the bottom of the distribution in previous years.
Note 1: The chart shows the 2 or 3 highest and lowest local authorities for this measure in the latest year, plus certain authorities in the north and west of Wales typically associated with second homes purchases. The ‘Rest of Wales average’ is calculated for the other 13 local authorities (not shown individually on the chart).
Source: LTT statistics, by local authority, transaction type, measure and effective year on StatsWales (includes data back to April 2018, not presented above)
Figure 11: Higher rates transactions as a percentage of all residential transactions, by National Park and year, July 2020 to June 2026
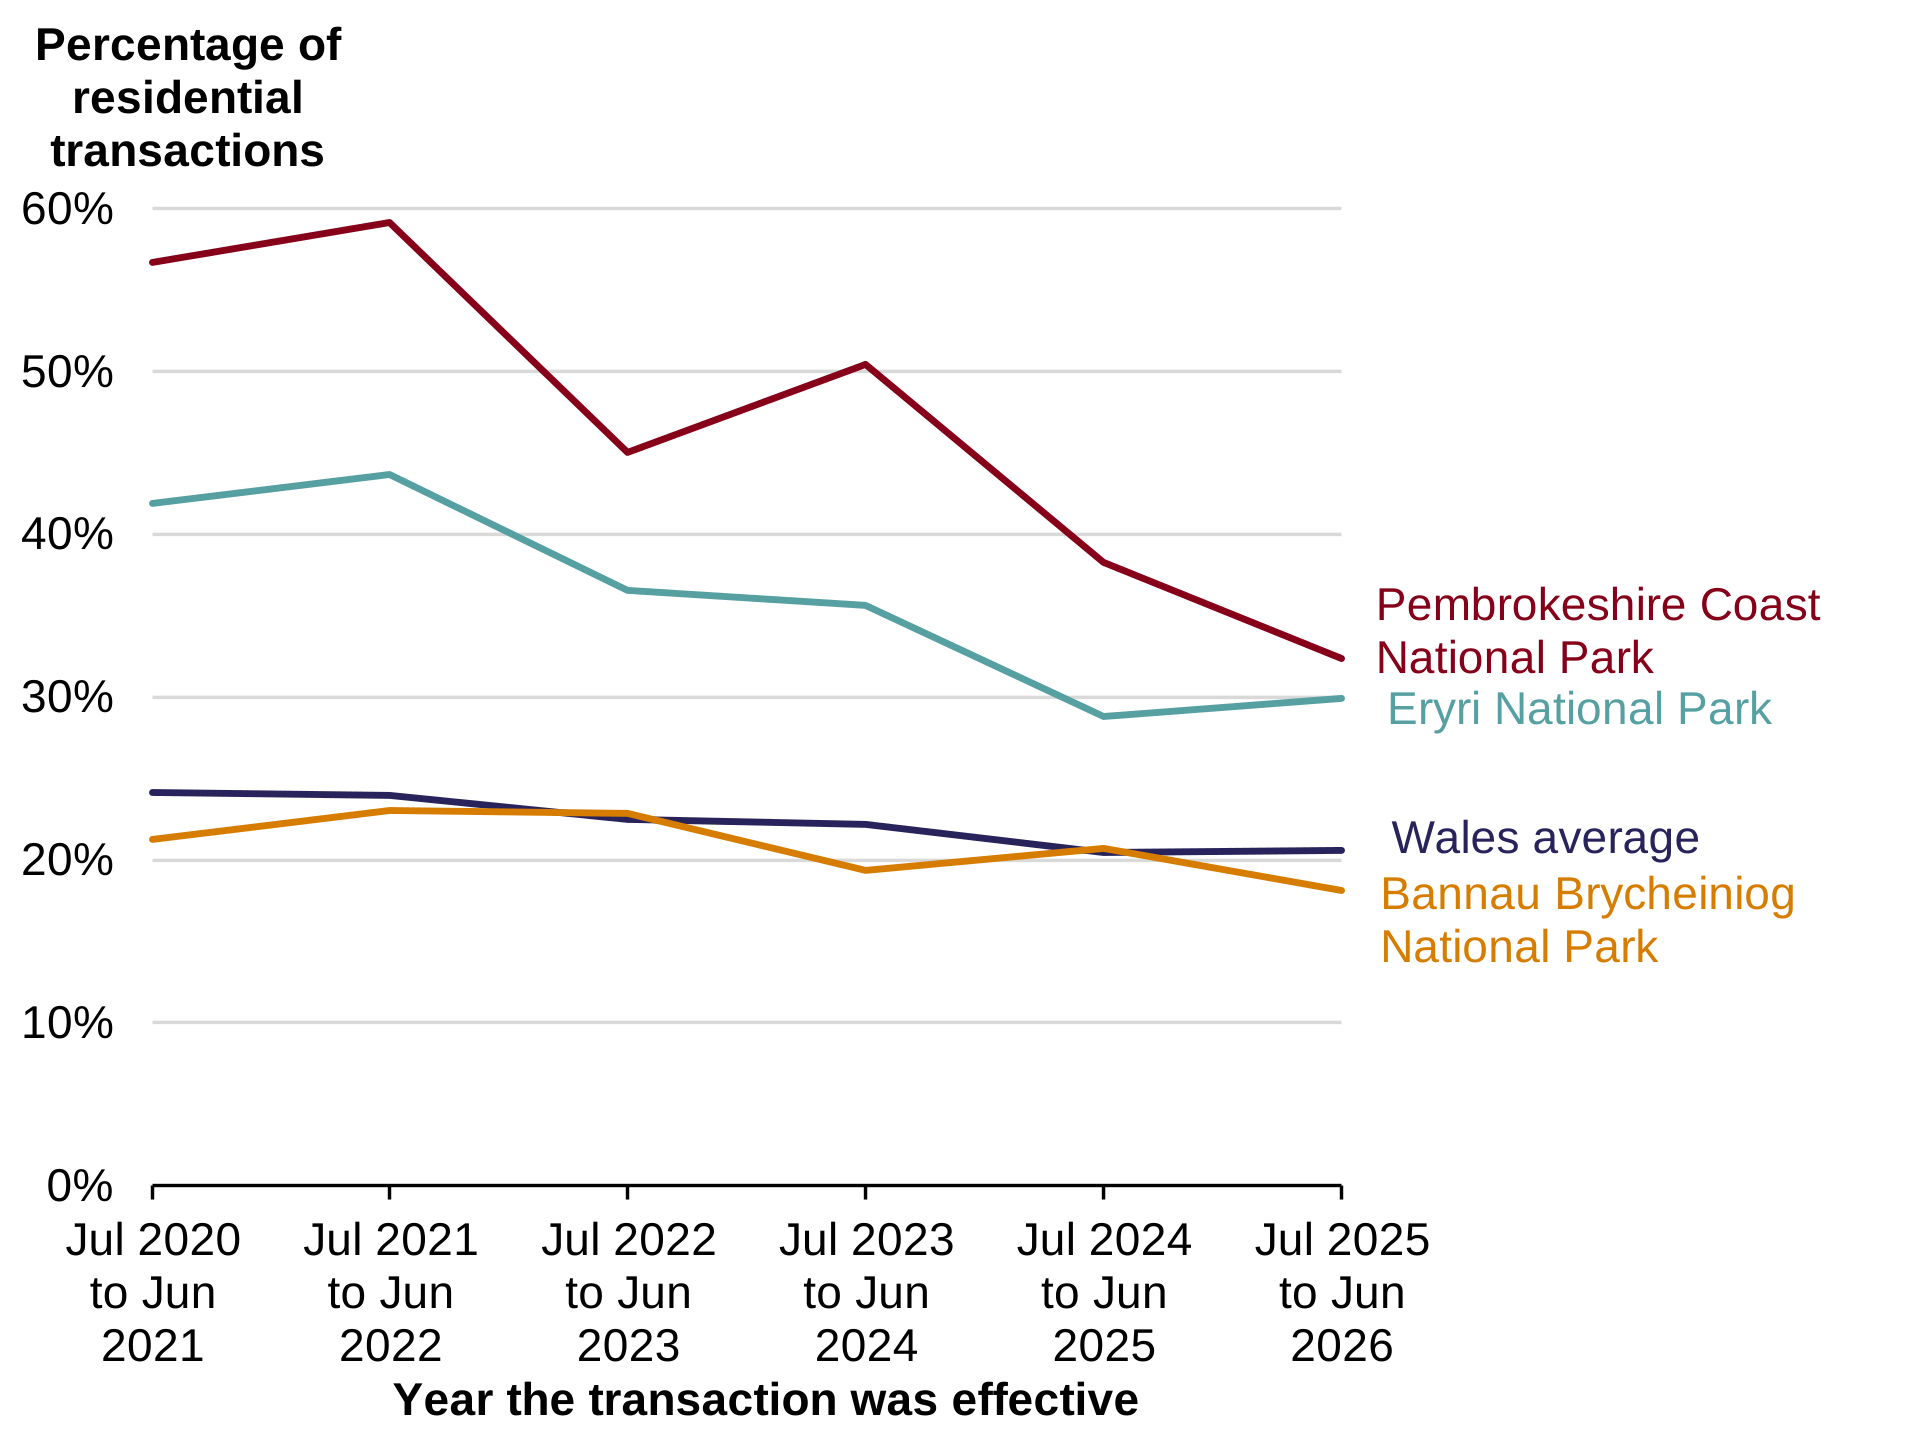
Description of Figure 11: This line chart uses a scale of 0% to 60% (different to Figure 10 for local authorities). It shows that the percentage of residential transactions which were higher rates in each National Park is lower in the latest year than 5 years earlier. The percentages in each National Park have generally decreased each year. Over the 5 year period, there were larger falls for Pembrokeshire Coast and Eryri (falls of 24 percentage points and 12 percentage points respectively) than for Bannau Brycheiniog (3 percentage point fall). At 32% and 30% respectively, the percentages for Pembrokeshire Coast and Eryri remain considerably above the all Wales average of 21%, with Bannau Brycheiniog slightly below (18%). Some of these areas are small and have small numbers of transactions, therefore greater volatility can be expected over time for these areas.
Source: Residential LTT statistics, by National Park area, transaction type, measure and effective 4-quarter rolling period on StatsWales (includes data back to April 2018, not presented above)
Further data available
Various other data are not analysed in this release but we publish this data in the spreadsheet accompanying this release and on StatsWales.
Tax due on additional transactions which were untypically large or with restricted detail
Certain transactions have been excluded from the statistics reported in this release. This includes:
- untypically large transactions, which relates to the 2019-20 purchase by Transport for Wales of the Core Valley Line rail asset from Network Rail; £28.2 million of tax was due and paid on this transaction
- a small number of low-value transactions where we are unable to provide any information other than the total tax figure in the year; this is because there is a risk of revealing details of the individual transactions
Statistics on annual tax due for these transactions is published on StatsWales:
Reliefs
Taxpayers can claim reliefs on both residential and non-residential transactions. Reliefs reduce the amount of tax due when certain conditions are met. More than one relief can be applied to a single transaction.
Reliefs may reduce the tax due:
- to zero, known as a full relief
- or by a certain percentage or amount, known as a partial relief
Statistics on reliefs are published in the spreadsheet accompanying this release and on StatsWales:
On 7 February 2025, legislation relating to multiple dwellings relief was changed so that cases where dwellings that are subsidiary (worth less than a third of the total value of the transaction) must now be treated as part of the primary dwelling in any main rates residential transaction. This means it is now very rare that multiple dwellings relief will apply in a main rates residential transaction, which we estimate will reduce the value of the relief (or increase total LTT revenues) by between £4.0 and £4.5m per year.
Further to this, changes to schedule 13 of the Land Transaction Tax and Anti-avoidance of Devolved Taxes (Wales) Act 2017 have increased the minimum tax rule when applying MDR from 1% to 3% for transactions with effective dates on or after 13 February 2026. It is anticipated that this may lead to small reductions in the value of the relief (or increase total LTT revenues).
Refunds of the higher rates of residential tax
When a taxpayer claims a refund for higher rates residential LTT, the original transaction is amended to a main rate residential LTT transaction. Refund statistics on a variety of bases are published in the spreadsheet accompanying this release and on StatsWales:
- LTT statistics for higher rate refunds, by effective date on StatsWales
- LTT statistics for higher rate refunds, by effective year and quarter and year and quarter of refund approval on StatsWales
- LTT statistics on tax paid and higher rate refunds (cash basis), by time period on StatsWales
Tax paid
We publish statistics on the amount of tax paid in the spreadsheet accompanying this release and on StatsWales.
LTT statistics on tax paid and higher rate refunds (cash basis), by time period on StatsWales
Analysis of revisions to our published estimates
Our first estimates of transactions and tax due for a particular month are published as provisional estimates. In subsequent releases, we regularly revise those estimates and those for earlier months. The percentage changes we see between first and second estimates for a particular month are now relatively small. These percentages are shown in the spreadsheet accompanying this release.
Statistician Dave Jones
03000 254 729
Email: data@wra.gov.wales
Rydym yn croesawu galwadau a gohebiaeth yn Gymraeg / We welcome calls and correspondence in Welsh.
Media
03000 254 770
Email: news@wra.gov.wales
Rydym yn croesawu galwadau a gohebiaeth yn Gymraeg / We welcome calls and correspondence in Welsh.