Longitudinal small business survey: 2019
A survey of Welsh small business behaviours for 2019.
In this page
This report documents the data for Wales provided by the 2019 Longitudinal Small Business Survey (LSBS). With thanks to Thao Nguyen at the National Innovation Centre for Rural Enterprise, and Ian Drummond and Stephen Roper of the Enterprise Research Centre for their analysis of the data and the preparation of the report. This analysis is not part of a planned regular publication. However, Welsh Government analysts are consulting with internal and external users through June and July 2021 over whether future analysis of the LSBS for Wales would be useful. Please contact stats.trade@gov.wales if you would like to take part in these discussions.
Introduction
The BEIS Longitudinal Small Business Survey provides a wide range of reliable data on Small and Medium Size Enterprise (SME) performance and the factors that are associated with this. Much of the data provided by LSBS is not available in any other government datasets.
The fieldwork for LSBS 2019 took place between July 2019 and February 2020. This timing means that the survey fieldwork was completed at the very onset of the COVID-19 pandemic and the findings are unaffected by the challenges this created. Accordingly, the LSBS 2019 findings can provide an important benchmark against which the impacts of the pandemic and any subsequent recovery can be measured.
Additional data is available in the data tables accompanying this report.
The SME population in Wales
Table 1 sets out the business population structure for Wales in 2019. As is the case throughout the UK, this structure is dominated by SMEs (0 to 249 employees) which account for more than 99% of the business population in Wales. Within this, 22.9% (approximately 61,000) are SME employers (businesses with 1 to 249 employees) in Wales. These businesses account for 43.5% of employment and 35.0% of turnover in Wales.
| Enterprise count | Employment | Turnover (£m) | |
| Zero employees | 204,350 | 224,700 | 3,431 |
| Micro (1 to 9) | 49,285 | 187,700 | 12,526 |
| Small (10 to 49) | 9,485 | 179,500 | 13,624 |
| Medium (50 to 249) | 2,215 | 146,300 | 16,795 |
| Large (250+) | 1,705 | 444,600 | 76,125 |
| SME employers | 60,985 | 513,500 | 42,945 |
Source: Business structure in Wales by size-band and measure on StatsWales
Note: data on SME employers are calculated from published, rounded figures. Enterprises is a count of enterprises that are active in Wales, including multi-region enterprises registered outside Wales. Turnover figures exclude turnover in the financial and business services sector).
| Enterprise | Employment | Turnover (£m) | |
| Zero employees | 76.5% | 19.0% | 2.8% |
| Micro (1 to 9) | 18.5% | 15.9% | 10.2% |
| Small (10 to 49) | 3.6% | 15.2% | 11.1% |
| Medium (50 to 249) | 0.8% | 12.4% | 13.7% |
| Large (250+) | 0.6% | 37.6% | 62.1% |
| SME employers | 22.9% | 43.5% | 35.0% |
Source: Business structure in Wales by size-band and measure on StatsWales
The Longitudinal Small Business Survey
Methodology overview
The LSBS is undertaken annually on behalf of BEIS, and is a large-scale telephone survey of private sector UK businesses with fewer than 250 employees. The survey has existed in different forms since 2003. Since 2015, the survey has been designed to provide both cross sectional and longitudinal data. The cross-sectional data provides a snapshot of business performance and the factors that affect this at the time of the survey. The longitudinal data, derived from panels of respondents who are re-interviewed each year, describes how these factors change through time. Because the panels are subject to attrition, they are topped up each year in order to maintain samples large enough to provide for reliable analyses. This has the added advantage that the overall – cross sectional – sample is larger than might otherwise be the case.
LSBS has always sought to avoid changes to the questions asked. This has been particularly the case since the survey became longitudinal as changes to the questions would undermine the usefulness of the panel data. The full survey questionnaire is reproduced in the LSBS 2019 technical report. In order to keep respondent burden to a minimum, not all questions, for example those relating to social enterprises, are asked each year. In addition, some questions are only asked of a proportion of the full sample. For example, in 2019, the questions relating to process innovation, Research & Development (R&D), working for the public sector and obstacles to business success were only asked of a third of the businesses interviewed
Sampling
The UK business population includes a high number of very small businesses and a correspondingly very small number of medium sized businesses. LSBS deals with this unbalanced structure by oversampling medium sized businesses and then weighting the data to provide representative findings. This is necessary because a representative sample of UK businesses would include too few medium sized businesses to provide reliable results. For example, ONS data shows that at the start of 2019, medium sized businesses accounted for just 0.64% of all businesses in Wales. Accordingly, with an overall sample of 400 businesses in Wales, without over sampling, the achieved sample of medium sized businesses would be just three.
While the LSBS sample is generally large enough to provide very reliable data for the UK as a whole, the achieved samples for the UK nations are smaller and, in some instances, the findings need to be treated with caution. This is particularly the case where analyses relate to sub-sets of the overall business population. For example, LSBS data can be analysed by sector, but such analyses are not included here because the samples for Wales are too small for this to be done reliably.
| All SMEs unweighted | All SMEs weighted | SME employers unweighted | SME employers weighted | |
|---|---|---|---|---|
| England | 9,026 | 9,686 | 6,878 | 2,302 |
| Scotland (a) | 1,099 | 626 | 849 | 184 |
| Wales | 391 | 406 | 298 | 107 |
| Northern Ireland (a) | 485 | 251 | 381 | 67 |
| Total | 11,002 | 11,000 | 8,406 | 2,660 |
Source: Longitudinal Small Business Survey
(a) The samples for Scotland and Northern Ireland were both boosted.
| Wales unweighted | Wales weighted | UK unweighted | UK weighted | |
|---|---|---|---|---|
| Zero employees | 93 | 299 | 2,563 | 8,309 |
| Micro (1 to 9) | 147 | 89 | 3,774 | 2,192 |
| Small (10 to 49) | 94 | 16 | 2,988 | 402 |
| Medium (50 to 249) | 57 | 2 | 1,644 | 66 |
| Large (250+) (a) | - | - | 33 | - |
| Total | 391 | 406 | 11,002 | 11,000 |
| SME employers | 298 | 107 | 8,406 | 2,660 |
Source: Longitudinal Small Business Survey (Business structure in Wales by size-band and measure on StatsWales)
- = The data item is not exactly zero, but estimated as zero or less than half the final digit shown.
(a) Large business were SMEs in a longitudinal panel that have since grown to 250+ employees.
A more detailed explanation of the survey methodology can be found in the LSBS (2019) technical report.
Analysis and reporting
This report focuses on 2019 data for businesses with between 1 and 249 employees (‘SME employers’). Findings for businesses without employees are not included because their behaviours and performance tend to be very different from those reported by businesses with employees. BEIS also publish a separate report detailing LSBS findings for businesses without employees.
In order to facilitate comparisons, the data for Wales is generally presented by business size and then comparing Wales alongside each of the UK nations.
Throughout the report, where figures cover all possibilities but do not sum to 100, the shortfall is due to businesses saying they did not know the answer or refusing to answer or, might be due to rounding of estimates to the nearest whole percentage. Throughout this report we have not included don’t know or refused to responses in the data presented. The statistics are calculated based on weighted bases to adjust for the sampling methodology and to present data that are more representative. However, the weighted and unweighted bases for the statistics are presented for each chart.
It is important to note that there are very small respondent bases to some questions. In such cases, caution should be exercised when interpreting the findings and a note has been made beneath the relevant charts to highlight where particular caution should be taken.
In this report, we present the LSBS 2019 findings for Wales under three headings.
- Business demographics: the basic characteristics of SME employers.
- Business performance and outlook: the data on business performance in terms of employment and turnover, profitability and growth ambition.
- Business behaviours and practices:findings relating to a range of business behaviours that are commonly associated with business performance.
Business demographics
Age
Almost half of SME employers in Wales (48.8%) have been established for more than twenty years. One in seven (14.4%) have been established for less than five years. Chart 1 shows that firm size is positively associated with age; just 1.1% of medium sized businesses have been established for five years or less whereas 80.3% of medium sized businesses in Wales are more than 20 years old.

Chart 2 shows that the age structures of SME employers in Wales are generally similar to those in the other UK nations.

Legal status
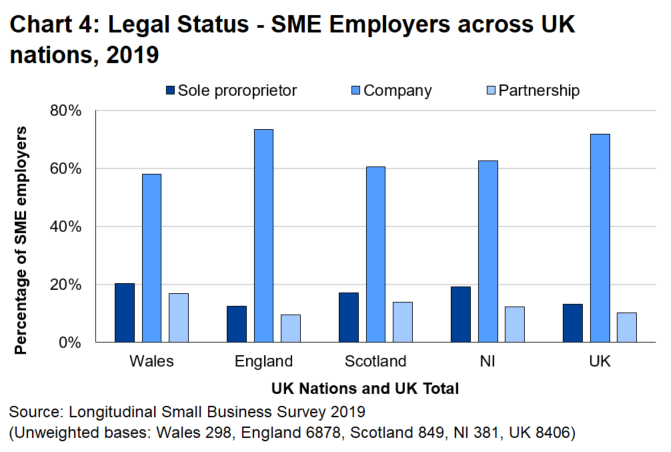
In practice, businesses can have a range of legal forms including liability partnerships and charitable incorporated organisations. However, more than 95% of UK businesses have one of three legal forms; sole proprietorships, companies or partnerships.
Chart 3 shows that the majority (58.1%) of SME employers in Wales are private limited companies. The likelihood of being such a company is positively associated with firm size: 53.3% of micro business, 79.3% of small business and 90.7% of medium sized businesses. Conversely, sole proprietors and partnerships are most common in micro and small businesses.

Chart 4 shows that SME employers are more likely to be private limited companies in the other UK nations (for example 73.5% in England) than they are in Wales (58.1%). Sole proprietorships and partnerships are more common in Wales.
Urban and rural location
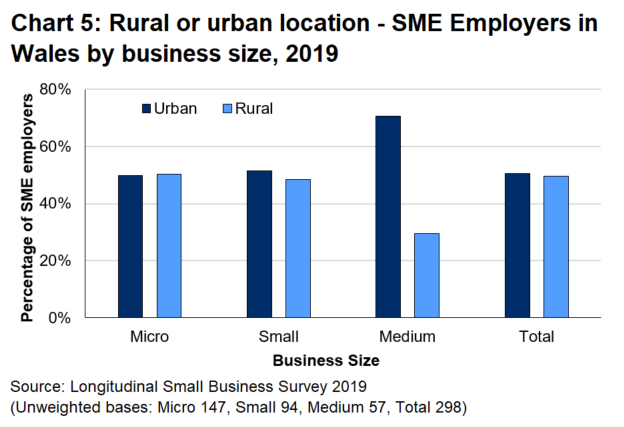
The rural and urban classification used in LSBS is based on a definition of rurality published by DEFRA.
Half (49.5%) of SME employers in Wales are based in rural locations. This proportion is lower (29.4%) for medium sized businesses (see Chart 5).
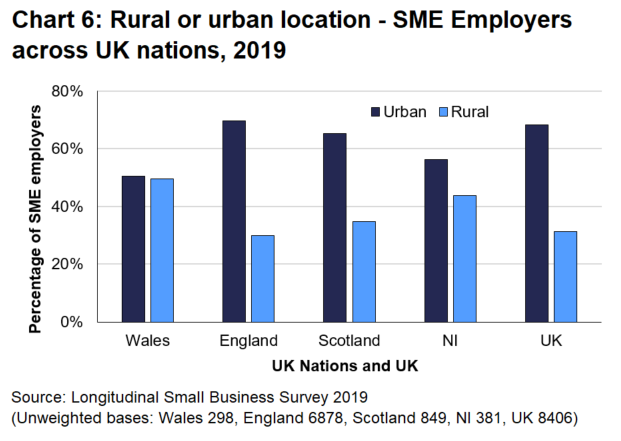
In the UK as a whole, less than a third (31.4%) of SME employers are located in rural areas. LSBS data show that markedly more businesses in Wales are in rural areas than is the case in the UK as a whole (see Chart 6).
Businesses premises
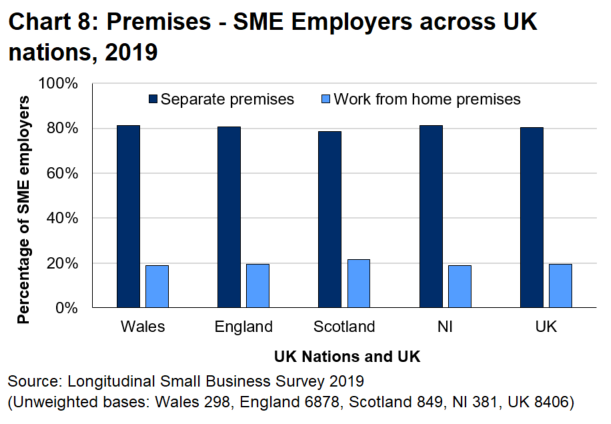
Just under one in five (18.9%) of SME employers in Wales have business premises in the home of the business owner or that of another individual.
This proportion declines quite markedly with firm size. Falling from 21.3% of micro businesses to 1.1% of medium sized businesses (see Chart 7).

There is little variation in the proportions of home-based businesses in the four UK nations (see Chart 8).
Family-ownership
The LSBS defines family-owned businesses as those that are majority owned by members of the same family. Businesses with just a single owner or partner were also classified as family businesses.
Almost three quarters (73.7%) of SME employers in Wales are family owned businesses (see Chart 9). However, this proportion declines with firm size, 75.8% of micro businesses, 64.8% of small businesses and just 55.0% of medium sized businesses are family owned.
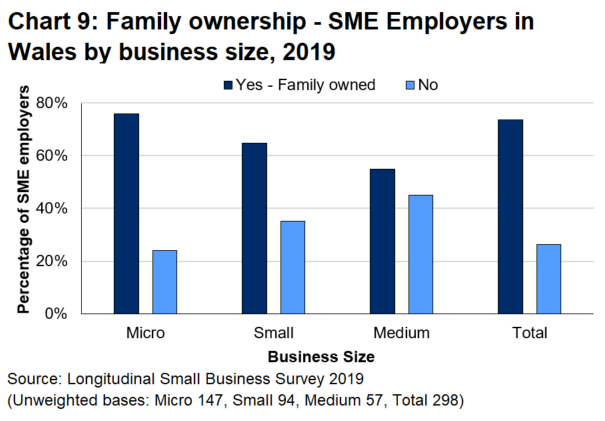
As shown in Chart 10, the proportions of SME employers that are family owned are quite consistent across the UK nations.

Women-led businesses
LSBS defines women-led businesses as those majority-led by women, that is controlled by a single woman or having a management team of which a majority are women.
Overall, 13.5% of SME employers in Wales are women-led (see Chart 11). The proportion is highest in small businesses (18.2%), somewhat lower at 12.8% in micro businesses and lower still (8.4%) in medium sized businesses.
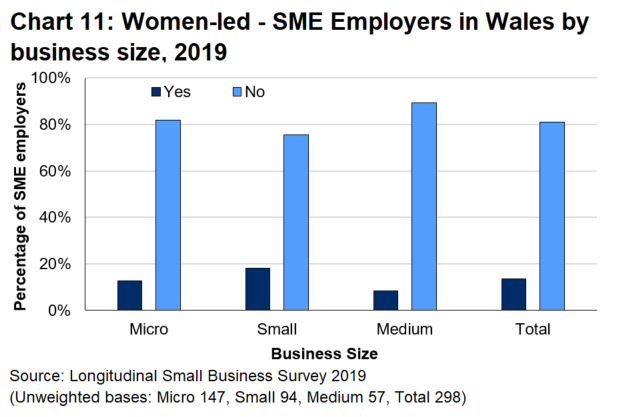
As shown in Chart 12, there is very limited variation in the proportions of SME employers that are women led across the UK nations.

Minority Ethnic Group-led businesses
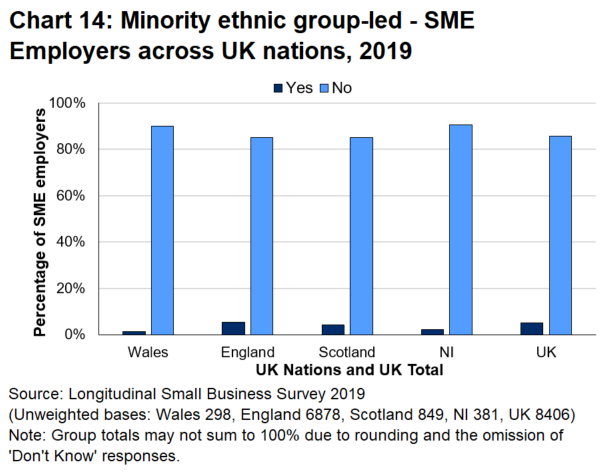
LSBS defines minority ethnic group led (MEG-led) businesses as having a person from an ethnic minority in sole control of the business or having a management team with at least half of its members from ethnic minority groups.
Overall, one and a half percent of SME employers in Wales were MEG-led based on the LSBS definition (see Chart 13). The portion is lowest for micro businesses (1.2%) and highest for medium sized businesses (3.4%).

The proportion in Wales is the lowest amongst the four UK nations. The figure for the UK as a whole is 5.1% (see Chart 14).
Social enterprises and socially oriented SMEs
The criteria LSBS uses to define social enterprises has changed a number of times in recent years. In 2019, categorisation was based on the relative importance of economic, social and environmental goals; a detailed description of the criteria used is included in Section D of the LSBS technical report.
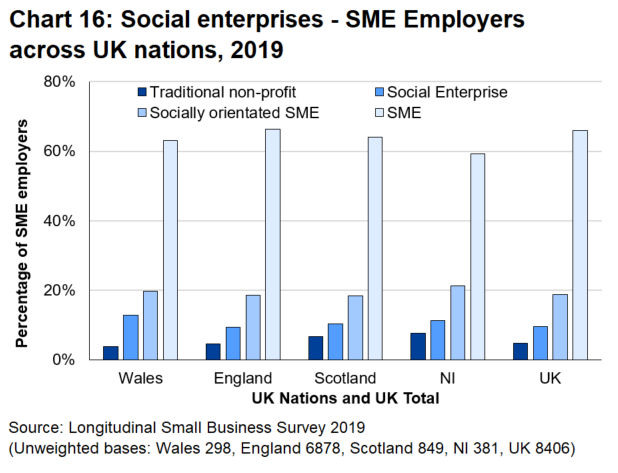
As shown in Chart 15, 12.7% of SME employers in Wales met the LSBS definition of a social enterprise. Small and medium sized businesses were more likely to be categorised as social enterprises than micro businesses. Just under one in five SME employers in Wales (19.7%) reported some relevant social or environmental goals, and were designated as being ‘socially orientated’, but did not meet the criteria for being categorised as a social enterprise. There were also a very small number of traditional non-profit organisations.
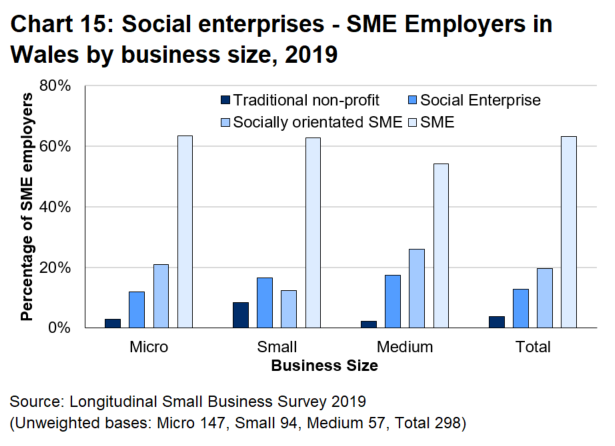
The proportions of social enterprises did not vary markedly between the UK nations (see Chart 16).
Business performance and outlook
Changes to employment in the 12 months prior to fieldwork
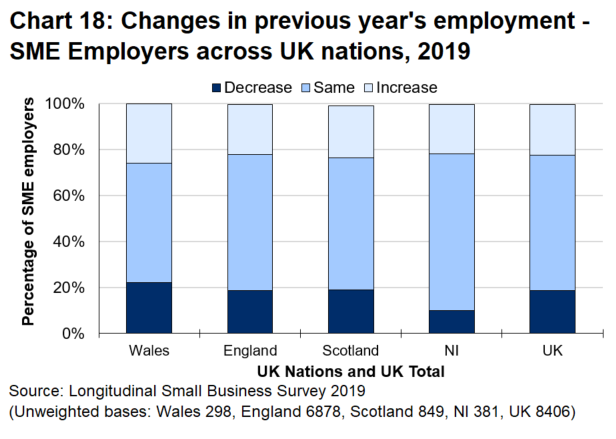
More than half of SME employers in Wales (52.0%) reported no change in employment over the year preceding the survey. As shown in Chart 17, medium sized businesses in Wales (50.2%) were markedly more likely to have experienced employment growth than smaller businesses (micros 25.2% and small 26.2%).

Businesses in Wales were somewhat more likely to experience either decreases or increases in employment than those in the other UK nations (see Chart 18).
Changes to turnover in the 12 months prior to fieldwork
In the year preceding the business being interviewed, 18.6% of SME employers in Wales experienced a reduction in turnover and a third (33.3%) reported an increase. However, the most common experience was no change in turnover (44.2%).
The likelihood of experiencing turnover growth was strongly associated with firm size. This was reported in 31.8% of micro businesses and just under half (49.9%) of medium sized businesses (see Chart 19).

Patterns of turnover over the past year in Wales were almost identical to those reported for the UK as a whole (see Chart 20).

Expectations of employment growth in 12 months following the survey
More than half of SME employers in Wales (58.0%) expected the number of people they employed to remain unchanged over the year following the interview (see Chart 21). More respondents expected their businesses to increase their employees (28.5%) than anticipated a reduction (13.6%).
Expectations of increased employment were positively associated with firm size; rising from 25.8% in micro businesses to 48.7% in medium sized businesses.

Chart 22 shows that SME employers in Wales were as likely to report expecting to have more employees in a year’s time (28.5%) as those in the UK as a whole (27.9%). SME employers in Wales were less likely to report expecting decreases in employment.

Expectations of turnover growth in the 12 months following the survey
Chart 23 shows that two in five SME employers in Wales (40.3%) expected to experience turnover growth over the year following their interview. Just 6.7% expected a decline in turnover. Half (49.9%) expected no change. Expectations of turnover growth were markedly higher in medium sized businesses (65.7%) than in micros (38.8%) and small businesses (44.5%).

SME employers in Wales were slightly more likely to expect an increase and less likely to anticipate a decrease than those in the UK as whole (Chart 24).

Profits
Four out of five SME employers in Wales (80.4%) reported making a profit in the year preceding their interview for LSBS 2019 (see Chart 25). Medium sized businesses (89.0%) were more likely to have made a profit than small businesses (82.0%) and micro businesses (79.8%).

As shown in Chart 26, the proportions of SME employers reporting making a profit in Wales were almost identical to those reported in the other UK nations.

Growth ambitions
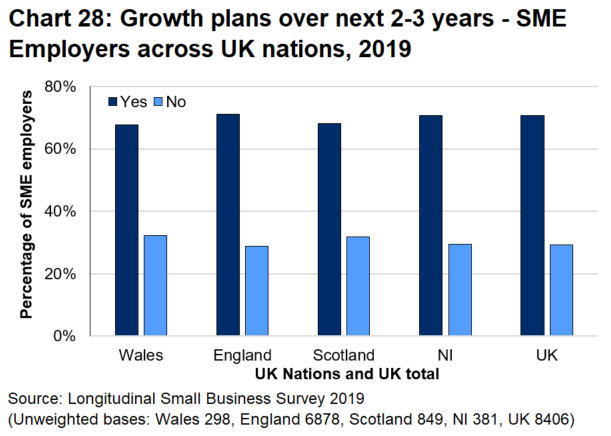
Just less than a third (32.3%) of SME employers in Wales reported having no ambition to grow the sales of their business over the next two to three years (see Chart 27). Ambition is clearly lower amongst micro businesses; 36.7% of which report no ambition compared with just over 10% of small and medium sized businesses.

Levels of reported ambition in Wales are similar to those for the UK as a whole (see Chart 28).
Business behaviours and practices
Innovation
Chart 29 shows that just less than one in five (18.7%) of SME employers in Wales had introduced new products and almost a third (29.3%) had introduced new services in the three years prior to being interviewed. Product innovation is most likely in medium sized businesses and the introduction of new services is most common in small businesses.

Chart 30 shows that both product and service innovation are marginally more common in Wales (product innovation 18.7% and service innovation 29.2%) than for the UK as a whole (15.2% and 25.7% respectively).

LSBS 2019 only asked a third of the overall survey sample about process innovation. Accordingly, the relevant samples for Wales are very small therefore it isn’t possible to reliably break down by business size.
Chart 31 shows that just less than a quarter (22.8%) of SME employers in Wales reported having undertaken process innovation during the three years preceding their interview. SME employers in Wales were more likely to report process innovation than those in the other devolved administrations: 14.9% in Scotland and just 13.7% in Northern Ireland (see Chart 32).

Investment in Research and Development (R&D)
LSBS 2019 only asked a third of the overall survey sample about investment in R&D. Accordingly, the relevant samples for Wales are very small therefore it isn’t possible to reliably break down by business size.
The LSBS 2019 findings suggest that approximately a quarter (21.3%) of SME employers in Wales had invested in R&D the three years preceding their interview.
The data show some variation in levels of investment across the devolved administrations with investment being most common in Wales and Scotland and least common in Northern Ireland (see Chart 32).

International exports
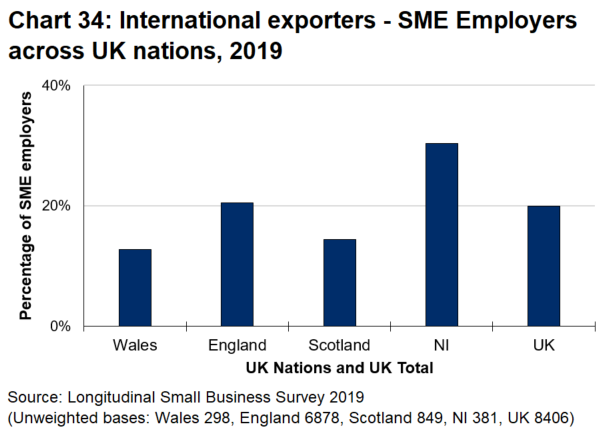
Chart 33 shows that 12.8% of SME employers in Wales exported either goods or services outside of the UK during the year before they were interviewed. Exporting is positively associated with firm size, rising from 12.0% of micro to 30.0% of medium sized businesses.
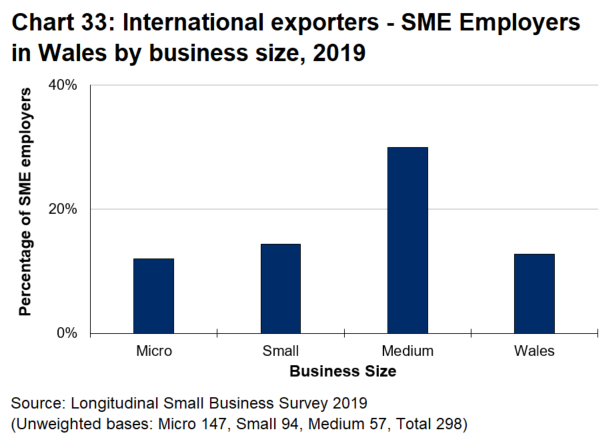
Chart 34 shows that for SME employers, exporting is less common in Wales than in the other UK nations. 12.8% in Wales compared with 20.0% in the UK as a whole.
The relatively high proportion of exporting businesses in Northern Ireland (30.4%) reflects the land border with the Republic of Ireland.
International imports
As shown in Chart 35, 17.1% of SME employers imported from Euro Zone countries and 9.4% from non-Euro Zone countries.
The likelihood of importing from international sources increases with firm size. More than two in five (42.3%) of medium sized businesses sourced goods or services internationally compared with just a quarter (17.9%) of micro businesses.
Note: some businesses sourced goods or services from both Euro and non-euro zones. Totals do not sum to 100, as most businesses do not import.

Trade with other UK nations
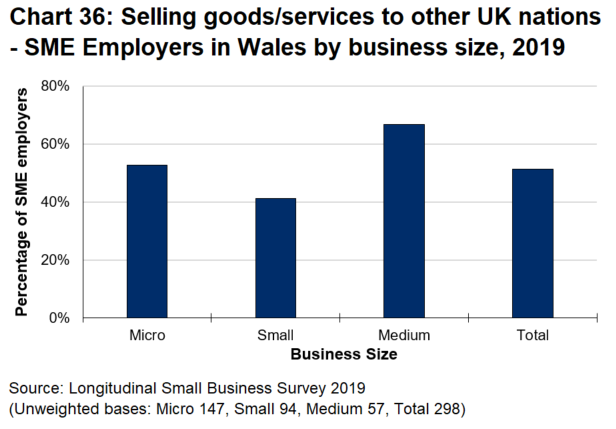
Just over a half (51.3%) of SME employers in Wales sell goods or services to the other UK nations (see Chart 36). This is most likely amongst medium sized businesses (66.8%) and least likely amongst small businesses (41.3%).
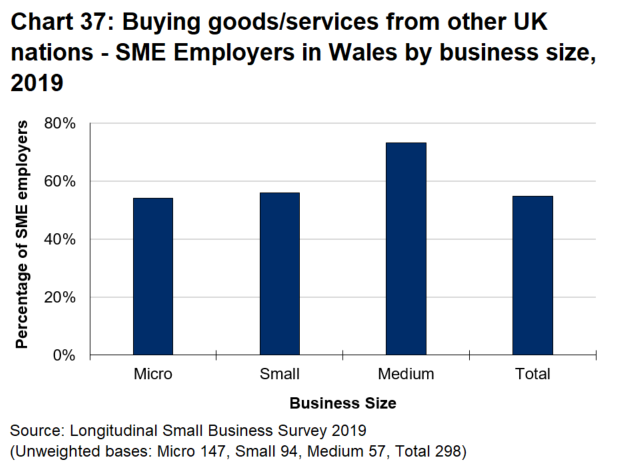
More than half of SME employers in Wales (54.8%) buy goods or services from the other UK nations (see Chart 37). The proportion that do so is highest amongst medium sized businesses (73.2%) and lowest amongst micro businesses (54.1%).
Training
Chart 38 shows that more than half of SME employers in Wales (51.9%) do not offer training to their employees. Offering such training is strongly associated with firm size; 57.3% of micro businesses do not provide training while just 11.2% of medium sized businesses do not do so. Amongst businesses that offer training, most offer both formal off the job and informal on the job training.

The proportions of SME employers offering training for their employees in Wales is generally similar to those reported for the other UK nations (see Chart 39).
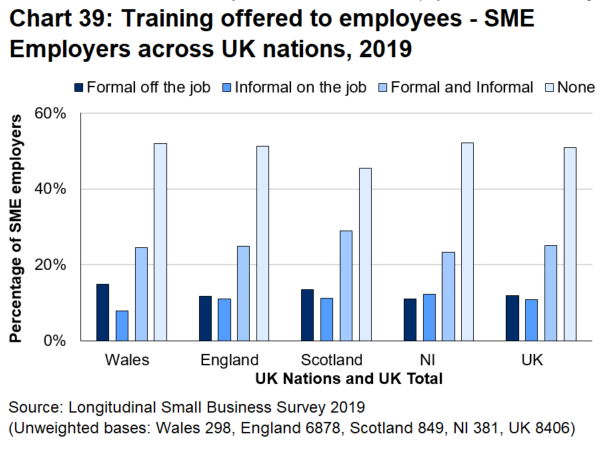
Chart 40 shows that more than two in five SME employers in Wales (41.2%) do not offer training to managers in the business. Training for managers is markedly more prevalent in medium sized businesses (85.8%) than in micro (54.3%) and small businesses (68.5%).

Businesses in Wales are less likely to provide training for managers than those in the other UK nations (see Chart 41).
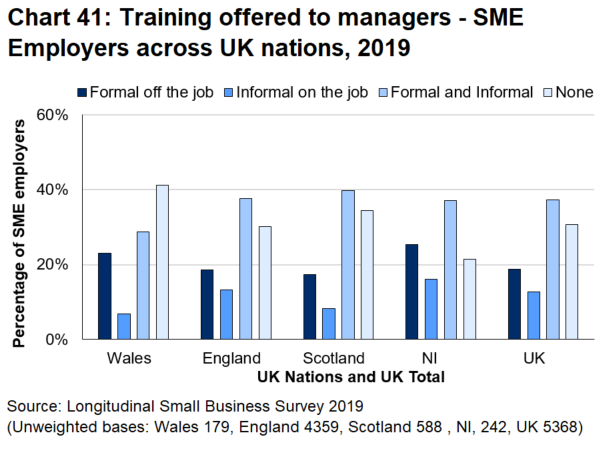
Chart 42 shows the forms of training, both formal and informal, offered to managers in SME employers in Wales. The most frequently provided is concerned with technical and practical skills. Just 29.4% provide leadership training.

Business Plans
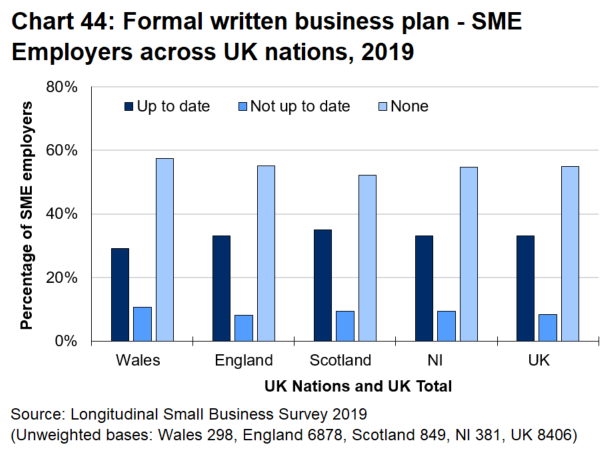
More than a half (57.3%) of SME employers in Wales do not have a written business plan. This proportion rises to almost two thirds (61.7%) in micro businesses (see Chart 43). The majority of businesses that do have a plan keep this up to date. The likelihood of having an up to date business plan is positively associated with size, with one quarter (25.4%) in micro businesses rising to two thirds (67.6%) in medium sized businesses.

Chart 44 shows that SME employers in Wales are marginally less likely to have a business plan than those in the other UK nations.
Working for the public sector
LSBS 2019 only asked a third of the overall sample about working for the public sector. Accordingly, the achieved sample for Wales is very small and these data should be treated with caution.
Just less than a quarter (24.2%) of SME employers in Wales had worked directly for the public sector during the year before they were interviewed. This proportion was positively associated with firm size; rising from 20.9% of micro businesses to 47.0% of medium sized businesses (see Chart 45).

As Chart 46 shows, the proportion of businesses working for the public sector is higher in Northern Ireland (31.5%) than in the other (21.9% for the UK as a whole).UK nations.

Use of Business Support
Just a quarter (25.6%) of SME employers in Wales had sought external information or advice (from either government or the private sector) over the year before their interview (see Chart 47). Use of such support is highest amongst medium sized business (34.7%) and lowest in small businesses (23.2%).

Chart 48 shows that the use of business support is quite consistent amongst the UK nations.

Major obstacles to the success of the business
LSBS 2019 only asked a third of the overall sample of businesses about obstacles to business success. Accordingly, the achieved sample for Wales is very small and these data should be treated with caution.
LSBS 2019 shows that SME employers in Wales reported a range of factors which they considered to be major obstacles to the success of their businesses (see Chart 49). The most frequently cited factors were: regulation and red tape (51.4% of respondents), late payment (45.1%) and taxation (44.4%).

Chart 50 shows the six most reported factors in the UK nations. These are relatively consistent across the UK.

Access to finance
LSBS asks a number of questions about access to finance. However, given the small sample sizes only the headline data presented below can be considered reliable.
Chart 51 shows that one in five SME employers in Wales had sought external finance over the year preceding their interview. The likelihood of a business seeking finance increases with firm size; less than one in five micro businesses compared with more than two fifths of medium sized businesses.

As shown in Chart 52, SME employers in Wales are marginally less likely than those in the other UK nations to seek external finance.

Comparability and coherence
The results can be considered alongside other sources of data on SMEs in Wales such as the Business Impact of COVID-19 Survey (BICS), The analysis of Wales’ exporting behaviors of Small Medium Enterprises (SMEs), The Employer Skills Survey and Economic intelligence Wales reports.
Notes on the use of statistical articles
Statistical articles generally relate to one-off analyses for which there are no updates planned, at least in the short-term, and serve to make such analyses available to a wider audience than might otherwise be the case. They are mainly used to publish analyses that are exploratory in some way, for example:
- introducing a new experimental series of data
- a partial analysis of an issue which provides a useful starting point for further research but that nevertheless is a useful analysis in its own right
- drawing attention to research undertaken by other organisations, either commissioned by the Welsh Government or otherwise, where it is useful to highlight the conclusions, or to build further upon the research
- an analysis where the results may not be of as high quality as those in our routine statistical releases and bulletins, but where meaningful conclusions can still be drawn from the results.
Where quality is an issue, this may arise in one or more of the following ways:
- being unable to accurately specify the timeframe used (as can be the case when using an administrative source)
- the quality of the data source or data used
- other specified reasons.
However, the level of quality will be such that it does not significantly impact upon the conclusions. For example, the exact timeframe may not be central to the conclusions that can be drawn, or it is the order of magnitude of the results, rather than the exact results, that are of interest to the audience.
The analysis presented does not constitute a National Statistic, but may be based on National Statistics outputs and will nevertheless have been subject to careful consideration and detailed checking before publication. An assessment of the strengths and weaknesses in the analysis will be included in the article, for example comparisons with other sources, along with guidance on how the analysis might be used, and a description of the methodology applied.
Articles are subject to the release practices as defined by the release practices protocol, and so, for example, are published on a pre‑announced date in the same way as other statistical outputs.
Contact details
Analyst: Cerys Ponting
Telephone: 0300 025 7342
Email: stats.trade@gov.wales
Media: 0300 025 8099