Maternity and birth statistics: 2025
Statistics from antenatal, birth, and child health records including smoking during pregnancy, birth outcomes and characteristics, and birthweights for children born in Wales in 2025.
In this page
Introduction
This release provides a statistical overview of maternity and births in Wales including analyses of mothers’ characteristics.
The primary source for the number of births is published by the Office for National Statistics (ONS), which counts birth registrations. However, this release focusses on birth statistics using data sourced from Maternity Indicators dataset (maternity dataset) and the National Community Child Health Database (child health database). These align closely to ONS data but have a wider range of data items to analyse.
The maternity dataset combines a child’s birth record with their mother’s initial assessment record. There are data quality issues with certain data items which are explained in more detail in the quality report.
The child health database consists of anonymised records for all children born, resident or treated after 1987, combining data from local Child Health Systems held by local health boards.
Breastfeeding statistics are published in a separate annual release, published on 7 July 2026.
Main points
Antenatal care
- 24,339 maternity initial assessments were recorded in 2025.
- 35% of pregnant women reported a mental health condition at initial assessment.
- 34% of pregnant women were classed as obese at initial assessment, continuing the upward trend.
- Pregnant women from Black or White ethnic backgrounds were most likely to be obese.
- Pregnant women recorded as smokers was the lowest level on record.
- Smoking rates were highest among younger mothers and mothers from White and Mixed ethnic backgrounds.
Labour and births
- 43% of labours began spontaneously, continuing the longer-term downward trend.
- 42% of babies were born via caesarean section, the highest percentage on record.
- There were 26,417 live births, the lowest number since broadly comparable records began in 1929.
- 83% of births were to mothers from White ethnic backgrounds, 0.1 percentage points higher than the previous year, but more broadly showing a longer-term downward trend.
- 57% of birthing mothers were aged 30 or older.
- There were more mothers birthing aged between 35 and 39 than aged 20 to 24 for the fifth year in a row.
- Just under 2% of births were at home, a slight decrease since the previous year.
- The percentage of low birthweight singleton babies was 6.0%, a slight decrease on the previous year.
Antenatal care
Statistics presented in this section are based on the 24,339 initial assessment records (or pregnancies) included in the maternity dataset in 2025.
Initial assessments by gestational age and age of woman
The majority (88%) of initial assessments took place between 6 and 12 completed weeks gestation, with 80% of pregnant women receiving their initial assessment with maternity services by the 10th completed week of pregnancy or earlier. This is a 3 percentage point increase from 2024.
Maternity initial assessment indicators by local health board (StatsWales)
82% of pregnant women aged between 30 and 34 received an initial assessment by the end of the 10th completed week of pregnancy, the highest for any age group.
The rate was lowest (50%) for pregnant women aged under 16.
The percentage receiving their initial assessment by the end of the 10th completed week of pregnancy has largely been on an upward trend over time but with a drop across most age groups during 2022 and 2023.
Maternity initial assessment indicators for Wales, by mother's age (StatsWales)
Mental health
At their initial assessment, pregnant women are asked to self-report any mental health conditions they have. Conditions included are listed in the quality report.
Figure 1: percentage of women who reported a mental health condition at initial assessment, 2016 to 2025 [Note 1]
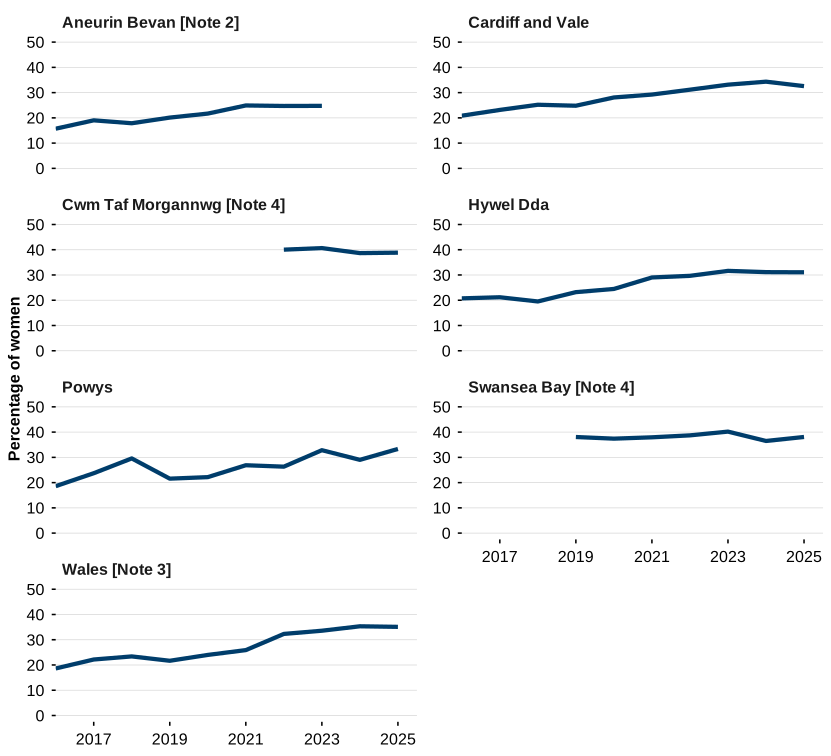
Description of figure 1: line charts showing the percentage of women who reported having a mental health condition at initial assessment has been on an overall upward trend in each health board between 2016 and 2025.
Source: maternity dataset, Digital Health and Care Wales
Maternity initial assessment indicators by local health board (StatsWales)
[Note 1] Percentages are based on all records with valid data recorded for mental health condition at initial assessment.
[Note 2] In 2024 and 2025, Aneurin Bevan health board has been excluded from analysis due to high levels of missing data (76% and 100% missing respectively).
[Note 3] For 2016 to 2023, the Wales total represents data from 5 health boards. Excluding data from Betsi Cadwaladr and Cwm Taf/Cwm Taf Morgannwg because mental health data recorded is of low reliability. A Wales total is also not presented in for 2024 due to excluding 3 health boards from the data analysis (these plus Aneurin Bevan [Note 2]). Quality issues associated with this data item are explained in the quality report.
[Note 4] In 2019, changes to the boundaries of Abertawe Bro Morgannwg led to the creation of Swansea Bay, and changes to the boundaries of Cwm Taf led to the creation of Cwm Taf Morgannwg so data prior to 2019 is not presented in this chart.
35% of pregnant women in Wales reported a mental health condition at initial assessment.
In Cardiff and Vale, this was 33%, decreasing by 2 percentage points compared with 2024. There was a 4 percentage point increase in Powys to 33%, and a 2 percentage point increase in Swansea Bay to 38% compared to 2024, and the percentage remained similar in Cwm Taf Morgannwg (39%) and Hywel Dda (31%).
Where provided, data on mental health by mother’s age and ethnic group are available on StatsWales.
Obesity
At their initial assessment, pregnant women have their height and weight measured and their Body Mass Index (BMI) is calculated. A person with a BMI of 30 or greater is considered obese.
Figure 2: percentage of women who had a BMI of 30 or more at initial assessment, 2016 to 2025 [Note 1] [Note 2]
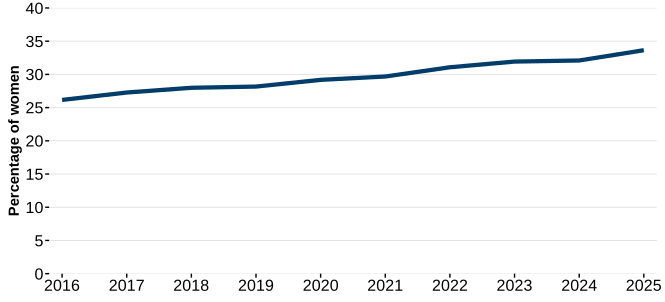
Description of figure 2: line chart showing a steady increase in the percentage of women with a BMI of 30 or more between 2016 and 2025.
Source: Maternity Indicators dataset, Digital Health and Care Wales
Maternity initial assessment indicators by local health board (StatsWales)
[Note 1] In 2024, Aneurin Bevan has been excluded from analysis due to high levels of invalid data for height leading to 77% missing data for BMI. Data for Wales represent 6 health boards.
[Note 2] The percentages are based on all pregnant women with valid data recorded for height and weight at initial assessment, who had their initial assessment at 14 completed weeks of gestation or earlier. There are some data quality issues with this data item which are explained in the quality report.
34% of pregnant women had a BMI of 30 or greater at their initial assessment, an increase of 2 percentage points from the previous year. The percentage has increased every year since data collection started in 2016 and was 7 percentage points higher in 2025 than in 2016.
Obesity by age group
By age group, there was little variation in the percentage of pregnant women with a BMI of 30 or more. The percentage varied between 33% and 46% in all age groups between 20 to 24 and 45 or over, while it was lower for the under 16 and 16 to 19 age groups (5% and 21%). Data for all age groups are available on Maternity initial assessment indicators by mother’s age (StatsWales).
Obesity by ethnic group
35% of pregnant women from Black or White ethnic groups, 33% from Other ethnic groups and 32% from Mixed ethnic groups had a BMI of 30 or more. The percentage of pregnant women from Black or White ethnic groups with a BMI of 30 or more increased by 2 percentage points since the previous year, but the percentage for the Other ethnic group increased by over 9 percentage points.
Pregnant women in the Asian ethnic group had the lowest proportion with a BMI of 30 or more out of all 5 ethnic groups at 20%.
All ethnic groups have been on broadly upward trends since data were first collected in 2016, with the Other ethnic group seeing the biggest longer term upward trend, 13 percentage points higher than in 2018.
35% of pregnant women with no stated ethnic group had a BMI of 30 or more. Data for BMI by ethnic group are available in Maternity initial assessment indicators by mother’s ethnic group (StatsWales)
See quality report for list of ethnicities included in each ethnic group.
Weight gain during pregnancy
The Institute of Medicine (IOM) guidelines recommends a total weight gain of between 12.5 and 18kg for pregnant women with a BMI of less than 18.5 (‘underweight’); between 11.5 and 16kg for pregnant women with a BMI between 18.5 and 24.9 (‘normal weight range’); between 7 and 11.5kg for pregnant women with a BMI between 25 and 29.9 (‘overweight’); and between 5 and 9kg for pregnant women with a BMI 30 or more (‘obese’).
Using data from the 6 health boards with valid data, 36% of pregnant women who were overweight at initial assessment gained more than the recommended amount of weight during pregnancy. This was a decrease from the previous year. The rate was 34% for pregnant women who were obese.
For pregnant women in the normal weight range, the rate was less than half that in the overweight group, at 14%. The rate was lowest (9%) for pregnant women who were underweight.
Data for weight gain by BMI group and health board are available Mother's weight gain between initial assessment and birth, by BMI group at initial assessment and health board providing the service (StatsWales)
Smoking at initial assessment and birth
During the initial assessment and at birth, women are either asked to self-report if they are a smoker or are tested with a carbon monoxide (CO) monitor. CO monitoring is considered more accurate than self-reporting but was largely suspended during the COVID-19 pandemic to reduce risks of virus spread. CO monitoring resumed in 2023.
Figure 3: percentage of women who were recorded as a smoker at initial assessment and at birth, 2016 to 2025 [Note 1] [Note 2] [Note 3]
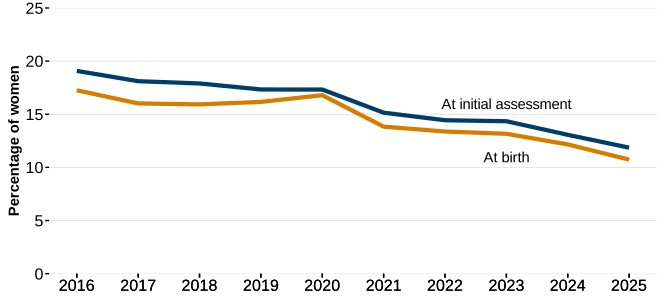
Description of figure 3: line chart showing the percentage of women recorded as a smoker at initial assessment decreased gradually until 2020, then decreased at a faster rate in the subsequent years. The percentage of smokers recorded at birth had been relatively stable until 2020 but has since decreased at a similar rate to smokers at initial assessment.
Source: maternity dataset, Digital Health and Care Wales
Smoking status of women at initial assessment and at birth by local health board (StatsWales)
[Note 1] The Wales totals do not include Swansea Bay health board from 2021 to 2024 and Hywel Dda health board from 2021 to 2023. Wales totals were calculated from 6 health boards in 2024 and from 5 health boards in 2021 to 2023. Swansea Bay was excluded from smoking at birth data due to data quality concerns and Hywel Dda was excluded as they did not provide any data for smoking at birth between 2021 and 2022 and provided incomplete data in 2023. This resulted in excluding smoking at initial assessment for Swansea Bay and Hywel Dda for these time points for compatibility purposes. See quality report for further information.
[Note 2] The percentages are based on all records with valid data recorded for smoking at initial assessment and smoking at birth separately. In 2025, 460 records (2%) had no data or invalid data recorded for smoking at initial assessment, and 503 records (2%) had no data for smoking at birth.
[Note 3] Prior to 2020, the percentage of women CO monitored at initial assessment ranged between 20% and 30%. However, between 2021 and 2022, it dropped to between 1% and 2%. In 2025, it was 26%(r), close to pre-pandemic levels. Fewer women were CO monitored at birth than at initial assessment. Between 2016 and 2020, the percentage of women CO monitored ranged from 1% to 3%. In 2025, it was 9%(r).
12% of pregnant women were recorded as smokers at their initial assessment.
11% of women were recorded as being smokers at the time they gave birth. Both rates slightly decreased from the previous year.
The large decreases in smoking rates at initial assessment between 2020 and 2023 coincide with nearly all data being self-reported, rather than being CO monitored. The change in data collection method may explain the sharp falls during this time. CO monitoring was close to pre-pandemic levels in the latest 2 years, possibly reflecting a more genuine decrease in smoking rates.
The smoking rates of pregnant women, both at initial assessment and birth, are similar to smoking rates for all women in Wales, which was 9% in 2024 to 2025 according to the National Survey for Wales.
Stopping smoking in pregnancy
16% of women who were smokers at the initial assessment were not smokers at birth. This is a decrease of 2(r) percentage points since data was first collected in 2016. There was a large increase seen in 2021 and 2022 which was likely affected by nearly all data being self-reported, rather than being CO monitored and the higher-than-usual amount of missing data.
Smoking at initial assessment and birth by age group
The percentage of pregnant women recorded as a smoker at initial assessment was higher in younger age groups and lower in older age groups.
25% of pregnant women aged under 20 were recorded as a smoker at initial assessment, compared with 18% aged 20 to 24, and 10% aged 45 or over.
Smoking rates at initial assessment have fallen over the last 5 years in nearly all age groups.
The percentage of pregnant women recorded as a smoker at birth followed a very similar pattern to smoking at initial assessment. Smoking rates were highest for pregnant women in younger age groups and lower in older age groups.
Smoking at initial assessment and birth, by ethnic group of woman
The percentage of pregnant women recorded as a smoker differs widely by ethnic group. At initial assessment, smoking rates varied from 1% of pregnant women from Asian and Black ethnic groups to 14% of pregnant women from White ethnic groups.
At birth, smoking rates varied between 1% of pregnant women from Asian and Black ethnic groups to 13% of pregnant women from White ethnic groups. Broadly speaking over time, smoking rates at birth have decreased over time for all ethnicities.
Labour characteristics
Statistics presented in this section refer to the 24,688 birthing mothers recorded in the maternity dataset which took place in 2025.
Onset of labour
Onset of labour is the method by which labour began. It includes induction methods such as surgical or medical induction or a combination but does not include methods that are used to accelerate labour.
Figure 4: percentage of labours onset by mode, 2016 to 2025 [Note 1] [Note 2]
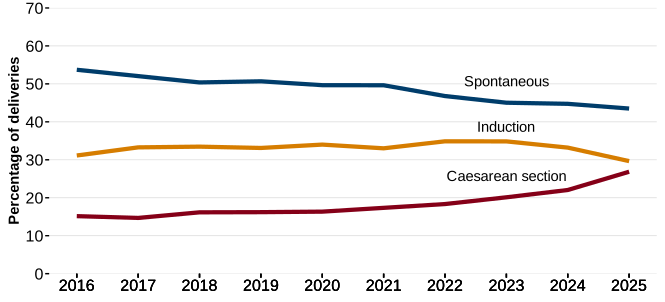
Description of figure 4: line chart showing spontaneous onset of labour has been on a downward trend, while onset by caesarean section has increased between 2016 and 2025.
Source: maternity dataset, Digital Health and Care Wales
Births by mode of onset of labour and epidural status by local health board (StatsWales)
[Note 1] Between 2016 and 2024 Aneurin Bevan did not provide correctly recorded data for this data item so have been excluded from the analysis. Hywel Dda did not provide correctly recorded data for this data item between 2016 and 2021 so have also been excluded from the analysis. Wales totals are from 5 health boards in 2016 to 2021, and 6 health boards between 2022 and 2024. See the quality report for more information.
[Note 2] The percentages are based on records with valid onset of labour data reported by the health boards that are included in the Wales total.
43% of labours began spontaneously. This is 1 percentage point lower than in the previous year and 10 percentage points lower than in 2016.
30% of labours were onset by induction, 1 percentage point lower than in 2016. 27% were onset through caesarean section, 12 percentage points higher than in 2016.
Pain relief
An epidural (NHS) was administered to 24% of birthing mothers. This has remained at a similar level since 2016.
The percentages are based on records with valid data for pain relief. For more information see the quality report.
Births by mode of onset of labour and epidural status by local health board (StatsWales)
Mode of birth
The mode of birth relates to how the baby was birthed and is often different to the mode of onset of labour.
There are 3 modes of birth recorded in the maternity dataset and they are defined as:
- caesarean section: elective and emergency caesarean section births(r)
- instrumental: forceps cephalic births(r) and ventouse (vacuum) births(r)
- spontaneous vaginal: baby born by maternal effort.
Figure 5: percentage of all births by mode of birth, 2016 to 2025 [Note 1] [Note 2]
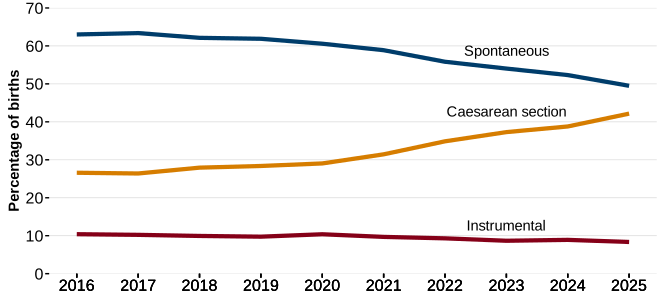
Description of figure 5: line chart showing that between 2016 and 2025, the majority of births arrived spontaneously, but spontaneous births have been on a downward trend, while caesarean sections have been on a broadly equivalent upward trend.
Source: maternity dataset, Digital Health and Care Wales
Live and still births by mode of birth and local health board (StatsWales)
[Note 1] In 2024, Aneurin Bevan did not provide correctly recorded data for this data item so have been excluded from the analysis. Data for Wales represents 6 health boards.
[Note 2] The percentages are based on records with valid data for mode of birth reported by the health boards that are included in the Wales total. For more information see the quality report.
Almost half (49%) of births were spontaneous (unassisted) vaginal births, 3 percentage points lower than in the previous year and 14 percentage points lower than in 2016.
42% were born by caesarean section, the highest on record. This is 3 percentage points higher than in the previous year and 16 percentage points higher than in 2016.
8% of births required the use of either ventouse or forceps, and this proportion has remained largely constant in since 2016.
Just over half of caesarean section births were emergencies. 22% of all births arrived by emergency caesarean section, 2 percentage points higher than the previous year and 8 percentage points higher than in 2016.
20% of all births arrived via elective caesarean section, 1 percentage point higher than in the previous year and 7 percentage points higher than in 2016.
Live and still births by mode of birth and local health board (StatsWales)
Birth outcomes and characteristics
Statistics presented in this section are based on the 26,417 live births recorded in the child health database in 2025.
Additional data on the number of maternity initial assessment records, deliveries, live and still births, by local health board (StatsWales) and baby deliveries and births, by maternity unit and local health board (StatsWales).
Number of live births
Live births can be recorded as singletons (one baby born), or multiples (twins, triplets or more babies born).
Of the 26,531 births recorded in the child health database in Wales in 2025, over 99% (26,417) were live births.
Following a small increase in 2021, the number of live births fell to its lowest number since broadly comparable data was collected in 1929.
For the 30 years prior to 2018, the number of live births ranged between 30,000 and 37,000 per year but has been below 30,000 in every year since. The number of live births has decreased by 21% compared with 10 years ago.
2% of births were for multiple children. This percentage has been relatively stable for the past 5 years, but over the longer-term, the number of multiple births has decreased by a larger proportion than singleton births. The number of multiple births has decreased by 48% compared to 10 years ago.
Births and ethnicity
Figure 6: percentage of live births by ethnic group 2025 [Note 1] [Note 2]
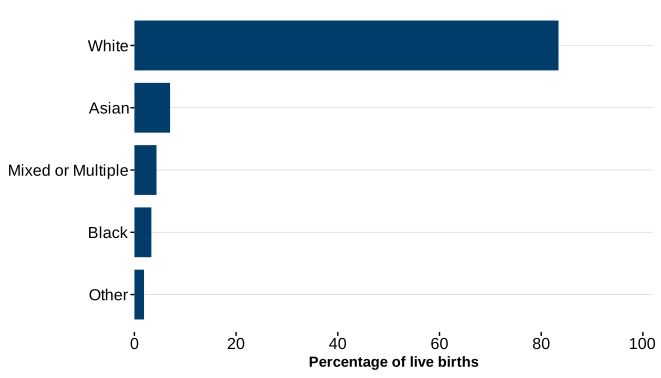
Description of figure 6: bar chart showing the large majority of births were from White ethnic background, followed by Asian, Mixed/Multiple, Black and Other.
Source: child health database, Digital Health and Care Wales
[Note 1] The percentages are based on records with valid data for child’s ethnic group. In 2025, there were 7,785 records (29.5%) which had missing or invalid data for this data item.
[Note 2] See quality report for list of ethnicities included in each ethnic group.
83% of babies born were of White ethnic background; 7% were of Asian backgrounds; 4% were from Mixed/multiple backgrounds; 3% were from Black backgrounds and 2% were from other ethnicities.
The percentage of babies from White ethnic backgrounds decreased by 6 percentage points since 2018. The percentage has increased slightly for all other ethnic groups over the same time period, with the largest increases in the Asian ethnic group (3 percentage points) and the Black ethnic group (2 percentage points). This is similar to the trends seen between the previous 2 censuses, which showed that the proportion of people from White ethnic backgrounds had decreased, while the proportion of people from Black and Asian ethnic backgrounds increased.
Births by mother’s age
Data for teenage conceptions is published by the ONS.
Figure 7: percentage of live births by age group of mother 2014 to 2025 [Note 1]
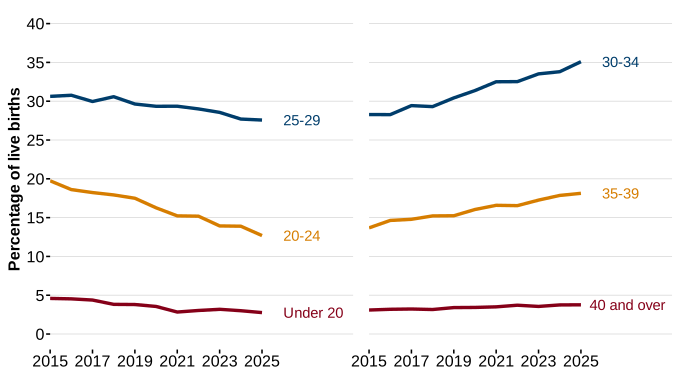
Description of figure 7: 2 line charts showing a decreasing trend for the percentage of women giving birth aged 29 and younger, and an increasing trend for women giving birth aged 30 and over, over the past 10 years.
Source: child health database, Digital Health and Care Wales
[Note 1] The percentages are based on births with valid data for mother’s age.
Most mothers were aged 30 to 34, with 35% in this age group. This percentage has been on a clear long-term upward trend and was 7 percentage points higher than ten years ago. This is consistent with a general aging of mothers.
Since 2021, there have been more mothers birthing aged 35 to 39 than there were aged 20 to 24. In 2025, 13% of births were from mothers aged 20 to 24 and over the long term this number has seen a reduction since 2009, and the figure in 2025 was 7 percentage points lower than 10 years ago.
Home births
Over the past 20 years, the majority of births have occurred in hospital settings. The percentage of home births increased slightly during 2020 and 2021, which may have been related to the COVID-19 pandemic. In 2025, 2% of live births happened at home.
0.3% of births happened in locations other than hospitals or homes.
Gestational age
Babies born prematurely or ‘pre-term’ (before the start of the 37th week of gestation) may have a higher risk of immediate or longer-term health problems.
68% of live births arrived between gestations of 38 and 40 completed weeks of pregnancy.
8% of live births occurred before the start of the 37th week of gestation.
Birthweight
Low birthweight is defined as a birthweight of less than 2.5kg and can be associated with health risks in an infant's first year of life.
The percentage of live singleton births with a birthweight of less than 2.5kg is one of 50 national indicators used to measure progress against the wellbeing goals in the Well-being of Future Generations Act.
Low birthweights are often linked to low gestational age, where the baby is born before the start of the 37th week of gestation.
Figure 8: percentage of live births with low birthweight 2014 to 2025 [Note 1]
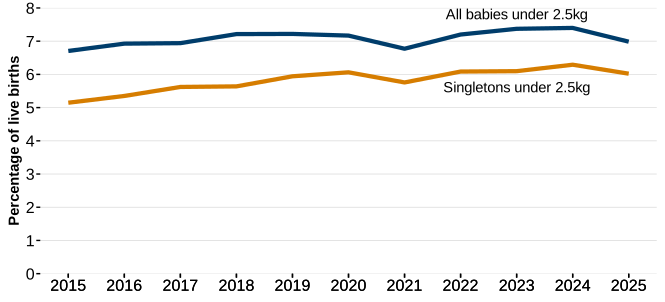
Description of figure 8: line chart showing the proportion of singleton and all live births with low birthweight has been on a general upward trend since 2014.
Source:child health database, Digital Health and Care Wales
[Note 1] The percentages are based on live births with valid birthweight data. Invalid data includes records with birthweights of less than 0.5kg or more than 6kg.
6% of singleton births had low birthweight. This is 0.3 percentage points lower than in the previous year but 0.9 percentage points higher than 10 years ago.
7% of all births had low birthweight. This is 0.4 percentage points lower than in the previous year but 0.3 percentage points higher than 10 years ago.
Multiple births are typically born at earlier gestations than singleton births. and in 2025, 62% of multiple births were born before 37 weeks of gestation, compared with 7% for singleton births.
Gestational age and birthweight
93% of births at gestations of 31 completed weeks or less weighed less than 2.5kg. This compares with 54% of births at gestations between 32 and 36 completed weeks; 3% of births at gestations between 37 and 41 completed weeks; and 1% of births at gestations of 42 or more completed weeks of pregnancy.
The large majority (86%) of babies born within 2 weeks either side of the typical expected due date (37 to 41 completed weeks) were of birthweights between 2.5kg and 4kg.
26% of babies born at gestations of 42 or more completed weeks of pregnancy weighed more than 4kg.
Low birthweight and sex
7% of female babies had low birthweight. 5% of male babies had low birthweight. These are both broadly similar to the previous year and have remained relatively stable over the past 10 years.
Low birthweight and ethnicity
Various academic studies have shown that babies of Asian ethnic background have lower mean birthweights, shorter mean lengths, and smaller mean head circumferences than babies from other ethnic groups.
The percentage of singleton babies from Asian ethnic backgrounds with low birthweight in Wales has been on a broad upward trend and reaching a high of 9% in 2022 but decreasing to just under 8% in 2025.
While low birthweight rates for babies of all 4 other ethnic groups have varied from year-to-year, they have been broadly similar to each other, having a slight upward trend over the 8 years for which data is available.
These percentages are based on births with valid data for both birthweight and ethnic group. In 2025, 7,693 records (30%) had missing or invalid data for either of these data items.
Appearance, Pulse, Grimace, Activity, and Respiration (APGAR) scores
APGAR is a quick test performed on a baby at 1 and 5 minutes after birth. The 1-minute score determines how well the baby tolerated the birthing process. The 5-minute score tells the doctor how well the baby is doing outside the mother's womb. A score of 7 or above is a sign that the new-born is in good health.
The large majority (98%) of live births had an APGAR score of 7 or over at 5 minutes, including 79% of babies who had a score of 10.
Quality and methodology information
More detailed information on the sources of data and analyses in this statistical release are provided in the quality report. This includes a table showing the percentage of valid data recorded for selected data items in both source datasets.
Coherence of data sources for births in Wales
Figure 9 shows how the number of births in Wales compares across the main data sources. The child health database has very good coverage and completeness, with the number of births closely aligning to birth registration statistics by ONS. The maternity dataset was established in 2016 and the number of births differs from the other two sources primarily because it does not include births to Welsh residents in English hospitals.
Figure 9: live births in Wales, by data source 2001 to 2025 [Note 1]
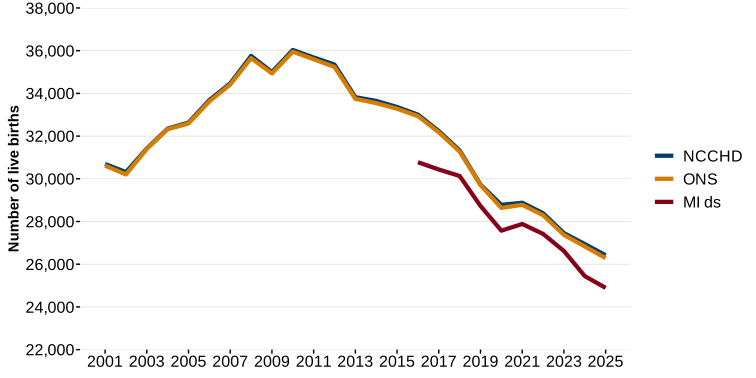
Description of figure 9: line chart showing close alignment between the number of births from the child health database and the ONS. Births from the maternity dataset are lower but follow a similar trend.
Source: maternity dataset and child health database, Digital Health and Care Wales, and ONS
Live births in Wales by data source (StatsWales)
[Note 1] Y axis does not start at zero
Development plans
The release has been shortened following a review of our statistical outputs. The changes reflect feedback from a public consultation and aim to focus commentary where it adds most value, while ensuring the underlying data remain accessible. All data are still available on StatsWales.
Please contact us with any feedback on this publication or suggestions for development.
Statement of compliance with the Code of Practice for Statistics
Our statistical practice is regulated by the Office for Statistics Regulation (OSR). OSR sets the standards of trustworthiness, quality and value in the Code of Practice for Statistics that all producers of official statistics should adhere to.
All of our statistics are produced and published in accordance with a number of statements and protocols to enhance trustworthiness, quality and value. These are set out in the Welsh Government’s Statement of Compliance.
These statistics were originally assessed and given accreditation as part of two assessments by the OSR covering Statistics on births, infant mortality and teenage conceptions (OSR) in 2011 and Statistics on health and personal social services in Wales (OSR) in 2012. Since the statistics were originally assessed, the data sources from which the statistics are generated has changed, and the maternity and births release covers a much wider range of factors than at the time of the initial assessment. Breastfeeding statistics are also now reported separately.
Given the change of data sources, OSR agreed to carry out a compliance review in July 2025 of both sets of statistics to determine whether the accredited official statistics status is still appropriate for the releases.
OSR found the Maternity and births statistics and Breastfeeding statistics to continue to comply with the Code of Practice for Statistics (UK Statistics Authority) and should continue to be designated as accredited official statistics.
These accredited official statistics (OSR) demonstrate the standards expected around trustworthiness, quality and public value in the following ways.
Trustworthiness
The data used in this statistical release are collected via two sources, the child health database and the maternity dataset. The child health database consists of anonymised records for all children born, resident or treated in Wales and born after 1987. It brings together data from the child health system databases which are held by local health boards. This is a long-established data collection and database. The maternity dataset combines a child’s birth record with their mother’s initial assessment record, where possible. There are some data quality issues with certain data items in this dataset which are explained in more detail in the quality report.
Quality
The published figures provided are compiled by professional analysts using the latest available data and applying methods using their professional judgement and analytical skillset. Statistics published by Welsh Government adhere to the Statistical Quality Management Strategy which supplements the Quality pillar of the Code of Practice for Statistics and the European Statistical System principles of quality for statistical outputs.
Data is collected by Digital Health Care Wales directly from local health boards via local Child Health Systems.
Validation checks are performed by Welsh Government statisticians and queries referred to local health boards where necessary. The statistical release is then drafted, signed off by senior statisticians and is published in line with statement on confidentiality and data access which is informed by the trustworthiness pillar contained in the Code of Practice for Statistics.
Value
The purpose of the statistical release is to provide evidence for policy development; to allow local health boards to monitor and benchmark their service provision against all other local health boards in Wales; and to inform for the wider public about provision of maternity services and information about number of births and their characteristics in Wales. This annual statistical release also supports the Welsh Government’s long-term plan for health and social care: A Healthier Wales.
You are welcome to contact us directly with any comments about how we meet these standards. Alternatively, you can contact OSR by emailing regulation@statistics.gov.uk or via the OSR website.
Well-being of Future Generations Act (WFG)
The Well-being of Future Generations Act 2015 is about improving the social, economic, environmental and cultural wellbeing of Wales. The Act puts in place seven wellbeing goals for Wales. These are for a more equal, prosperous, resilient, healthier and globally responsible Wales, with cohesive communities and a vibrant culture and thriving Welsh language. Under section (10)(1) of the Act, the Welsh Ministers must (a) publish indicators (“national indicators”) that must be applied for the purpose of measuring progress towards the achievement of the wellbeing goals, and (b) lay a copy of the national indicators before Senedd Cymru. Under section 10(8) of the Well-being of Future Generations Act, where the Welsh Ministers revise the national indicators, they must as soon as reasonably practicable (a) publish the indicators as revised and (b) lay a copy of them before the Senedd. These national indicators were laid before the Senedd in 2021. The indicators laid on 14 December 2021 replace the set laid on 16 March 2016.
This release includes 1 of the national indicators namely The percentage of live single births with a birthweight of under 2.5kg (Power BI).
Information on the indicators, along with narratives for each of the wellbeing goals and associated technical information is available in the Wellbeing of Wales report.
Further information on the Well-being of Future Generations (Wales) Act 2015.
The statistics included in this release could also provide supporting narrative to the national indicators and be used by public services boards in relation to their local wellbeing assessments and local wellbeing plans.
Contact details
Community and population health statistics
Email: stats.healthinfo@gov.wales
Media: 0300 025 8099
SFR 67/2026