New house building: April 2022 to March 2023
Information on the number of new dwellings started and completed between April 2022 and March 2023.
In this page
Introduction
This release presents information on new house building activity in Wales in the 2022-23 financial year and its impact on overall dwelling stock. It covers the new dwellings started (where building work has commenced) as well as new dwellings completed (where building work has finished and the dwelling is ready for occupation). Information on new house building is used by the Welsh Government and local authorities to assess levels of housing supply across Wales.
The information presented in this release is based on the reports of local authority building inspectors and the National House Building Council (NHBC), a Private Approved Inspector (PAI). This release does include information from other PAIs, meaning that there is a small undercount in the total number of new dwellings started and completed. We are currently exploring ways to improve the quality assurance of new house building data.
Main points
- In 2022-23, 4,556 new dwellings were started, down 19% on 2021-22.
- In the same period, 5,785 new dwellings were completed, up 10% on the previous year.
- Of the 5,785 dwellings completed, 79% were accounted for by the private sector, 17% by Registered Social Landlords (RSLs) and 3% by local authorities.
- 37% of completions were of 3-bedroom homes and 26% of completions were homes with 4 or more bedrooms.
Figure 1: Number of new dwelling starts and completions, 2013-14 to 2022-23

Description of Figure 1: A line chart showing that between 2013-14 and 2022-23, the number of new dwellings started and completed has broadly varied between 4,000 and 7,000, peaking between 2014-15 and 2017-18.
Source: Local authority building inspectors and NHBC data
Dwellings started by local authority
In 2022-23, 4,556 new dwellings were started. This was 19% fewer than the previous year (2021-22) and the second lowest figure recorded since 2013-14. The lowest figure (4,314) was recorded in 2020-21, a year heavily impacted by the coronavirus pandemic.
Based on the 2020 Dwelling stock estimates, the number of new dwellings started in 2022-23 equates to 3 new dwellings per 1,000 existing dwellings.
Figure 2: Number of new dwellings started per 1,000 existing dwellings by local authority, 2022-23
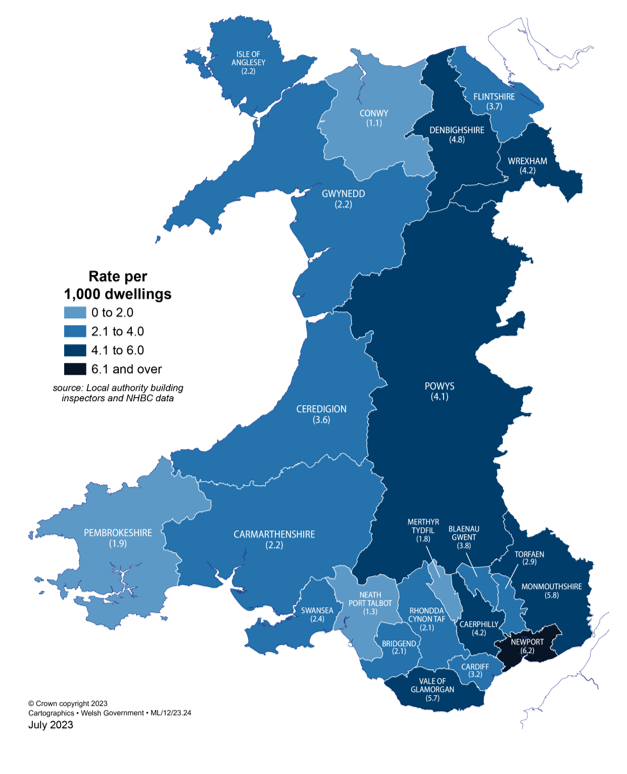
Description of Figure 2: A map showing that the number of new dwellings started per 1,000 existing dwellings tended to exceed the Wales average of 3 in the more easterly parts of Wales.
Source: Local authority building inspectors and NHBC data
New dwellings started by local authority area and dwelling type (StatsWales)
At a local authority level, the number of new dwellings started ranged from 50 in Merthyr Tydfil (equivalent to 2 new dwellings started per 1,000 existing dwellings) to 494 in Cardiff (equivalent to 3 new dwellings started per 1,000 existing dwellings).
The rate of new dwellings started per 1,000 existing dwellings ranged from 1 in Conwy and Neath Port Talbot (where 64 and 83 new dwellings were started respectively) to 6 in Monmouthshire, Vale of Glamorgan and Newport (where 247, 343 and 426 new dwellings were started respectively).
Dwellings completed by local authority
In 2022-23, 5,785 new dwellings were completed. This was up 10% on 2021-22 and similar to figures recorded prior to the pandemic (6,037 in 2019-20).
Based on the 2020 Dwelling stock estimates, the number of new dwellings completed in 2022-23 equates to 4 new dwellings per 1,000 existing dwellings.
Figure 3: Number of new dwellings completed per 1,000 existing dwellings by local authority, 2022-23
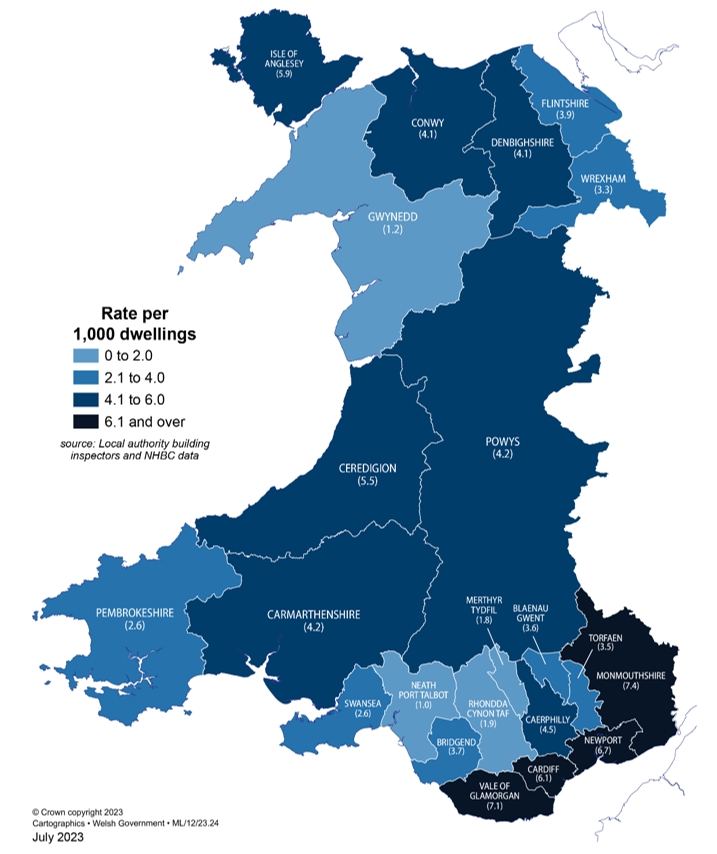
Description of Figure 3: A map showing that the rate of new dwellings completed per 1,000 existing dwellings was highest in south-east Wales.
Source: Local authority building inspectors and NHBC data
New dwellings completed by area, dwelling type and number of bedrooms (StatsWales)
At a local authority level, the number of new dwellings completed ranged from 50 in Merthyr Tydfil (equivalent to 2 new dwellings completed per 1,000 existing dwellings) to 939 in Cardiff (equivalent to 6 new dwellings completed per 1,000 existing dwellings).
The rate of new dwellings completed per 1,000 existing dwellings ranged from 1 in Neath Port Talbot and Gwynedd (where 66 and 74 new dwellings were completed respectively) to 7 in Monmouthshire, Vale of Glamorgan and Newport (where 315, 428 and 460 new dwellings were completed respectively).
Dwellings completed by tenure
It is not always possible for building control officers or the NHBC to determine the final tenure of a property. In these instances, the tenure is more likely to be recorded as private sector, leading to a potential overcount of dwellings in the private sector and a potential undercount of dwellings in the social sector. For this reason, tenure breakdowns should be treated with caution.
In 2022-23, most new dwelling completions were accounted for by the private sector (79%), with a smaller proportion accounted for by the social sector (21%). The proportion of completions accounted for by the social sector was higher than the previous year (17% in 2021-22) but lower than two years previous (26% in 2020-21).
In 2022-23, 193 completions (3% of all completions) were accounted for by local authorities. This is the highest proportion recorded in the last 10 years, with the second highest proportion (2%) recorded in 2020-21.
| Private sector | RSL | Local authority |
All tenures | |
|---|---|---|---|---|
| Isle of Anglesey | 115 | 55 | 36 | 206 |
| Gwynedd | 74 | 0 | 0 | 74 |
| Conwy | 212 | 24 | 0 | 236 |
| Denbighshire | 153 | 26 | 0 | 179 |
| Flintshire | 230 | 40 | 0 | 270 |
| Wrexham | 186 | 2 | 13 | 201 |
| Powys | 214 | 19 | 39 | 272 |
| Ceredigion | 183 | 12 | 0 | 195 |
| Pembrokeshire | 152 | 12 | 0 | 164 |
| Carmarthenshire | 244 | 66 | 60 | 370 |
| Swansea | 133 | 131 | 26 | 290 |
| Neath Port Talbot | 43 | 23 | 0 | 66 |
| Bridgend | 194 | 47 | 1 | 242 |
| The Vale of Glamorgan | 367 | 61 | 0 | 428 |
| Cardiff | 825 | 114 | 0 | 939 |
| Rhondda Cynon Taf | 147 | 56 | 0 | 203 |
| Merthyr Tydfil | 33 | 17 | 0 | 50 |
| Caerphilly | 162 | 177 | 18 | 357 |
| Blaenau Gwent | 105 | 14 | 0 | 119 |
| Torfaen | 132 | 17 | 0 | 149 |
| Monmouthshire | 288 | 27 | 0 | 315 |
| Newport | 390 | 70 | 0 | 460 |
| Wales | 4,582 | 1,010 | 193 | 5,785 |
Description of Table 1: A table of new dwelling completions by local authority and tenure showing that in 20 of 22 local authorities, more than half of new dwelling completions were accounted for by the private sector.
Source: Local authority building inspectors and NHBC data
New dwellings completed by area, dwelling type and number of bedrooms (StatsWales)
At a local authority level, the percentage of new dwelling completions accounted for by the private sector varied from 45% in Caerphilly (where 162 of 357 completions were accounted for by the private sector) to 100% in Gwynedd (where all 74 completions were accounted for by the private sector).
Focusing on the social sector, the greatest number of RSL completions were observed in Caerphilly, Swansea and Cardiff (177, 131 and 114 RSL completions, accounting for 42% of all RSL completions) while the majority of local authority completions were accounted for by Carmarthenshire, Powys and Isle of Anglesey (60, 39 and 36 local authority completions, accounting for 70% of all local authority completions).
Dwellings completed by dwelling type and bedrooms
In 2022-23, most new dwelling completions were houses or bungalows (81%). A smaller proportion of new dwelling completions were flats (19%). Since 2013-14, the proportion of dwellings completed as houses or bungalows has varied between 75% and 82%.
In the most recent year, 37% of new dwelling completions were of 3-bedroom homes and a further 26% were homes with 4 or more bedrooms. The distribution of dwellings by number of bedrooms has remained relatively stable in the past 10 years.
Typically, the private sector has focused on delivering larger homes (in 2022-23, 74% of private sector completions contained 3 or more bedrooms), while the social sector has focused on delivering smaller homes (in the same year, 79% of social sector completions contained just 1 or 2 bedrooms).
The latest Household projections (StatsWales) suggest that the numbers of 1 and 2 person households are set to increase in the next 25 years while the numbers of 4 and 5 person households is predicted to remain relatively static.
Dwellings completed across the UK
New house building has followed a similar trend across the UK, with increases seen across the four nations between 2013-14 and 2018-19. In 2019-20 and 2020-21, new house building declined as the coronavirus (COVID-19) pandemic impacted the construction industry. In 2021-22, new house building activity increased across the four nations, reaching levels similar to those observed prior to the pandemic.
| England | Wales | Scotland | Northern Ireland | |
|---|---|---|---|---|
| 2013-14 | 112,330 | 5,840 | 15,140 | 5,320 |
| 2014-15 | 124,640 | 6,170 | 16,750 | 5,500 |
| 2015-16 | 139,710 | 6,900 | 16,850 | 5,810 |
| 2016-17 | 147,520 | 6,830 | 17,140 | 6,460 |
| 2017-18 | 160,910 | 6,660 | 17,560 | 7,100 |
| 2018-19 | 169,060 | 5,780 | 21,270 | 7,810 |
| 2019-20 | 175,330 | 6,040 | 22,120 | 7,310 |
| 2020-21 | 154,630 | 4,620 | 15,750 | 6,450 |
| 2021-22 | 171,200 | 5,270 | 21,580 | 7,290 |
| 2022-23 | 5,790 | 23,510 | 6,420 |
Description of Table 2: A table showing how the number of new dwelling completions varies by UK country between 2013-14 and 2022-23. The trend is described in the text above.
Sources by country:
England: Local authority new build form returns, NHBC data and approved inspector data returns;
Wales: Local authority building inspectors and NHBC data;
Scotland: Local authority new build form returns and Scottish Government Affordable Housing Supply Programme;
Northern Ireland: District Council Building Control
[Note 1] At time of publication, 2022-23 data is only available for Wales, Scotland and Northern Ireland.
New house building in England statistics (Department for Levelling Up, Housing and Communities)
New house building in Wales statistics (Welsh Government)
New house building in Scotland statistics (Scottish Government)
New house building in Northern Ireland statistics (Northern Ireland Statistics and Research Agency)
Figure 4: Indexed number of new dwellings completed across the UK (2013-14 = 100) [Note 1] [Note 2]

Description of Figure 4: A line chart showing how new house building has varied across the UK nations since 2013-14. The trend is described in the text below.
[Note 1] The actual number of new dwellings completed varies considerably, the data shown in the chart has been indexed, with 2013-14 used as the base year and set at 100, to ensure comparability in terms of scale.
[Note 2] At time of publication, 2022-23 data is only available for Wales, Scotland and Northern Ireland.
Sources by country:
England: Local authority new build form returns, NHBC data and approved inspector data returns;
Wales: Local authority building inspectors and NHBC data;
Scotland: Local authority new build form returns and Scottish Government Affordable Housing Supply Programme;
Northern Ireland: District Council Building Control
New house building in England statistics (Department for Levelling Up, Housing and Communities)
New house building in Wales statistics (Welsh Government)
New house building in Scotland statistics (Scottish Government)
New house building in Northern Ireland statistics (Northern Ireland Statistics and Research Agency)
Figure 4 highlights a general increase in new house building across the UK between 2013-14 and 2015-16. Compared to the index year (2013-14), new house building activity begins to decline in Wales in 2016-17, followed by Northern Ireland in 2019-20. New house building activity declines across the UK as a whole from 2020-21, when the effects of the pandemic become apparent, but increases in all four nations in 2021-22.
Wider context
The latest Dwelling stock estimates show that at 31 March 2020, there were an estimated 1.4 million dwellings in Wales, marking a 5% increase on March 2010. In the past 10 years, the percentage of dwellings split between the private sector and social sector has remained stable (with 84% of dwellings accounted for by the private sector and the remaining 16% by the social sector). In the private sector, the percentage of dwellings that are privately rented has increased from 12% in 2010 to 14% in 2020. Meanwhile, in the social sector, owing to the large-scale transfer of local authority stock between 2008 and 2011, the percentage of dwellings rented by RSLs has increased from 8% to 10%.
More recent data from the 2021 Census (ONS) shows that there were an estimated 1.5 million dwellings in Wales in March 2021. Of the occupied dwellings in Wales, 66.4% were owned (either outright, with a mortgage or loan or shared ownership), 17% were privately rented and 16.5% were socially rented.
In 2020, an update to the Estimates of future housing need was published. These estimates, which are not a housing target, provide a range of need for additional housing units based on past trends and best available data. Updated estimates of housing need are due to be published in 2024.
The number of additional affordable housing units delivered through new build, purchase, acquisition, leasing or conversion is published in the annual Affordable housing provision release.
Quality and methodology information
National Statistics status
The United Kingdom Statistics Authority (UKSA) has designated these statistics as National Statistics, in accordance with the Statistics and Registration Service Act 2007 and signifying compliance with the Code of Practice for Statistics (UKSA).
National Statistics status means that official statistics meet the highest standards of trustworthiness, quality and public value.
All official statistics should comply with all aspects of the Code of Practice for Statistics. They are awarded National Statistics status following an assessment by the UK Statistics Authority’s regulatory arm. The Authority considers whether the statistics meet the highest standards of Code compliance, including the value they add to public decisions and debate.
It is Welsh Government’s responsibility to maintain compliance with the standards expected of National Statistics. If we become concerned about whether these statistics are still meeting the appropriate standards, we will discuss any concerns with the Authority promptly. National Statistics status can be removed at any point when the highest standards are not maintained, and reinstated when standards are restored.
The continued designation of these statistics as National Statistics was confirmed in 2012 following assessment by the Office for Statistics Regulation (OSR).
Since the latest review by the Office for Statistics Regulation, we have continued to comply with the Code of Practice for Statistics, and have made the following improvements:
- Included comparisons to new house building statistics for other UK nations.
- Continued to explore how administrative datasets can further our understanding of new house building. We intend to publish our findings in 2024.
- The New house building statistics page includes clear links to the data collection and Quality report.
Well-being of Future Generations Act (WFG)
The Well-being of Future Generations Act 2015 is about improving the social, economic, environmental and cultural wellbeing of Wales. The Act puts in place seven wellbeing goals for Wales. These are for a more equal, prosperous, resilient, healthier and globally responsible Wales, with cohesive communities and a vibrant culture and thriving Welsh language. Under section (10)(1) of the Act, the Welsh Ministers must (a) publish indicators (“national indicators”) that must be applied for the purpose of measuring progress towards the achievement of the wellbeing goals, and (b) lay a copy of the national indicators before Senedd Cymru. Under section 10(8) of the Well-being of Future Generations Act, where the Welsh Ministers revise the national indicators, they must as soon as reasonably practicable (a) publish the indicators as revised and (b) lay a copy of them before the Senedd. These national indicators were laid before the Senedd in 2021. The indicators laid on 14 December 2021 replace the set laid on 16 March 2016.
Information on the indicators, along with narratives for each of the wellbeing goals and associated technical information is available in the Wellbeing of Wales report.
Further information on the Well-being of Future Generations (Wales) Act 2015.
The statistics included in this release could also provide supporting narrative to the national indicators and be used by public services boards in relation to their local wellbeing assessments and local wellbeing plans.
Contact details
Statistician: Holly Flynn
Email: stats.housingconditions@gov.wales
Media: 0300 025 8099
SFR 61/2023