NHS activity and capacity during the coronavirus (COVID-19) pandemic: 12 November 2020
Data on coronavirus and NHS activity and capacity up to 11 November 2020
In this page
1. National headline figures
In response to the coronavirus (COVID-19) pandemic, daily information on health care has been produced to support transparency and understanding of the NHS activity and capacity. The release includes figures on invasive ventilated beds by use, admissions and hospitalisation of COVID-19 related patients, and attendances to Accident and Emergency (A&E) departments.
Main points
- The number of new daily admissions with suspected or confirmed COVID-19 fluctuates. Since the end of September 2020, the 7 day rolling average has generally increased, and in the last 7 days, an average of 96 people a day were admitted to hospital as confirmed or suspected with COVID-19.
- The total number of beds occupied with COVID-19 related patients (confirmed, suspected and recovering) has seen an overall increase since the end of September 2020, now exceeding levels seen at the peak in April 2020.
- As at 10 November 2020, 1,529 beds were occupied with COVID-19 related patients representing 20% of all hospitalisations. This is an increase from 1,344 beds the same day in the previous week. 983 beds were occupied with confirmed COVID-19 patients, an increase on the previous week and exceeding April 2020 levels.
- As at 10 November 2020, 68 invasive ventilated beds were occupied with COVID-19 related patients (confirmed, suspected and recovering). In the latest week the number of beds occupied has increased. This compares to 164 at the peak in April.
Accompanying tables for this release are available, including all the data shown below and also data concerning general and acute beds.
Statistics on 111 and NHS Direct calls, NHS staff absence and emergency ambulance calls are available on StatsWales as well as all other statistics in this release. Additionally, information on beds, hospitalisations and admissions is published on weekdays at 12pm, on StatsWales containing data up to the previous day. After 12pm on Thursdays, the data shown in this release will not contain the most up to date published data. However, this weekly release provides additional commentary on trends in the data.
The data are taken from management information and are subject to change. They have not been subject to the same validation processes undertaken for official statistics releases. Where available, the official statistics should continue to be considered the authoritative source of data. Please see the Chief Statistician’s blog for more information on reporting management information, data quality and transparency.
2. Hospital activity and capacity
This section covers the number of admissions and hospitalisations of COVID-19 related patients and invasive ventilated beds occupied with COVID-19 related patients, to support transparency and provide an understanding of NHS activity and capacity during the COVID-19 pandemic.
Hospital coverage has changed over time, please see the quality and methodology information section for more information.
Hospital admissions
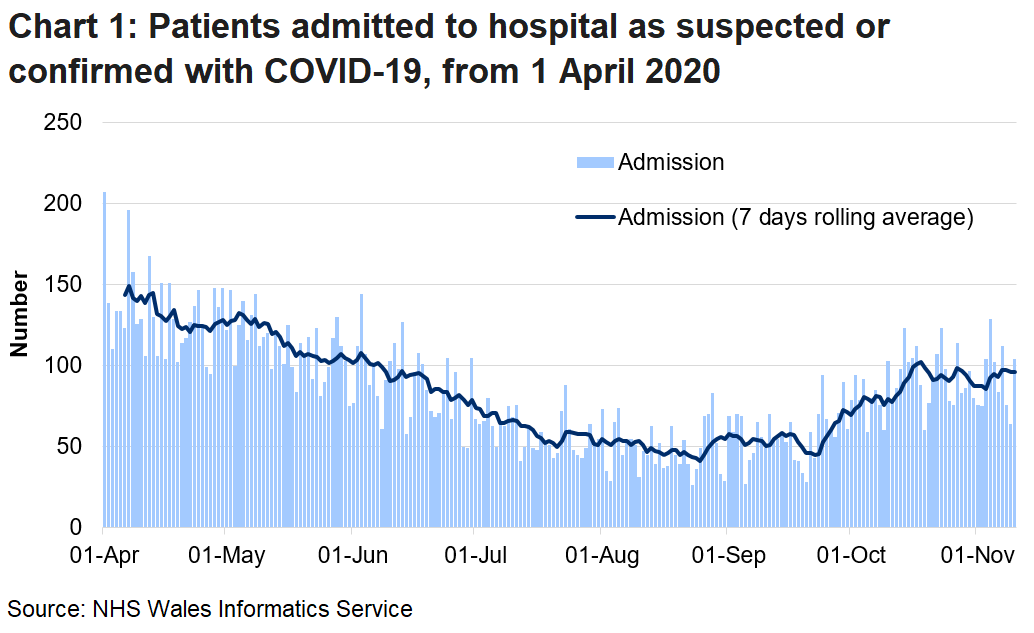
Patients admitted to hospital as suspected or confirmed with COVID-19, from 1 April 2020 (MS Excel)
Notes
Admissions are the number of patients admitted to hospital between 9am on the update date and 9am the day before. COVID-19 related admissions include COVID-19 suspected or confirmed patients.
The health minister announced on 13 March that all non-urgent activity should stop to prepare for the pandemic. Following the re-introduction of elective procedures from June 2020, patients admitted for elective procedures suspected of having COVID-19 were initially captured in COVID-19 related admissions, even if they received a negative test later. This inflated the numbers of suspected cases in hospital at the time of reporting. From 29 June, patients admitted for elective procedures were only included in COVID-19 related admissions if they received a positive COVID-19 test result on arrival at the hospital.
From 29 June, the guidance also changed to explicitly ask health boards to exclude transfers between acute and community hospitals from admissions figures. Prior to this, some transfers may have been captured as new admissions.
As at 10 November 2020
- Since the end of September, there has been an overall increase in admissions, although there is volatility in the daily numbers. In the last week there has been a slight increase in admissions.
- In the last 7 days, an average of 96 people a day were admitted to hospital as confirmed or suspected with COVID-19, this compares to an average of 86 for the week to 3 November 2020. The average has generally been increasing since 23 September 2020.
Hospitalisations

Notes
Recovering patients was a category introduced on 26 May to capture patients who were COVID-19 positive in hospital and who showed no symptoms for 14+ days but remained in hospital on a COVID-19 treatment pathway, often for rehabilitation. There have been some differences in reporting by health boards in the time series which are outlined in more detail in the Quality and methodology information section.
Please see the Chief Statistician’s blog for more information on reporting on recovering patients.
As at 10 November 2020
- The number of confirmed COVID-19 patients in hospital has seen an overall increase since September 2020, exceeding April 2020 levels. The number of COVID-19 confirmed and suspected patients has reached levels similar to those in April 2020.
- 1,529 beds were occupied with COVID-19 related patients (confirmed, suspected and recovered) representing 20% of all hospitalisations. This is an increase from 1,344 beds on the same day in the previous week (17% of all hospitalisations).
- 983 beds were occupied with confirmed COVID-19 patients.
- 251 beds were occupied with suspected COVID-19 patients and 295 with recovering COVID-19 patients.
Invasive ventilated beds

Number of invasive ventilated beds by use, from 1 April 2020 (MS Excel)
Notes
Baseline relates to the number of beds that were available prior to the COVID-19 pandemic. There are usually 152 critical care beds available. Invasive ventilated beds include beds in and outside a critical care setting, and include surge capacity. COVID-19 patients in this chart include suspected, confirmed, and recovering COVID-19 patients.
From June 2020, hospitals began closing some of the additional surge capacity that was previously put in place for the COVID-19 pandemic.
From 19 October 2020 specialist critical care beds have been included in these figures. Please see the Quality and methodology section for more information.
As at 10 November 2020
- The number of invasive ventilated beds occupied by COVID-19 related patients (confirmed, suspected and recovering) has decreased overall since a peak in April 2020, however there has been an increase since September 2020.
- 68 invasive ventilated beds were occupied with COVID-19 related patients. This compares to 54 beds on the same day in the previous week, and to 164 at the peak in April.
Information on healthcare presented in the UK Government COVID-19 dashboard and in the Public Health Wales (PHW) dashboard differ from this publication. Please see the quality and methodology information section and the Comparability with other publications section for more information.
3. A&E attendances
This section covers daily information on attendances to Accident and Emergency (A&E) departments in Wales, to further support transparency and provide an understanding of NHS activity and capacity during the COVID-19 pandemic.
The data are taken from management information and are subject to change. The latest data have not been subject to the same validation processes undertaken for official statistics releases. The official statistics should continue to be considered the authoritative source of data.
Please see the Chief Statistician’s blog for more information on reporting management information, data quality and transparency.

Number of daily A&E attendances to major and minor hospitals, from 1 February 2020 (MS Excel)
Notes
- A&E attendances to major and minor hospitals, from all mode of transports across Wales.
- Some small minor A&E units are not able to submit daily data, therefore there is probably a small undercount in total attendance.
- The five-year average uses data from the years 2015-2019. For data on the 29th February, only data from the year 2016 and 2020 is included.
A&E attendances fell sharply from mid-March to around half the previous number. Attendances increased gradually from early April close to pre-pandemic levels. However, since the end of September, A&E attendances have generally decreased.
4. Quality and methodology information
The data are taken from management information and are subject to change. They have not been subject to the same validation processes undertaken for official statistics releases. However, they are provided to support transparency and understanding of NHS activity at this time. The official statistics should continue to be considered the authoritative source of data.
Historic data are subject to revisions and therefore may differ slightly to previously published information.
Hospital activity and capacity
Following further validation, data prior to 1 April 2020 were decided to not be suitable for publication. Therefore, the time series begins on 1 April 2020.
Figures on hospital and activity include data from acute hospitals from 1 April 2020, field hospitals from 20 April 2020, community hospitals from 23 April 2020, mental health units from 10 July, and exclude data from private hospitals.
Data from mental health units were included retroactively from 10 July for the first time in the release on 20 August 2020. The inclusion of mental health beds had a small impact on beds occupied with COVID-19 patients’ figures but a large impact on all beds occupied with non-COVID19 patients and vacant beds, as the majority of mental health patients are not occupied by COVID-19 patients. Mental health units’ data are submitted each Friday, and the Friday position is used as proxy for the following week, unless there is a major change in circumstances.
From 19 October, data for specialist critical care beds (such as those in Burns and Plastic in Morriston) and other specialist acute beds (such as maternity) across other acute sites have been included. These beds have been included in the data as they are part of the available bed stock, and may be used for COVID-19 patients in exceptional circumstances The majority of these beds are not occupied with COVID-19 patients. Therefore the inclusion of these had very little impact on the number of beds occupied with COVID-19 patients but a larger impact on vacant beds and those occupied with non-COVID19 patients.
On reporting recovering patients, Aneurin Bevan started reporting recovering patients from 7 June, but these were captured in the confirmed COVID-19 category before. Cardiff and Vale classified recovering patients as non-COVID-19 patients between 1 May and 22 May. Following the change in guidance, Cardiff and Vale re-categorised these patients as COVID-19 patients, capturing them in the confirmed COVID-19 category until the recovering category was introduced on 26 May.
Comparability
Please see the UK Government COVID-19 dashboard for information on healthcare at a UK level. Note: the healthcare data presented in the UK dashboard differ from this publication. The UK dashboard includes data for acute hospitals only to enable better comparability with other countries, whereas this publication includes data from acute, community, field health hospitals and mental health units to provide a more comprehensive view of the system in Wales. Estimates of the number of people who had coronavirus in England and Wales is also published by the Office for National Statistics in their Coronavirus (COVID-19) Infection Survey.
Please note that health care surveillance data presented in the Public Health Wales (PHW) dashboard differ from this publication. The PHW dashboard uses data systematically collected through ICNET, the hospital infection control data system used across Wales. It includes hospital in-patients with a laboratory confirmed result and does not count any patients who were admitted and discharged on the same day.
The Welsh Government publication uses data sourced from daily management information provided by health boards. Guidance was issued to local health boards for completion and submission of the data return. However, data collection methods may vary between health boards. It includes COVID-19 related patients as suspected, confirmed and recovering, as well as non-COVID-19 patients.
The narrower definition used by PHW will likely result in smaller numbers of reported COVID-related admissions compared to the Welsh Government publication, but provides a systematic way of carrying out surveillance of patients requiring hospital stays with confirmed COVID-19.
National Statistics status
These statistics are not National Statistics. However, as far as has been practicable, they have been collected and validated in accordance with the pillars and principles within the Code of Practice for Statistics. We continue to develop the data collection and quality assurance process to improve the data.
These statistics have been produced quickly in response to developing world events.
Well-being of Future Generations Act (WFG)
The Well-being of Future Generations Act 2015 is about improving the social, economic, environmental and cultural wellbeing of Wales. The Act puts in place seven wellbeing goals for Wales. These are for a more equal, prosperous, resilient, healthier and globally responsible Wales, with cohesive communities and a vibrant culture and thriving Welsh language. Under section (10)(1) of the Act, the Welsh Ministers must (a) publish indicators (“national indicators”) that must be applied for the purpose of measuring progress towards the achievement of the wellbeing goals, and (b) lay a copy of the national indicators before the National Assembly. The 46 national indicators were laid in March 2016.
Information on the indicators, along with narratives for each of the well-being goals and associated technical information is available in the Well-being of Wales report.
Further information on the Well-being of Future Generations (Wales) Act 2015.
The statistics included in this release could also provide supporting narrative to the national indicators and be used by public services boards in relation to their local wellbeing assessments and local wellbeing plans.
Next update
The next release will be at 9.30am Thursday 19 November.
5. Contact details
Statistician: Christopher Ravenscroft
Telephone: 0300 025 3193
Email: stats.healthinfo@gov.wales
Media: 0300 025 8099
SFR 201/2020