NHS beds: April 2018 to March 2019
Number of NHS beds at Wales and Local Health Board level for April 2018 to March 2019.
In this page
Definitions
Average daily available beds: The average daily number of available staffed and temporary beds. It excludes those in special care baby units or intensive therapy units.
Average daily occupied beds: The average daily number of beds occupied by patients under the care of a consultant in a particular treatment specialty. The number only includes inpatients, not day cases.
Percentage occupancy: The proportion of available beds which are occupied by patients under the care of a consultant in a particular treatment specialty.
Full definitions are in the NHS beds: quality report.
Main points
- The long-term trend shows that, while the average number of beds has decreased, the percentage occupancy has increased.
- Average daily available beds continued to fall this year and has now declined by almost a third since 1996-97.
- The percentage occupancy of available NHS beds has generally increased since 1996-97. However there has been a small decrease over the previous 2 years.
- Out of the eight health boards and trusts, six had decreases in available beds this year whilst three had increases in percentage occupancy.
- Old age psychiatry was the treatment speciality with the largest decrease in available beds compared to last year. General medicine had the largest increase.

Number of daily available beds and percentage occupancy
Latest data
- In 2018-19, the average daily available NHS beds was 10,564, the lowest on record.
- In 2018-19, the percentage occupancy of NHS beds was 86.8%.
Change since last year
- Over the last year, the average available beds has fallen by 149 (1.4%).
- The percentage occupancy has fallen by 0.2 percentage points since 2017-18.
Ten year change
- The average number of available beds has fallen by 2,552 (or 19.5%) since 2008-09. The fall in average available beds between years has slowed compared to 10 years ago. From 2007-08 to 2008-09,there was a decrease of 241 beds (a fall of 1.8%), compared to the decrease of 149 beds this year (1.4%).
- The percentage occupancy has increased by 4.3 percentage points since 2008-09. The percentage occupancy is fairly stable from year-to-year typically with a small percentage increase.
Change since 1996-97
- The average number of available beds has fallen every year since the QueSt 1 return was first available in its current form in 1996-97. During this time there has been an overall decrease of 5,019 (32.2%) beds from 15,582 to 10,564.
- Percentage occupancy has increased by 8.5 percentage points since 1996-97. There has been a steady upward trend in percentage occupancy since data was first collected on a comparable basis.
Policy context
- The long term strategy for healthcare in Wales is to provide care closer to home by increasing community and GP services. More detail on this can be found in 'A healthier Wales: the long term plan for health and social care'.
- Advances in healthcare technology have also resulted in shorter lengths of stay and more day surgery. Data on average length of stay is available from PEDW online.
Summary by local health board
Latest data
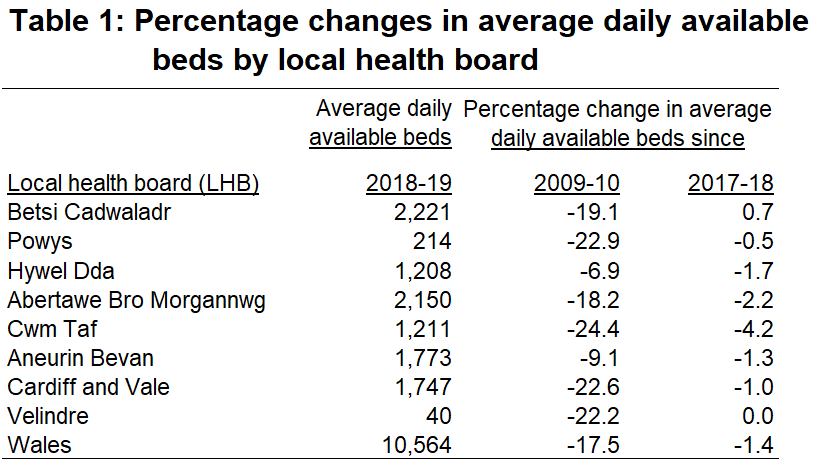
- In 2018-19, Betsi Cadwaladr and Abertawe Bro Morgannwg had the most average daily available beds (2,221 and 2,150 respectively).
- Velindre and Powys had the least available beds (40 and 214 respectively).
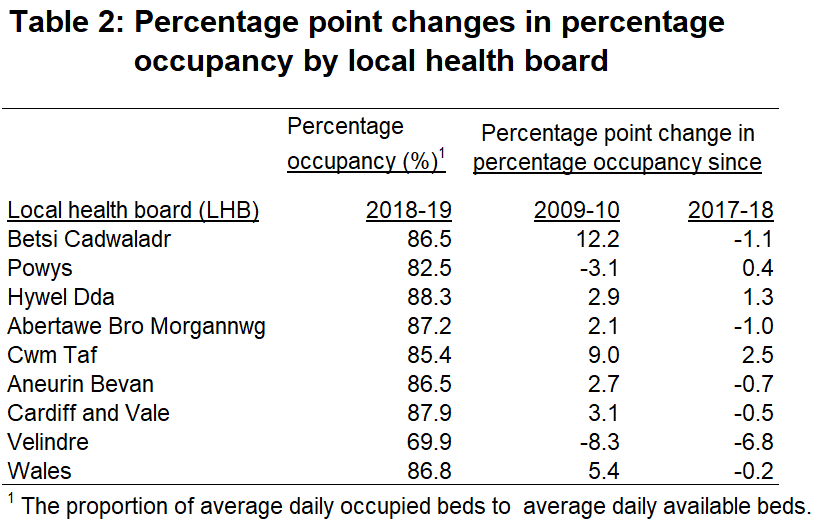
- Hywel Dda had the highest percentage occupancy of available beds with 88.3%, Velindre had the least with 69.9%.
Change since last year
- The average daily available beds decreased between 2017-18 and 2018-19 in six out of the eight local health boards and trusts in Wales.
- Betsi Cadwaladr was the only health board that had an increase in beds during this time, while Velindre stayed the same.
- Percentage occupancy increased in three of the local health boards/trusts; Cwm Taf, Hywel Dda and Powys; while there were decreases in the remaining boards/trusts.
- Cwm Taf had the largest increase in percentage occupancy (2.5 percentage points), while Velindre had the largest decrease (6.8 percentage points) in percentage occupancy.
Change since 2009-10
The health boards covered by this report were established in 2009-10, since then, average number of daily available beds has decreased in all of them.
- Betsi Cadwaladr had the largest decrease of 523 beds (19.1%).
- Velindre had the smallest decrease of 11 beds (22.2%) (but is far smaller than the seven health boards).
- Six health boards had increases in percentage occupancy. Betsi Cadwaladr had the largest increase, rising by 12.2 percentage points from 74.3% to 86.5%.
- Of the 2 health boards with a decrease in occupancy, Velindre had the largest, falling by 8.3 percentage points from 78.3% to 69.9%.
Summary by treatment specialty
Please note: some of the changes highlighted below may have been due to reclassification of treatment specialities. It is also possible that changes to coding specification affects the numbers recorded.
The following commentary focusses on the top ten treatment specialties this year. Data on all specialities is available on StatsWales.
Latest data
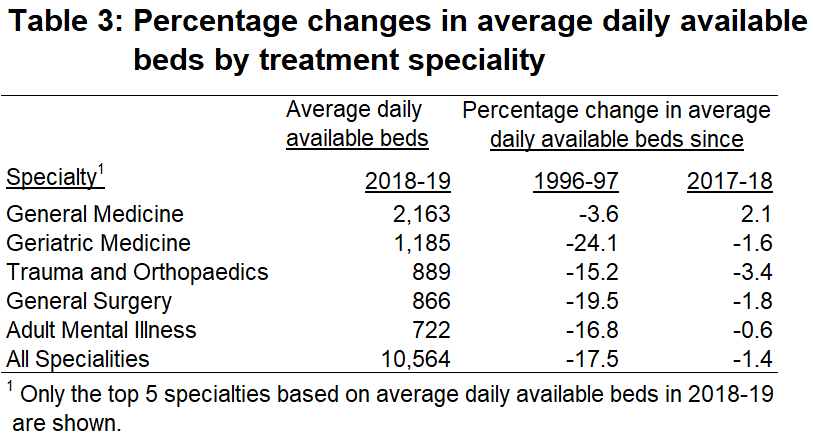
- The top five treatment specialties in 2018-19 accounted for 55.1% of Wales’ average daily available beds.
- The treatment specialty in 2018-19 with the largest average daily available beds was general medicine, with 2,163 beds.
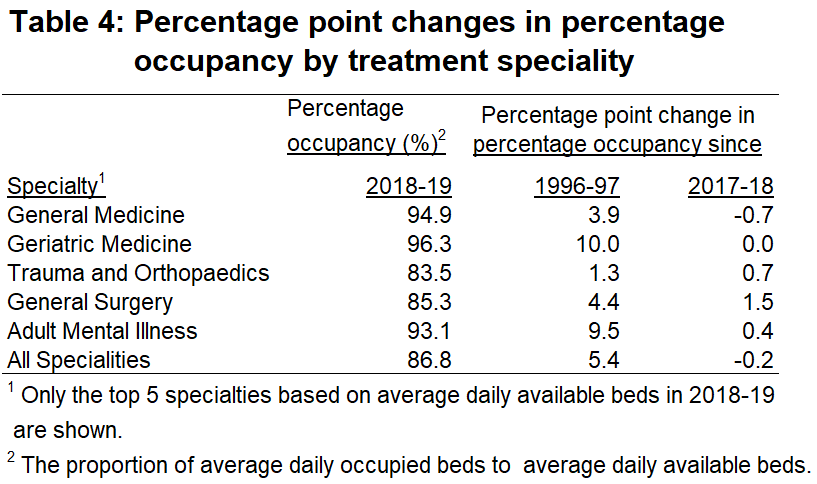
- Of the top five largest specialities, geriatric medicine had the highest percentage occupancy in 2018-19 (96.3%). trauma and orthopaedics had the lowest percentage occupancy this year (83.5%).
Change since last year
- Between 2017-18 and 2018-19, the largest fall in available NHS beds by specialty was in old age psychiatry (down 51 beds, or 8.5%).
- General medicine had the largest increase in available beds (up 45 beds, or 2.1%). In this specialty, the percentage occupancy has decreased slightly (by less than a percentage point) compared to 2017-18.
- Between 2017-18 and 2018-19, the largest fall in percentage occupancy was for accident and emergency which decreased by 13.7 percentage points from 66.9% to 53.2%.
- The largest increase in percentage occupancy was in ophthalmology, 10.4 percentage points from 75.7% to 86.0%.
Change since 1996-97
- The largest fall in available beds is in geriatric medicine (58.4%) and old age psychiatry (59.7%). These have both fallen by over half since 1996-97.
- Rehabilitation service saw the largest increase in available beds with almost two and a half times (241.5%) more beds than in 1996-97.
- From the largest specialities this year, geriatric medicine saw the largest increase in percentage occupancy. It increased by 14.3 percentage points to 96.3% this year.
- There were no decreases in percentage occupancy amongst the largest specialities this year.
Quality and methodology information
Provides a summary of information on this output against five dimensions of quality.
Contact details
Statistician: Chris Wallace
Telephone: 0300 025 7316
Email: stats.healthinfo@gov.wales
Media
Telephone: 0300 025 8099
SFR 67/2019