NHS dental services: April 2021 to March 2022
Number of patients receiving NHS dental treatment, the type of treatments provided and the numbers of NHS dentists for April 2021 to March 2022.
In this page
Introduction
The statistics in this release are based on NHS dental work completed by a NHS dentist in Wales, which has been submitted for payment. Data are processed and supplied by NHS Business Services Authority.
This release provides a summary of completed NHS dental activity during 2021-22 by NHS dentists. It includes data on the number of courses of treatment completed, specific treatments undertaken, dental workforce, number of patients treated within the past 24 months, and orthodontic activity. A definition for treatment can be found in the quality and methodology section.
Comparable data is available from when the current dental contract was introduced in 2006.
Impact of COVID-19
The coronavirus (COVID-19) pandemic has had a significant impact on the provision of dental services in Wales. Data is affected from the last quarter of the financial year 2019-20 to the full financial years 2020-21 and 2021-22. The Red Dental Alert Level was introduced on 23 March 2020 and limited dentists in the types of treatments they could carry out.
Additionally, Urgent Dental Centres (UDC) were established during the Red Dental Alert phase and activity data was not recorded in the usual way. Some of these centres are still operational and as a result, some data reported in this statistical release for 2020-21 and 2021-22 will be a small undercount of the true activity which occurred.
More detail is provided in the quality and methodology section.
Main points
The COVID-19 pandemic and infection control measures used in dental practices have affected the number of patients seen by NHS dentists in Wales. In the 24-month period ending March 2022, just over 732,000 adults (or 28.8% of the adult population) and just fewer than 250,000 children (or 39.4% of the child population) were treated by NHS dentists in Wales.
In 2021-22, just under 1.1 million courses of treatment were recorded. This is an increase of over 92.5% from the previous year, which was markedly affected by the pandemic, but is 55.1% lower than the year prior to the pandemic (2019-20).
The most common treatment band was for Band 1 treatments, accounting for just under half of all courses of treatment. Activity increased for all treatment bands except free treatments which decreased by 19.3%. Please see the quality and methodology section for the treatment definition.
The number of urgent treatments have increased slightly since the pandemic began and just over a fifth of all courses of treatment in 2021-22 were urgent.
The number of orthodontic treatments, radiographs and ‘other treatments’ for children have returned to pre-pandemic levels, but all of the other most common clinical treatments for both adults and children remain below their pre-pandemic levels.
In 2021-22, £19.0 million revenue was generated from patient charges, which was more than double (104.8%) the revenue in 2020-21, but below the pre-pandemic level of £34.9m in 2019-20.
The pandemic has not had a large impact on the number of dentists performing NHS work in Wales. Following a small decrease in 2020-21, there were 1,420 dentists with NHS activity recorded in Wales in 2021-22. This is an increase of 2.2% (or 31 more dentists) than in 2020-21.
For the first time on record, over half of the dentists with NHS activity recorded were female in 2021-22.
Patients treated
‘Patients treated’ counts the number of unique patients that have been treated during the last 24 months; each patient is counted only once even if they have received multiple episodes of care over the period.
A 24-month period is used for these statistics as the National Institute for Health and Care Excellence (NICE) recommends that patients are recalled for check-ups at intervals of three months to 24 months depending on the individual’s oral health status.
Note that patients may not be treated in their resident health board and orthodontic patients are included in the patients seen measure.
Statistics on the percentage of the population who received NHS dental services in 2020-22 are based on mid-2020 population estimates from the Office for National Statistics (ONS) as the mid-2021 population estimates are not scheduled to be published until November 2022. As such they should be treated with caution and considered provisional. See the quality and methodology section for more information.
More information on the method for counting patients treated is in the quality report.

(a) Adults: Number of resident population aged 18 years or over. Children: Number of resident population aged 0 to 17 years.
Chart 1 shows the proportion of adults and children who were treated in Wales since 2006.
The percentage of adults treated in Wales was broadly stable between 2006 and 2020, but there were clear falls in 2021 and in 2022, which are affected by the pandemic.
The percentage of children treated in Wales had been increasing in the five years prior to the pandemic but decreased sharply in 2021 and 2022.
In the 24-month period ending March 2022, a little more than 730,000 adults (or 28.8% of the adult population) and a little fewer than 250,000 children (or 39.4% of the child population) were treated by NHS dentists. Overall, 980,201 patients (or 30.9% of the total population) were treated.
Compared to the 24-month period ending March 2021, the number of adults treated decreased by 36.2% (or 414,713 patients) and the percentage of the adult population treated decreased by 16.3 percentage points.
The number of children treated decreased by 33.6% (125,246 patients) and the percentage of children treated decreased by 19.9 percentage points.
Overall, there was a decrease of 35.5% (539,959 patients) in the total number of patients treated, and the percentage of the total population treated decreased by 17.0 percentage points. This is the largest decrease for both adults and children since the series began in the 24-month period ending March 2006.
Activity: courses of treatment
The activity data in this release is based on completed treatments recorded through FP17W forms (NHS Business Services Authority). Treatments are split into treatment bands such as Band 1, Band 2, Band 3, and Urgent treatments, which are used to determine the charge paid by patients.
The quality report has more information about courses of treatment activity.

Courses of treatment by treatment band (StatsWales)
Note that dental activity was not recorded by Urgent Dental Centres (UDC) in the usual way during the COVID-19 pandemic. Therefore some data for 2020-21 and 2021-22 were a small undercount of actual dental activity.
In the ten years prior to the COVID-19 pandemic, between 2.3 and 2.4 million courses of treatment were completed per year by NHS Wales dentists. The majority of treatments were categorised as Band 1, which had been steadily increasing since 2010-11. 2020-21 was affected by the pandemic and there was a sharp decrease in treatments for all bands apart from urgent treatments, which increased slightly.
In 2021-22, just over 1 million courses of treatment were recorded. Band 1 treatments were the most common treatment band, accounting for just under half (461,494) of all courses of treatment. Just over a fifth of all treatments (or 230,106 treatments) were urgent, the highest number on record. In contrast the number of free treatments was at its lowest level on record (6,934 treatments).
Compared with 2020-21, the total number of courses of treatment almost doubled (92.5% increase) but remains well below pre-pandemic levels. The number of free treatments decreased by 19.3%; however, there were increases in all other treatment bands ranging from a 198.3% increase for Band 1 treatments to a 2.7% increase in urgent treatments.
Data for Units of Dental Activity (UDA) are available on StatsWales.
Patient charges
Patient charges are paid by adult patients who are eligible to pay for treatment. The amount charged is determined by the treatment band. Some patients do not pay for their NHS treatment. The main groups of non-charge paying patients are children (aged under 18); 18 year olds in full time education; pregnant women and nursing mothers; and adults on low income or in receipt of certain benefits.
In 2021-22, £19.0 million revenue was generated from patient charges, which was more than double (104.8%) the revenue in 2020-21 (£9.3 million). See StatsWales for further data on revenue generated from patient charges and the quality report for more information about patient charges.

Chargeable courses of treatment by patient type (StatsWales)
Chart 3 shows the number of chargeable courses of treatment given to different patient types since 2011-12.
In the years prior to the pandemic, the number of courses of treatment given to paying adults increased each year between 2011-12 and 2018-19 with a slight fall in 2019-20, while the number given to non-paying adults has had a downward trend since 2013-14. The number of courses of treatment for children were stable, with a slight upward trend since 2016-17. There were large falls for all categories in 2020-21 followed by an increase in 2021-22 with both years affected by the pandemic.
In 2021-22, there were just over 520,000 chargeable courses of treatment for paying adults, a little fewer than 240,000 treatments for non-paying adults and just over 270,000 treatments for children.
Compared with 2020-21, the number of chargeable courses of treatment has increased for all patient types. There was a 80.8% increase for paying adults, an 81.6% increase for non-paying adults and, an 143.8% increase for children.
Activity: clinical dental activity
Numbers of clinical treatments are estimates based on a full financial year of clinical data and are presented as they are recorded in the FP17W form (NHS Business Services Authority). There may be a very small number of treatments recorded incorrectly, where for example a complex treatment miscoded into a lower band, such as inlays being recorded in Band 2. As there is no additional information available to validate this data, no adjustments are made in these circumstances.
Please note the figures for the number of examinations for adults and children in 2020-21 have been revised due to an error in the source data. See the quality and methodology section for more information.

(a) Based on the following treatment bands: Bands 1 to 3, Urgent.
(b) A patient can receive more than one clinical treatment within a single course of treatment.
(r) Examination data for 2020-21 revised from previous publication. See quality and methodology section for more information.
Clinical treatments for adults (StatsWales)
Chart 4 shows the number of clinical treatments for adults by treatment type and year since 2011-12, for the five most common clinical treatments prior to the pandemic.
In the years prior to the pandemic, the number of dental examinations performed on adult patients had been on an upward trend, with the number of examinations performed in 2019-20, 18.9% higher than in 2011-12. Similarly, the number of radiographs had also been on an upward trend, increasing by half (50.4%) over the same time period. The number of scale and polish treatments had remained stable, while there has been a slight downward trend in the number of permanent fillings and sealant restorations. In 2020-21 there were sharp decreases for all of the most common treatments as a result of the pandemic.
2021-22 was also affected by the pandemic and there were increases for the majority of the most common treatments. Just under 624,000 examinations were recorded, which was more than double (up 114.4%) than in 2020-21 but almost two thirds lower than pre-pandemic levels (down 59.6%). There were significant increases for radiographs (up 114.6%), which became the second most common treatment with just under 350,000 treatments in 2021-22. Permanent fillings and sealant restorations also increased sharply (up 94.0%). However, these figures remain below pre-pandemic levels. There was a large decrease in the number of scale and polish treatments compared to 2020-21 (down 69.2%). This treatment is now a fraction of pre-pandemic levels (down 99.5%).
A full list of clinical treatments is provided in the quality and methodology section.

(a) Based on the following treatment bands: Bands 1 to 3, Urgent.
(b) A patient can receive more than one clinical treatment within a single course of treatment.
(r) Examination data for 2020-21 revised from previous publication. See quality and methodology section for more information.
Clinical treatments for children (StatsWales)
Chart 5 shows the number of courses of treatment for children for the five most common clinical treatments prior to the pandemic since 2011-12.
In the years prior to the pandemic, the number of examinations performed on children had been on an upward trend, increasing 18.2% between 2011-12 and 2019-20. There was also a large increase in the number of fluoride varnish treatments performed, increasing from just over 17,000 treatments in 2011-12 to over 275,000 treatments in 2019-20. This increase is consistent with guidelines from the Welsh Government’s funded NHS dental programme, ‘Designed to Smile’ (NHS Wales), which advocates the routine use of fluoride to improve children’s dental health.
The initial impact of the pandemic on dental services for children was similar to the impact on adults, with sharp falls in most categories of treatments in 2020-21.
In 2021-22, over 255,000 examinations were recorded, a significant increase of 167.6% compared with 2020-21. Although the number of examinations remain under half the level seen before the pandemic. All other categories of the most common treatments increased markedly, with fluoride varnishes increasing 273.2%, radiographs increasing 164.4%, permanent fillings and sealant restorations increasing 98.0% and other treatments increasing 87.7%. Radiographs and other treatments have returned to pre-pandemic levels, but fluoride varnishes and permanent fillings and sealant restorations remain below pre-their pandemic level.
Orthodontic activity
Orthodontics is a specialist area of dentistry concerned with the growth and development of the teeth and jaws and the prevention and treatment of abnormalities of this development, therefore most patients are children. Further details on orthodontics are available in the quality report.

Number of treatments undertaken (Assessed and Accepted FP17OWs) (StatsWales)
There had been a slight upward trend in the number of orthodontic treatments undertaken in the ten years prior to the pandemic. The number of treatments decreased to just fewer than 1,500 as a result of the pandemic in 2019-20. However, in 2021-22 orthodontic activity increased sharply, rising to just over 9,400 treatments, returning to its pre-pandemic level.
Workforce
Dental workforce data presented here shows the total number of dentists with any NHS activity recorded between 1 April and 31 March. Note that this is a headcount; full time equivalent data is not available.
Note that due to changes in the collection system at NHS Business Services Authority, a new methodology was implemented for determining the working arrangements (i.e. dentist type) of dentists for 2018-19 onwards. The overall headcount of dentists has not been affected but any comparison with dentist type in data published previously for 2017-18 and earlier (available on StatsWales) should be made with caution. It is hoped that a new data collection system for NHS dental workforce will be established in time for next year’s statistical release.
See the quality report and the quality and methodology section for more information.
Statistics on the population per dentist who received NHS dental services in 2021-22 are based on mid-2020 population estimates from the Office for National Statistics (ONS) as the mid-2021 population estimates are not scheduled to be published until November 2022. As such they should be treated with caution and considered provisional. See the quality and methodology section for more information.

a) Performers with NHS activity recorded via FP17W forms.
Dentists with NHS activity (StatsWales)
The number of dentists with NHS activity increased slightly every year since comparable data was collected in 2006-07 until 2018-19. There were small decreases in 2019-20 and 2020-21 but the number increased in 2021-22.
In 2021-22, there were 1,420 dentists with NHS activity recorded in Wales. This is an increase of 2.2% from 2020-21 (or 31 more dentists).
The population per dentist is closely correlated with the number of dentists. Using the ONS’ mid-year population estimates for 2020, there were an estimated 2,232 people per dentist with NHS activity in Wales. This is 2.2% lower (or 50 fewer people per dentist) than in 2020-21.

Dentists with NHS activity (StatsWales)
Historically there have been more male dentists with NHS activity than female dentists, but the difference narrowed from being nearly two thirds male in 2011-12 to close to an even split in 2020-21.
In 2021-22, the number of female dentists exceeded the number of male dentists for the first time since data was first collected in 2006-07. 50.4% of dentists with NHS activity were female and 49.6% of dentists were male.
When compared with 2020-21, there was a 1.3 percentage point increase in the proportion of female dentists with NHS activity, and when compared with 2011-12 there was a 8.4 percentage point increase in the proportion of female dentists with NHS activity.
Joiners and leavers
A joiner is defined as a dentist who recorded NHS activity in the latest year but not in the previous year. A leaver is defined as having NHS activity recorded in the previous year but not in the latest year. Therefore, data for leavers has a one-year lag. See the quality report for more information about joiners and leavers.
NHS dental leavers and joiners (StatsWales)
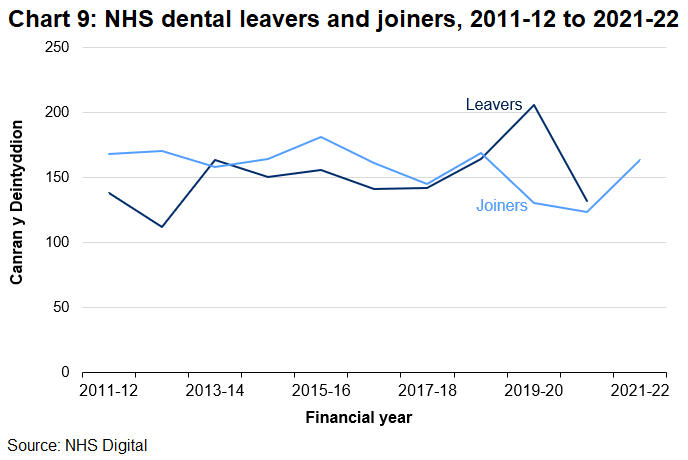
Over the course of the time series there were more joiners than leavers in most years; however in the latest two years where there are data for both measures, there were more leavers than joiners.
In 2020-21, 132 dentists (9.5% of all dentists in 2020-21) stopped performing NHS work, compared to 123 dentists (8.9% of all dentists in 2020-21) newly performing NHS work in 2020-21.
The latest data for 2021-22 shows that there were 163 joiners, 40 more than in 2020-21.
Welsh language
All dentists undertaking NHS dentistry in Wales are required to be registered on the Dental Performers’ List which is maintained by NHS Shared Services Partnership. When registering, a dentist self-reports if they are able to speak Welsh. This information is currently collected by a simple ‘Yes/No’ question, rather than grading their level of fluency and is not typically updated throughout the dentist’s tenure on the list.
This data may not necessarily represent the number of dentists who currently consult in Welsh or who are able to consult in Welsh.
Statistics for the number of Welsh speaking dentists per 10,000 Welsh speaking people (from the 2011 Census) and the number of Welsh speaking dentists per 10,000 general population based on the 2021 ONS mid-year estimates are available on StatsWales.

Chart 10 shows the percentage of Welsh speaking dentists compared to the total number of dentists in Wales from 2018-19 to 2021-22.
As of 25 August 2022, there were 131 Welsh speaking dentists in Wales, according to the Dental Performers List, 17 fewer than in 2020-21.
The percentage of dentists who had any Welsh speaking skills in 2021-22 (9.2%) is lower than the Welsh population. The 2011 Census (StatsWales) estimates 27% of people in Wales had some Welsh speaking skills, and the Annual Population Survey (StatsWales) as at December 2021 estimates 30% of people in Wales had some Welsh speaking skills.
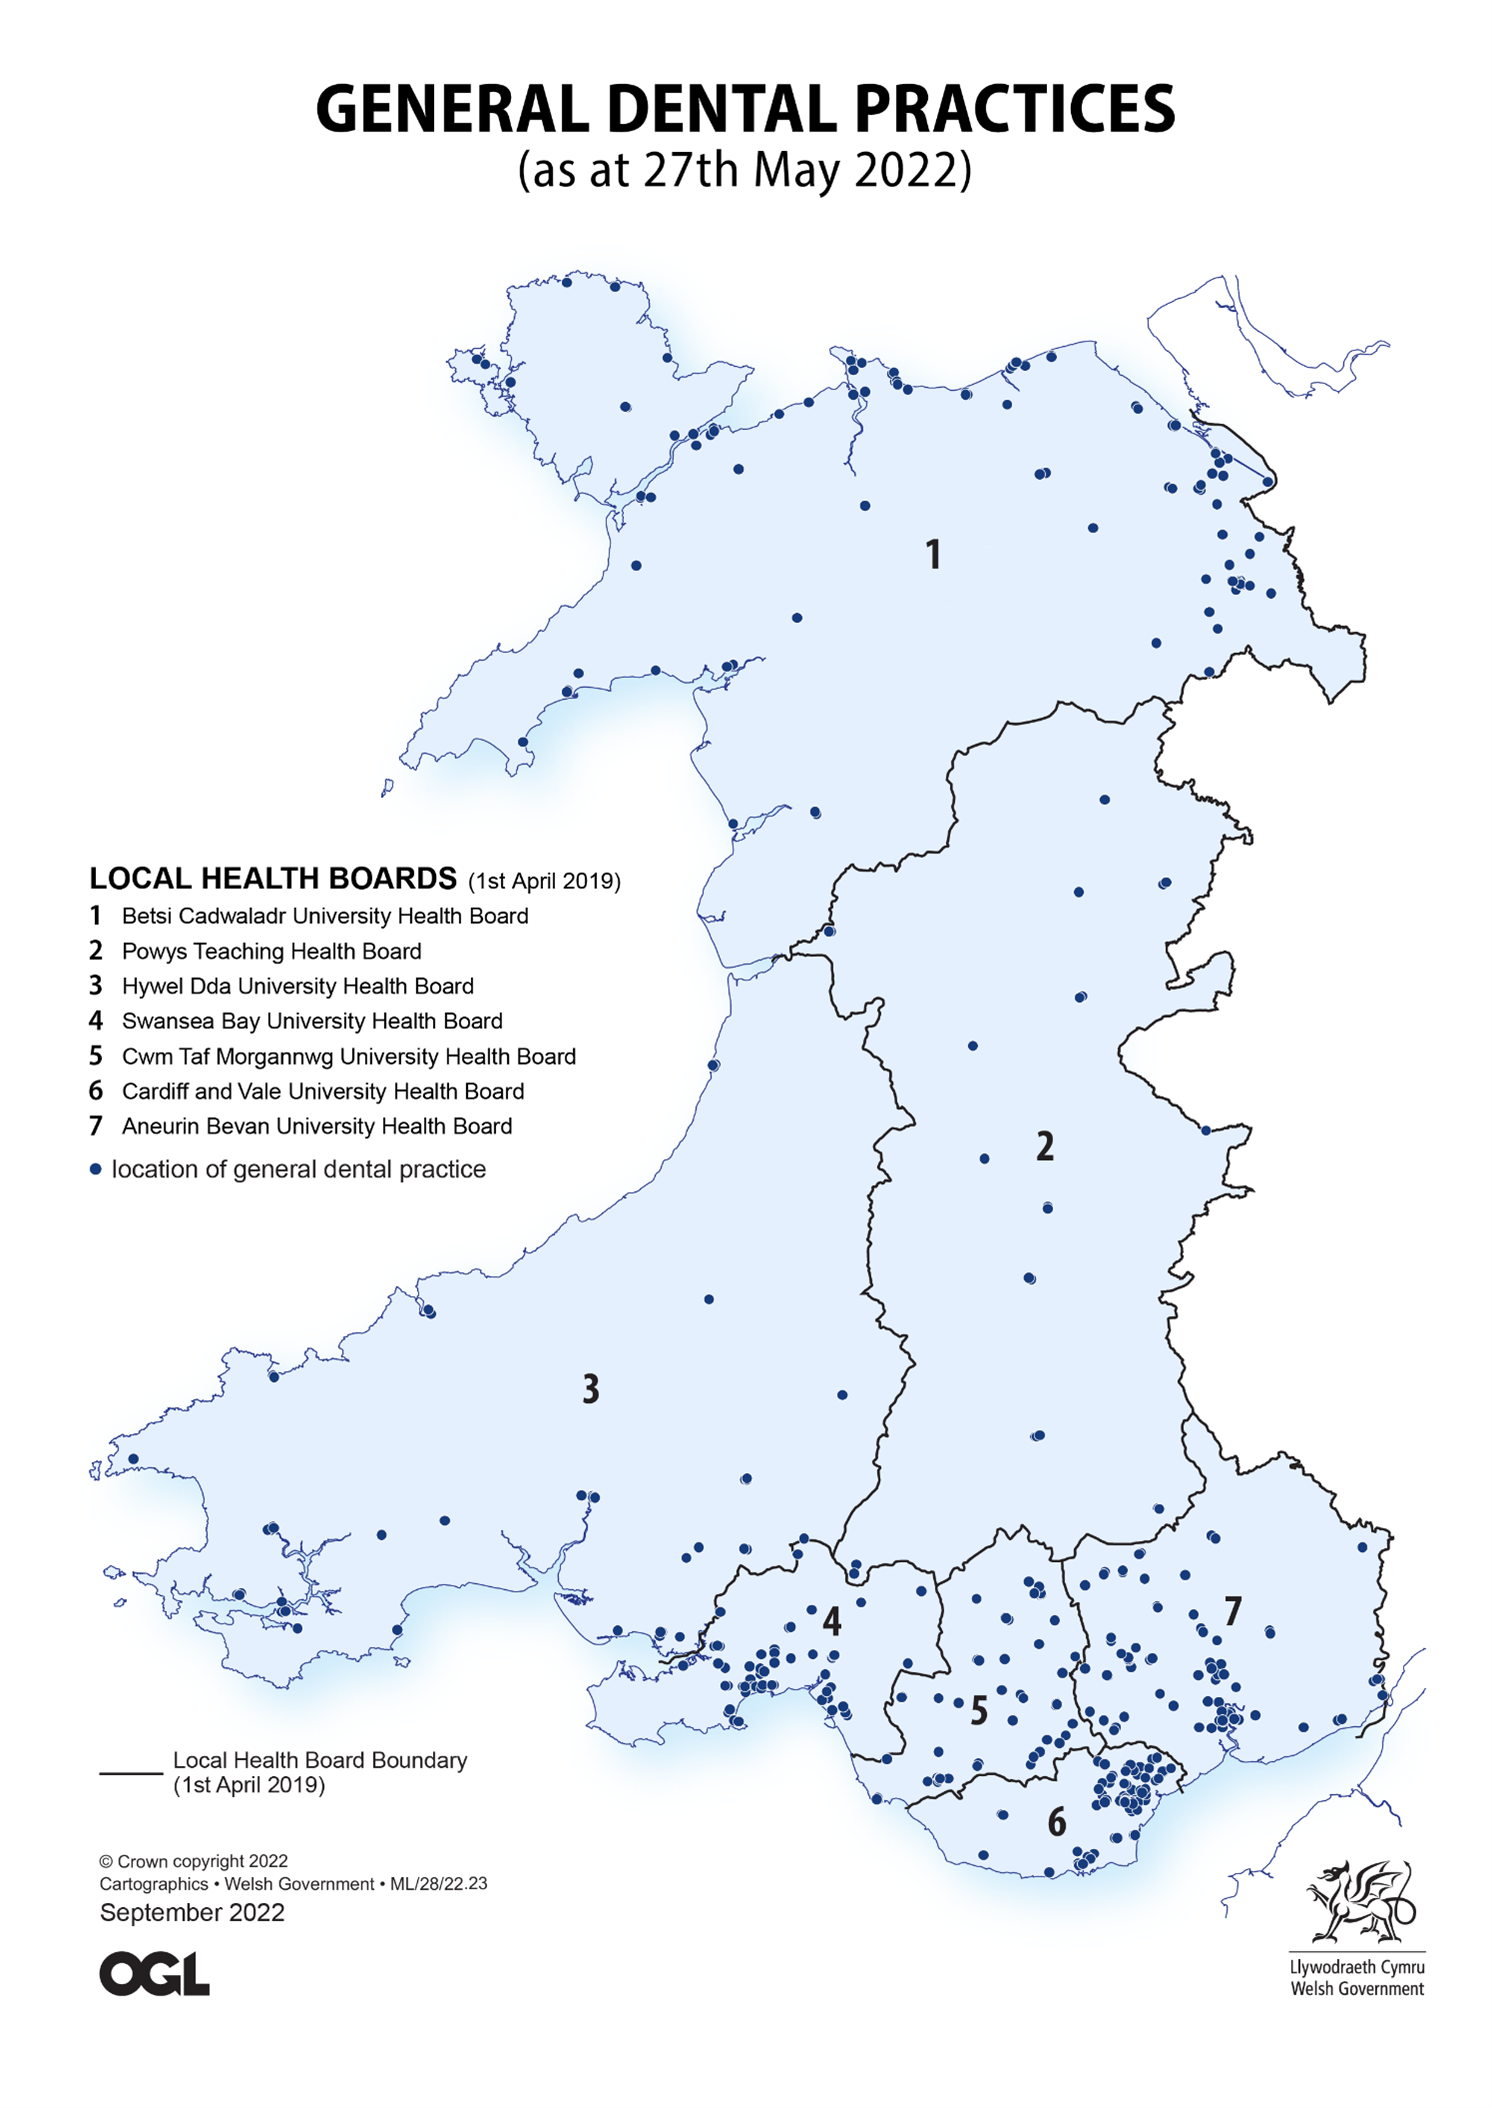
Dental practices
Quality and methodology information
Detailed information about the statistics in this release are published in the quality report.
Impact of COVID-19
COVID-19 had a significant impact on the way dental services have been provided in Wales and therefore affect the data collected. Data collected from the last quarter of the financial year 2019-20 to the full financial years 2020-21 and 2021-22 is affected.
While practices in Wales did not close at any stage during the pandemic, they entered the Red Dental Alert Level from 23 March 2020 and were limited in the types of treatments they could carry out during the period from April 2020 to the end of June 2020. Since then there has been a gradual relaxation of infection, prevention and control (IPC) measures which has enabled dental activity to increase. However, some measures remained well into 2021-22 and the emergence of the Omicron variant in late 2021 slowed the recovery further.
NHS dentistry in 2021-22 was viewed as a reset and recovery year where dental teams were asked to focus on prioritising urgent care, dealing with the needs of vulnerable groups, addressing the backlog of treatment resulting from scaling back dentistry, and reintroducing routine assessment and care as capacity opens up. This is demonstrated in this statistical release with a larger than usual proportion of Band 2 claims and lower than usual proportion of Band 1 claims.
Additionally, Urgent Dental Centres (UDC) were established during the red dental alert phase and activity data was not recorded in the usual way. Any treatment which required an aerosol generating procedure was referred to a UDC. Some of these UDCs are still operational and as a result, some data reported in this statistical release will be an undercount of the true activity which occurred.
Courses of treatment (CoTs)
Data on CoTs completed by an NHS dentist are submitted to the NHS Dental Services for payment on an electronic FP17W form, through the Compass system.
A CoT is defined as:
- an examination of a patient, an assessment of their oral health, and the planning of any treatment to be provided to that patient as a result of that examination and assessment
- the provision of any planned treatment (including any treatment planned at a time other than the time of the initial examination) to that patient
Treatments are split into treatment bands, according to level of complexity as follow, which are used to determine the charge paid by patients.
Band 1
Covers a check-up and simple treatment (such as examination, diagnosis (e.g. x-rays), advice on preventative measures, and a scale and polish)
Band 2
Includes mid-range treatments (such as fillings, extractions, and root canal work) in addition to Band 1 work
Band 3
Includes complex treatments (such as crowns, dentures, and bridges) in addition to Band 1 and Band 2 work
Urgent
A specified set of possible treatments provided to a patient in circumstances where: prompt care and treatment is provided because, in the opinion of the dental practitioner, that person's oral health is likely to deteriorate significantly, or the person is in severe pain by reason of their oral condition; and care and treatment is provided only to the extent that is necessary to prevent that significant deterioration or address that severe pain.
Free
These do not attract a patient charge and include: arrest of bleeding, bridge repairs, denture repair, removal of sutures, and prescription issues.
Full details of the treatments within each of the chargeable bandings can be found via the NHS website.
Clinical dental activity
Sixteen possible clinical treatments are recorded. Note that a patient can receive more than one clinical treatment within a single course of treatment.
Scale and polish
This refers to simple periodontal treatment including scaling, polishing, marginal correction of fillings and charting of periodontal pockets.
Fluoride varnish
A fluoride preparation which is applied to the surfaces of teeth as a primary preventive measure.
Fissure sealants
Where a sealant material is applied to the pit and fissure systems as a primary preventive measure.
Radiograph(s) taken
Often known as an x-ray, dental radiographs provide an image of the teeth, mouth and/or gums that can help the dentist to identify underlying problems, such as decay and gum disease.
Endodontic treatment
Where a tooth is severely decayed or damaged (for example by trauma) a root-filling may be required to restore the tooth. This procedure involves removal of the diseased or damaged pulp of the tooth. The root canal is then cleaned, shaped and filled with a suitable material.
Permanent fillings and sealant restorations
The restoration of a tooth by filling a cavity to replace lost tooth tissue. Various substances may be used, including composite resin, amalgam or glass ionomer.
Extractions
Where a tooth is extracted, this also includes surgical removal of a buried root, unerupted tooth, impacted tooth or exostosed tooth.
Crown(s) provided
Full coverage of a tooth, provided when the remaining tooth tissue is not sufficient to restore the tooth by other means. (Stainless steel crowns have been excluded from this analysis).
Dentures
A denture is a removable appliance that replaces some or all teeth. A CoT can include the following:
- upper denture (acrylic)
- lower denture (acrylic)
- upper denture (metal)
- lower denture (metal)
Veneer(s) applied
A layer of material (often porcelain) covering the surface of a damaged or discoloured tooth.
Inlay(s)
A type of indirect restoration (i.e. created in the laboratory).
Bridge units provided
a fixed restoration that replaces one or more missing teeth. Note that for most treatments the minimum number of possible items is one, however, for bridge units the minimum is two.
Referral for advanced mandatory services
Where a patient is referred to another contractor for advanced mandatory services.
Examination
When an examination for treatment is carried out. This would normally include charting of the teeth, recording of the periodontal condition and soft tissue examination all of which would be detailed with other necessary clinical details on the clinical record.
Antibiotic items prescribed
When the patient is issued with a prescription containing antibiotic items. The number of antibiotic items should be entered (i.e. the number of antibiotic treatments rather than the number of pills).
Other treatment
When any treatment has been provided for which there is no appropriate clinical dataset item in part 5a. This item can be entered in addition to other clinical data.
Revision of clinical treatment data
The number of examinations for adults and children in 2020-21 published in the previous release were incorrect and have been revised in this release. The figure has been revised from 27,039 to 386,592 examinations. The revision is a result of an error in the source data provided by NHS Business Services Authority. Prior to the revision, the figures were only showing examinations which occurred in the 12 months before March 2020, rather than the 24 months before March 2021. As dental services were markedly affected by the COVID-19 pandemic, the number of all clinical treatments fell sharply during 2020-21 and validation checks performed by Welsh Government did not highlight the error in the examinations data published in last year’s release. No other data items were affected by this error, therefore no other revisions have been made.
NHS workforce
Note that due to changes in the collection system at NHS Business Services Authority, a new methodology has been implemented for determining the working arrangements (i.e. dentist type) of dentists for 2018-19 onwards. The change in methodology has resulted in large numbers of dentists being reclassified as providing-performer and a consequential decrease in associate dentist numbers for 2018-19 and 2019-20 data, marking a major break in the time-series. The overall headcount of dentists has not been affected but any comparison with dentist type in data published previously for 2017-18 and earlier should be made with caution. Regardless of this change, this publication does not include data for Provider-only dentists as they do not have NHS activity recorded against them.
A new data collection process is currently being developed which may be completed in time for next years’ publication. It is based on the Wales National Workforce Reporting System which has been used to collect general practice workforce data since 2020. When data is sourced from this tool, there will be a break in the time series.
Mid-year population estimates
Some statistics presented in this release are calculated using mid-2020 population estimates from the Office for National Statistics (ONS) as the mid-2021 population estimates are not scheduled to be published until November 2022. As the statistics are based on population estimates from a different time period, they should be treated with caution and considered provisional.
As data from the 2021 Census becomes available, the ONS will also rebase the mid-year estimates for the period mid-2012 to mid-2020 in spring 2023. This means that statistics for the percentage of the population who received NHS dental services in these years will be revised in the next NHS dental statistical release. If the revisions result in large changes to the data, these will be commented on in more detail in the release.
National Statistics status
The United Kingdom Statistics Authority has designated these statistics as National Statistics, in accordance with the Statistics and Registration Service Act 2007 and signifying compliance with the Code of Practice for Statistics.
National Statistics status means that official statistics meet the highest standards of trustworthiness, quality and public value.
All official statistics should comply with all aspects of the Code of Practice for Statistics. They are awarded National Statistics status following an assessment by the UK Statistics Authority’s regulatory arm. The Authority considers whether the statistics meet the highest standards of Code compliance, including the value they add to public decisions and debate.
The continued designation of these statistics as National Statistics was confirmed in June 2012 following a compliance check by the Office for Statistics. These statistics last underwent a full Regulation Statistics on Health and Personal Social Services in Wales against the Code of Practice in 2012.
Since the latest review by the Office for Statistics Regulation, we have continued to comply with the Code of Practice for Statistics, and have made the following improvements:
- Included additional open data, with more detailed breakdowns, on our StatsWales website.
- Updated key quality information and refreshed commentary throughout the release, including longer time comparisons of data.
Well-being of Future Generations Act (WFG)
The Well-being of Future Generations Act 2015 is about improving the social, economic, environmental and cultural wellbeing of Wales. The Act puts in place seven wellbeing goals for Wales. These are for a more equal, prosperous, resilient, healthier and globally responsible Wales, with cohesive communities and a vibrant culture and thriving Welsh language. Under section (10)(1) of the Act, the Welsh Ministers must (a) publish indicators (“national indicators”) that must be applied for the purpose of measuring progress towards the achievement of the wellbeing goals, and (b) lay a copy of the national indicators before Senedd Cymru. Under section 10(8) of the Well-being of Future Generations Act, where the Welsh Ministers revise the national indicators, they must as soon as reasonably practicable (a) publish the indicators as revised and (b) lay a copy of them before the Senedd. These national indicators were laid before the Senedd in 2021. The indicators laid on 14 December 2021 replace the set laid on 16 March 2016.
Information on the indicators, along with narratives for each of the wellbeing goals and associated technical information is available in the Wellbeing of Wales report.
Further information on the Well-being of Future Generations (Wales) Act 2015.
The statistics included in this release could also provide supporting narrative to the national indicators and be used by public services boards in relation to their local wellbeing assessments and local wellbeing plans.
We want your feedback
We welcome any feedback on any aspect of these statistics which can be provided by email to: stats.healthinfo@gov.wales