Response to the cost of living crisis: distributional analysis
Analysis of the impact on household incomes of our policies to address the cost of living crisis.
In this page
Distributional analysis
The following analysis shows the distributional effects of three schemes the Welsh Government has provided in response to the cost of living crisis. These are:
- Cost of Living Support payment. This provides £150 to all households in council tax bands A to D and those who receive support via the Council Tax Reduction Scheme.
- Winter Fuel Support scheme (WFS). Eligible households can claim a one-off £200 payment.
- Discretionary Assistance Funds (DAF). Grants which can be provided to those in financial hardship or to assist with someone to live independently in a property which they are moving into.
Overall, the additional WFS payment and increasing the DAF funding makes the package significantly more progressive than just the Cost of Living Support scheme. Progressivity will increase further if take-up of the WFS increases from the current expected rate.
The average impact of the schemes shown by income group will differ from the full amounts to which some households will be entitled. This is because not all households within each income group will be eligible for all schemes and some of those which are may not take-up the funding. This reduces the average payment across income groups.
To model the support package, a number of assumptions have been applied. These are:
- All households who are eligible for the Cost of Living Support receive the £150.
- A take-up rate for the WFS of 75%, reflecting the current expected rate.
- DAF is approximated by applying the current year’s expected expenditure across the same households who are eligible for the WFS. As the DAF has a discretionary element, there is considerable uncertainty around how the DAF is distributed by income.
Figure 1 shows the percentage of households who are benefiting from the total support package by quintile. This is mainly driven by the Cost of Living Support scheme. In total around 75% of households are expected to be supported by one or more of these schemes.
Figure 1: percentage of households who are expected to be supported, by household income 2022 to 2023
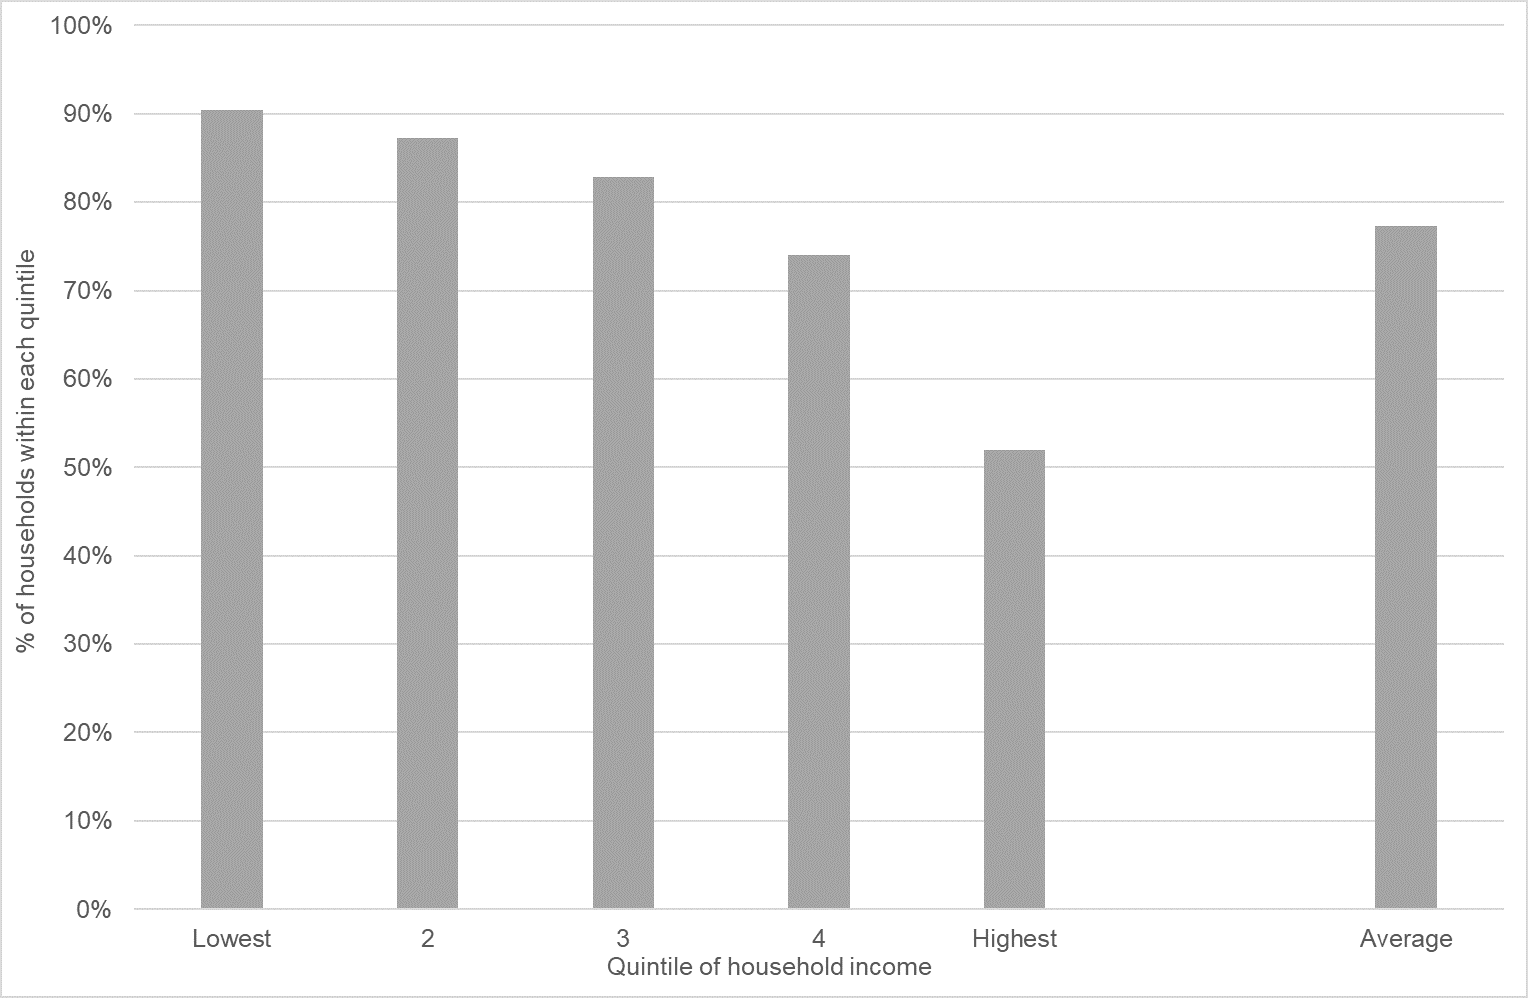
Source: Welsh Government analysis using the Family Resource Survey and UKMOD [footnote 1]
Figures 2 and 3 show the average cash value of the support package across each of the schemes by household income. The Cost of Living Support scheme forms the largest financial element of the package for households, but the other two schemes provide substantial additional funding to those on lower incomes. Figure 2 shows that nearly three times as much funding will go to households in the bottom fifth of the income distribution compared to those in the top fifth. Figure three shows nearly twice as much funding will go to households in the bottom half of the income distribution compared to those in the top half.
The final chart is similar to the second one, but shows the value of the support package as a percentage of household disposable income. It shows that on average the schemes will provide a boost of nearly two per cent to disposable income for those in the bottom fifth of the income distribution compared to a 0.1 per cent increase for those in the top fifth.
Figure 2: average value received by households (£), by quintile of household income 2022 to 2023
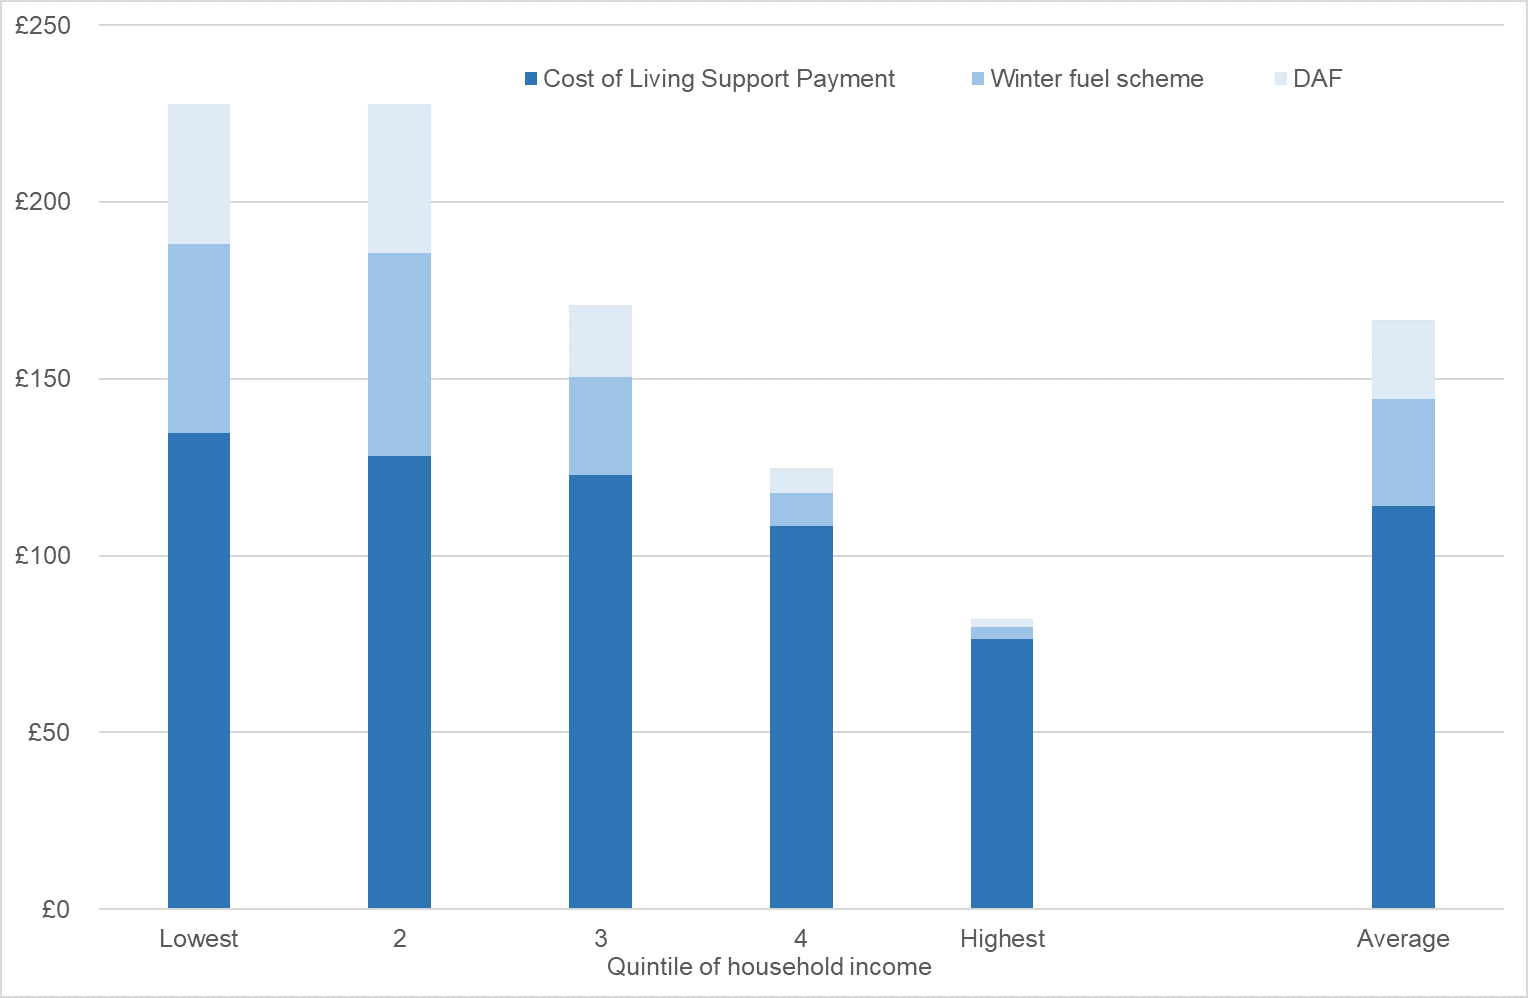
Source: Welsh Government analysis using the Family Resource Survey and UKMOD [footnote 1]
Figure 3: average value received by households (£), by median of household income 2022 to 2023
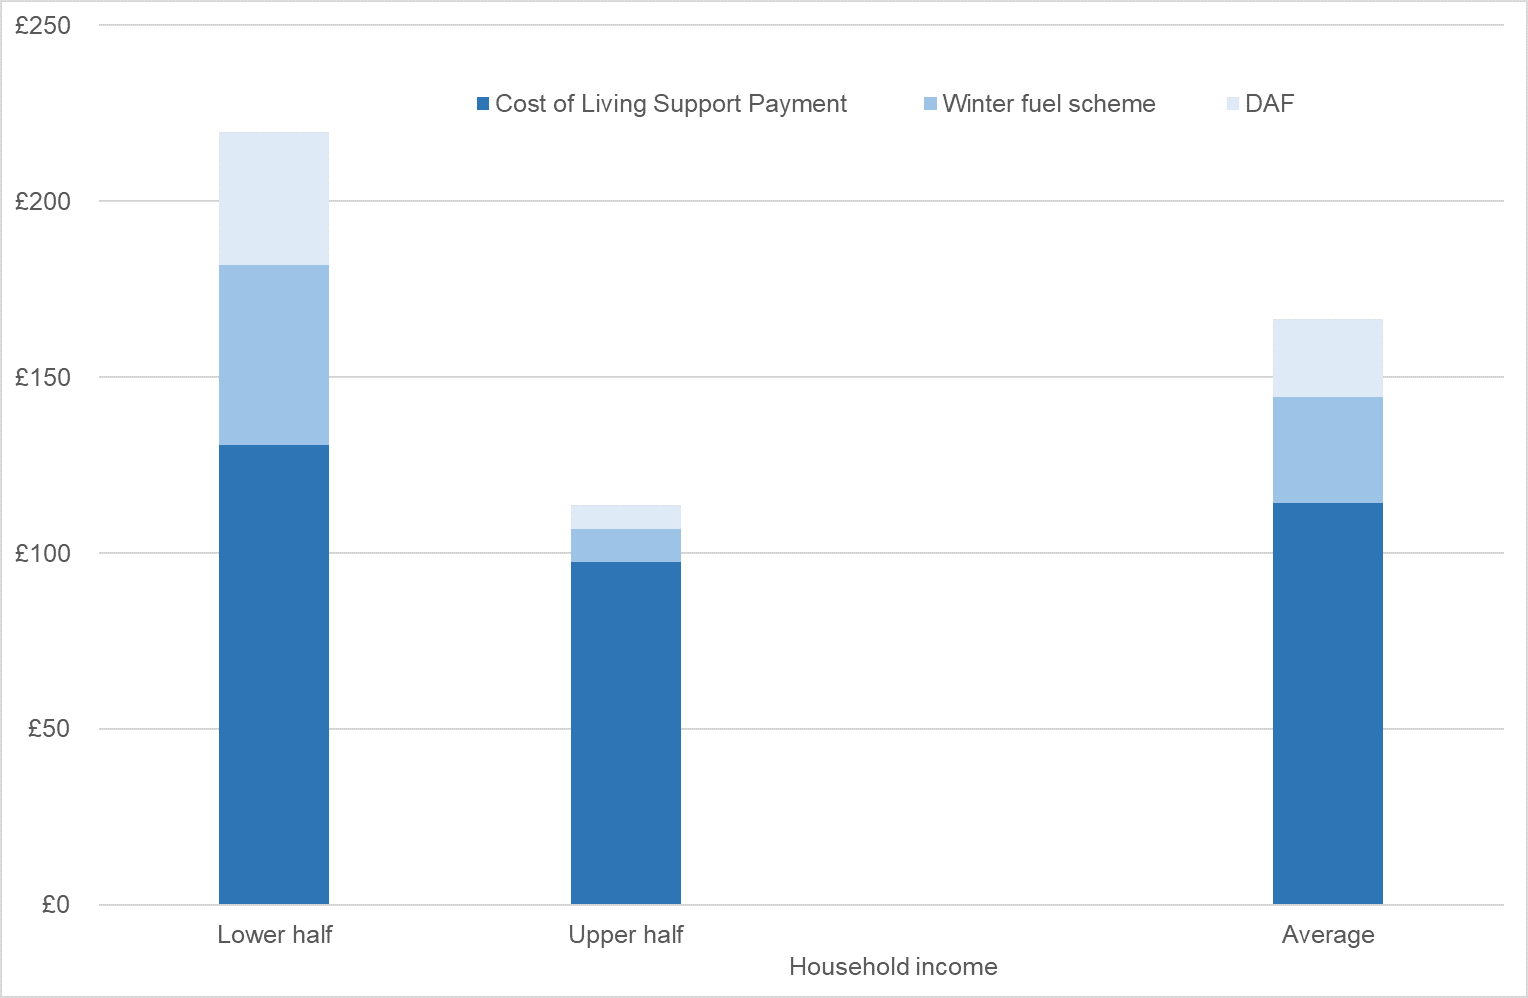
Source: Welsh Government analysis using the Family Resource Survey and UKMOD [footnote 1]
Figure 4: average value received by households (as a percentage of annual disposable income), by household income 2022 to 2023
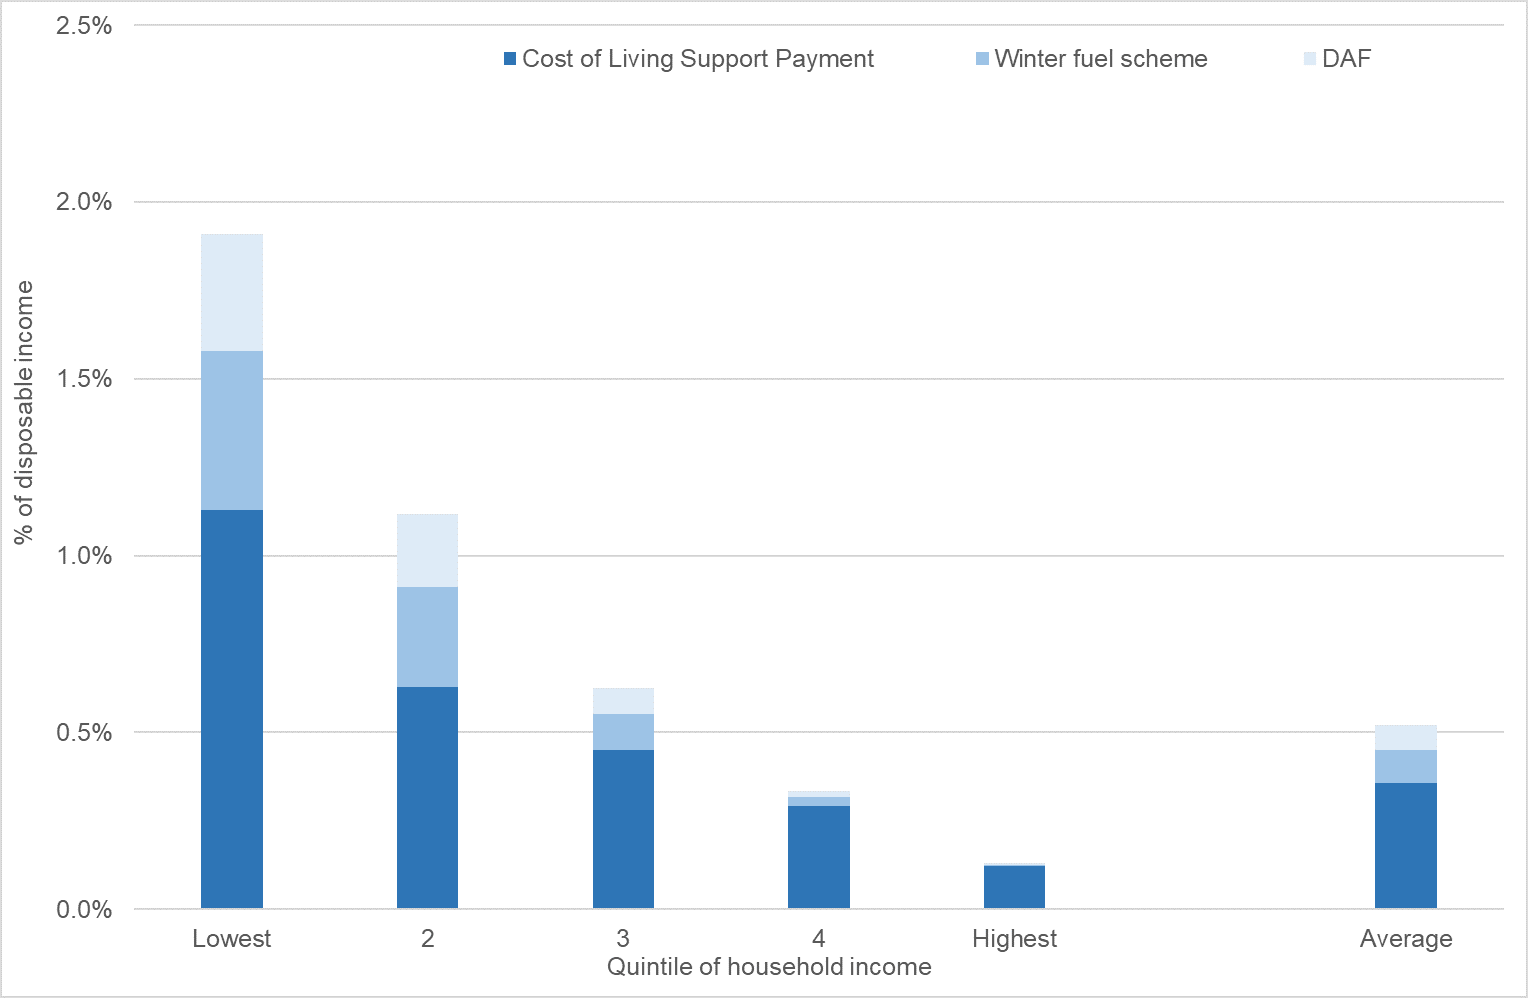
Source: Welsh Government analysis using the Family Resource Survey and UKMOD [footnote 1]
The results presented here are based on UKMOD version A2.51+. UKMOD is maintained, developed and managed by the Centre for Microsimulation and Policy Analysis (CeMPA) at the University of Essex. The process of extending and updating UKMOD is financially supported by the Nuffield Foundation (2018 to 2021). The results and their interpretation are the authors’ sole responsibility.
Footnotes
[1] Richiardi M, Collado D, Popova D (2021). UKMOD: A new tax-benefit model for the four nations of the UK. International Journal of Microsimulation, 14(1): 92-101. DOI: 10.34196/IJM.00231.