Warm Homes Nest scheme: annual report 2024 to 2025
How the Warm Homes Nest scheme has made households in Wales warmer and more energy efficient between 2024 to 2025.
In this page
Ministerial Foreword
This is the first annual report for our new Warm Homes Nest scheme, launched following the commitments set out in the 2023 Warm Homes Policy Statement. It reflects a year of transition and significant groundwork to deliver a demand-led scheme which tackles the dual challenges of fuel poverty and climate change.
The period 1 April to 30 September was primarily a period of mobilisation activity alongside completion of 473 work-in-progress installations which had commenced prior to the end of the previous iteration of the scheme. This transitional activity was essential to ensure continuity of support for households and a smooth handover to the new delivery model. These installations were recorded in the Warm Homes Nest scheme: annual report 2023 to 2024.
In the period 1 October 2024 to 31 March 2025 the scheme delivered home energy efficiency improvements, including central heating systems, boilers, insulation, solar panels, and air source heat pumps, to 348 households. These improvements have resulted in an estimated £595 average annual reduction in household energy bills and secured lifetime carbon savings exceeding 107,000 tonnes.
Given the focus of the scheme on deeper, more comprehensive home retrofits than previous iterations, we have also set out to ensure the scheme delivers quality installations and high levels of satisfaction. I am pleased to report that 98.4% of installations surveyed passed first time, and the percentage of customer complaints upheld during this period accounted for only 1.4% of all installations.
Since mobilisation, I also introduced a new crisis route to provide urgent support for households without heating or hot water who meet Nest eligibility criteria. This route allows one-off repairs to address the immediate crisis. This ensures emergency interventions for those who need urgent help are aligned with our long-term efficiency-first approach.
Alongside physical improvements, advice remains a cornerstone of our approach. Between 2024 to 2025, the Nest advice service supported 8,434 households with tailored energy-saving advice. This free and impartial service is available to all households in Wales. As we transition to low-carbon technologies, ensuring people have access to independent advice is critical in giving people the confidence they need to make informed decisions about upgrading their homes and embracing new technologies.
This progress would not have been possible without the dedication and collaboration of our delivery partners, local authorities, installers and community organisations. I also want to acknowledge the households who have reached out to the scheme and taken steps to improve their homes, reduce their bills and lower their carbon footprints.
As we look ahead, there is more to do to support the estimated 25% of households living in fuel poverty. We remain focused on scaling up delivery, driving quality and ensuring no one is left behind. Together, we will continue to reduce fuel poverty, improve living standards, and tackle the causes of climate change.
Main points
Headline achievements
- Between April 2024 and March 2025, Nest gave tailored energy-saving advice to 8,434 households.
- Between October 2024 and March 2025, Nest installed home energy efficiency improvements such as heating systems, boilers, insulation, solar panels and heat pumps in 348 homes, helping vulnerable households reduce energy costs.
- A dedicated crisis route ensured urgent support for 222 of these vulnerable households without heating or hot water, providing rapid interventions to make homes warm and safe.
- Retrofit upgrades and crisis referrals cut household energy bills by about £570 and £578 a year respectively and are projected to save over 92,000 and 21,000 tonnes of carbon over their lifetime, showing big financial and environmental benefits.
- Between October 2024 and March 2025, 348 home energy‑efficiency packages were installed. Complaints during this period accounted for only 1.4% of all customers who received an upgrade, indicating very high satisfaction.
- The scheme offered support for off-grid households, addressing the higher costs associated with traditional electric, oil, or solid fuel heating systems.
- The independent advice service guaranteed impartial guidance and consistently high standards of delivery and was available to all.
- Robust quality assurance and audit processes were embedded throughout the scheme, ensuring compliance with technical standards, safeguarding public funds, and driving continuous improvement in service delivery.
Profile of the 348 recipients receiving home energy improvement packages delivered between October 2024 and March 2025
- Just over a third of household recipients receiving improvements were older, with the head of household aged 65 or above in 34% of cases, including 19% aged 75 and over.
- Most installations were in owner‑occupied homes, accounting for 83% of cases, with 13% in private rented homes and 4% in homes where the tenure was recorded as unknown (either owner‑occupied or private rented).
- A small proportion of supported homes were off the gas grid, with 8% of households relying on traditional electric, oil, or solid fuel heating systems, which are typically more expensive to run.
- The most common property types were mid-terrace and semi-detached homes, together representing over 65% of all installations. This broadly reflects the stock profile for Wales.
Energy efficiency impact of the 348 home energy improvement packages delivered between October 2024 and March 2025
- Before improvements, energy efficiency was very low, with 62% of homes having an energy efficiency rating of F or G, indicating poor insulation and high heating costs.
- At the time the data was provided, 232 homes had a recorded energy efficiency rating following installation. Over 66% of these achieved an energy efficiency rating of C or higher, indicating a significant improvement in energy performance.
- No homes remained at the lowest rating of G after interventions, demonstrating the transformational impact of Nest upgrades on household energy efficiency.
Reaching vulnerable households
Customer analysis and data insights, developed since Nest began in 2011, were used to inform engagement and outreach, to ensure appropriate communication reached the customers most in need.
This included:
- promotion of the Nest website with 56,876 users between April 2024 to March 2025.
- a direct mail campaign which reached 154,764 vulnerable households in Wales.
- an online advice quiz that was completed by 1,042 households.
- paid Facebook and Google adverts targeted at eligible customers throughout Wales.
- supporting health boards, charities and community organisations across Wales to reach households which may benefit from our advice and support.
Advice and support
Every customer who called the Nest helpline received tailored advice and support from the advice team to ensure they received the most appropriate help to match their specific needs. This included energy saving and water efficiency advice, a package of free home energy efficiency improvements for eligible customers, and signposting and referrals to a range of support services.
Between April 2024 and March 2025, Nest supported 8,434 households with tailored advice and assistance. Rhondda Cynon Taf had the highest number of households helped, with 807, followed by Swansea with 650.
Figure 1: number of households who received Nest advice and support by local authority, April 2024 to March 2025
![Figure 1: number of households supported in each local authority, 2024 to 2025 [Note 1]](/sites/default/files/2026-03/Picture1_0.png)
Description of figure 1: Bar chart showing the number of households who received Nest advice and support within each local authority.
Source: Nest management reports
Third party support
Nest referred households to other organisations to provide further support where appropriate. A household can have multiple referrals; there were a total of 1,028 referrals.
Figure 2: type of third-party referrals made, April 2024 to March 2025
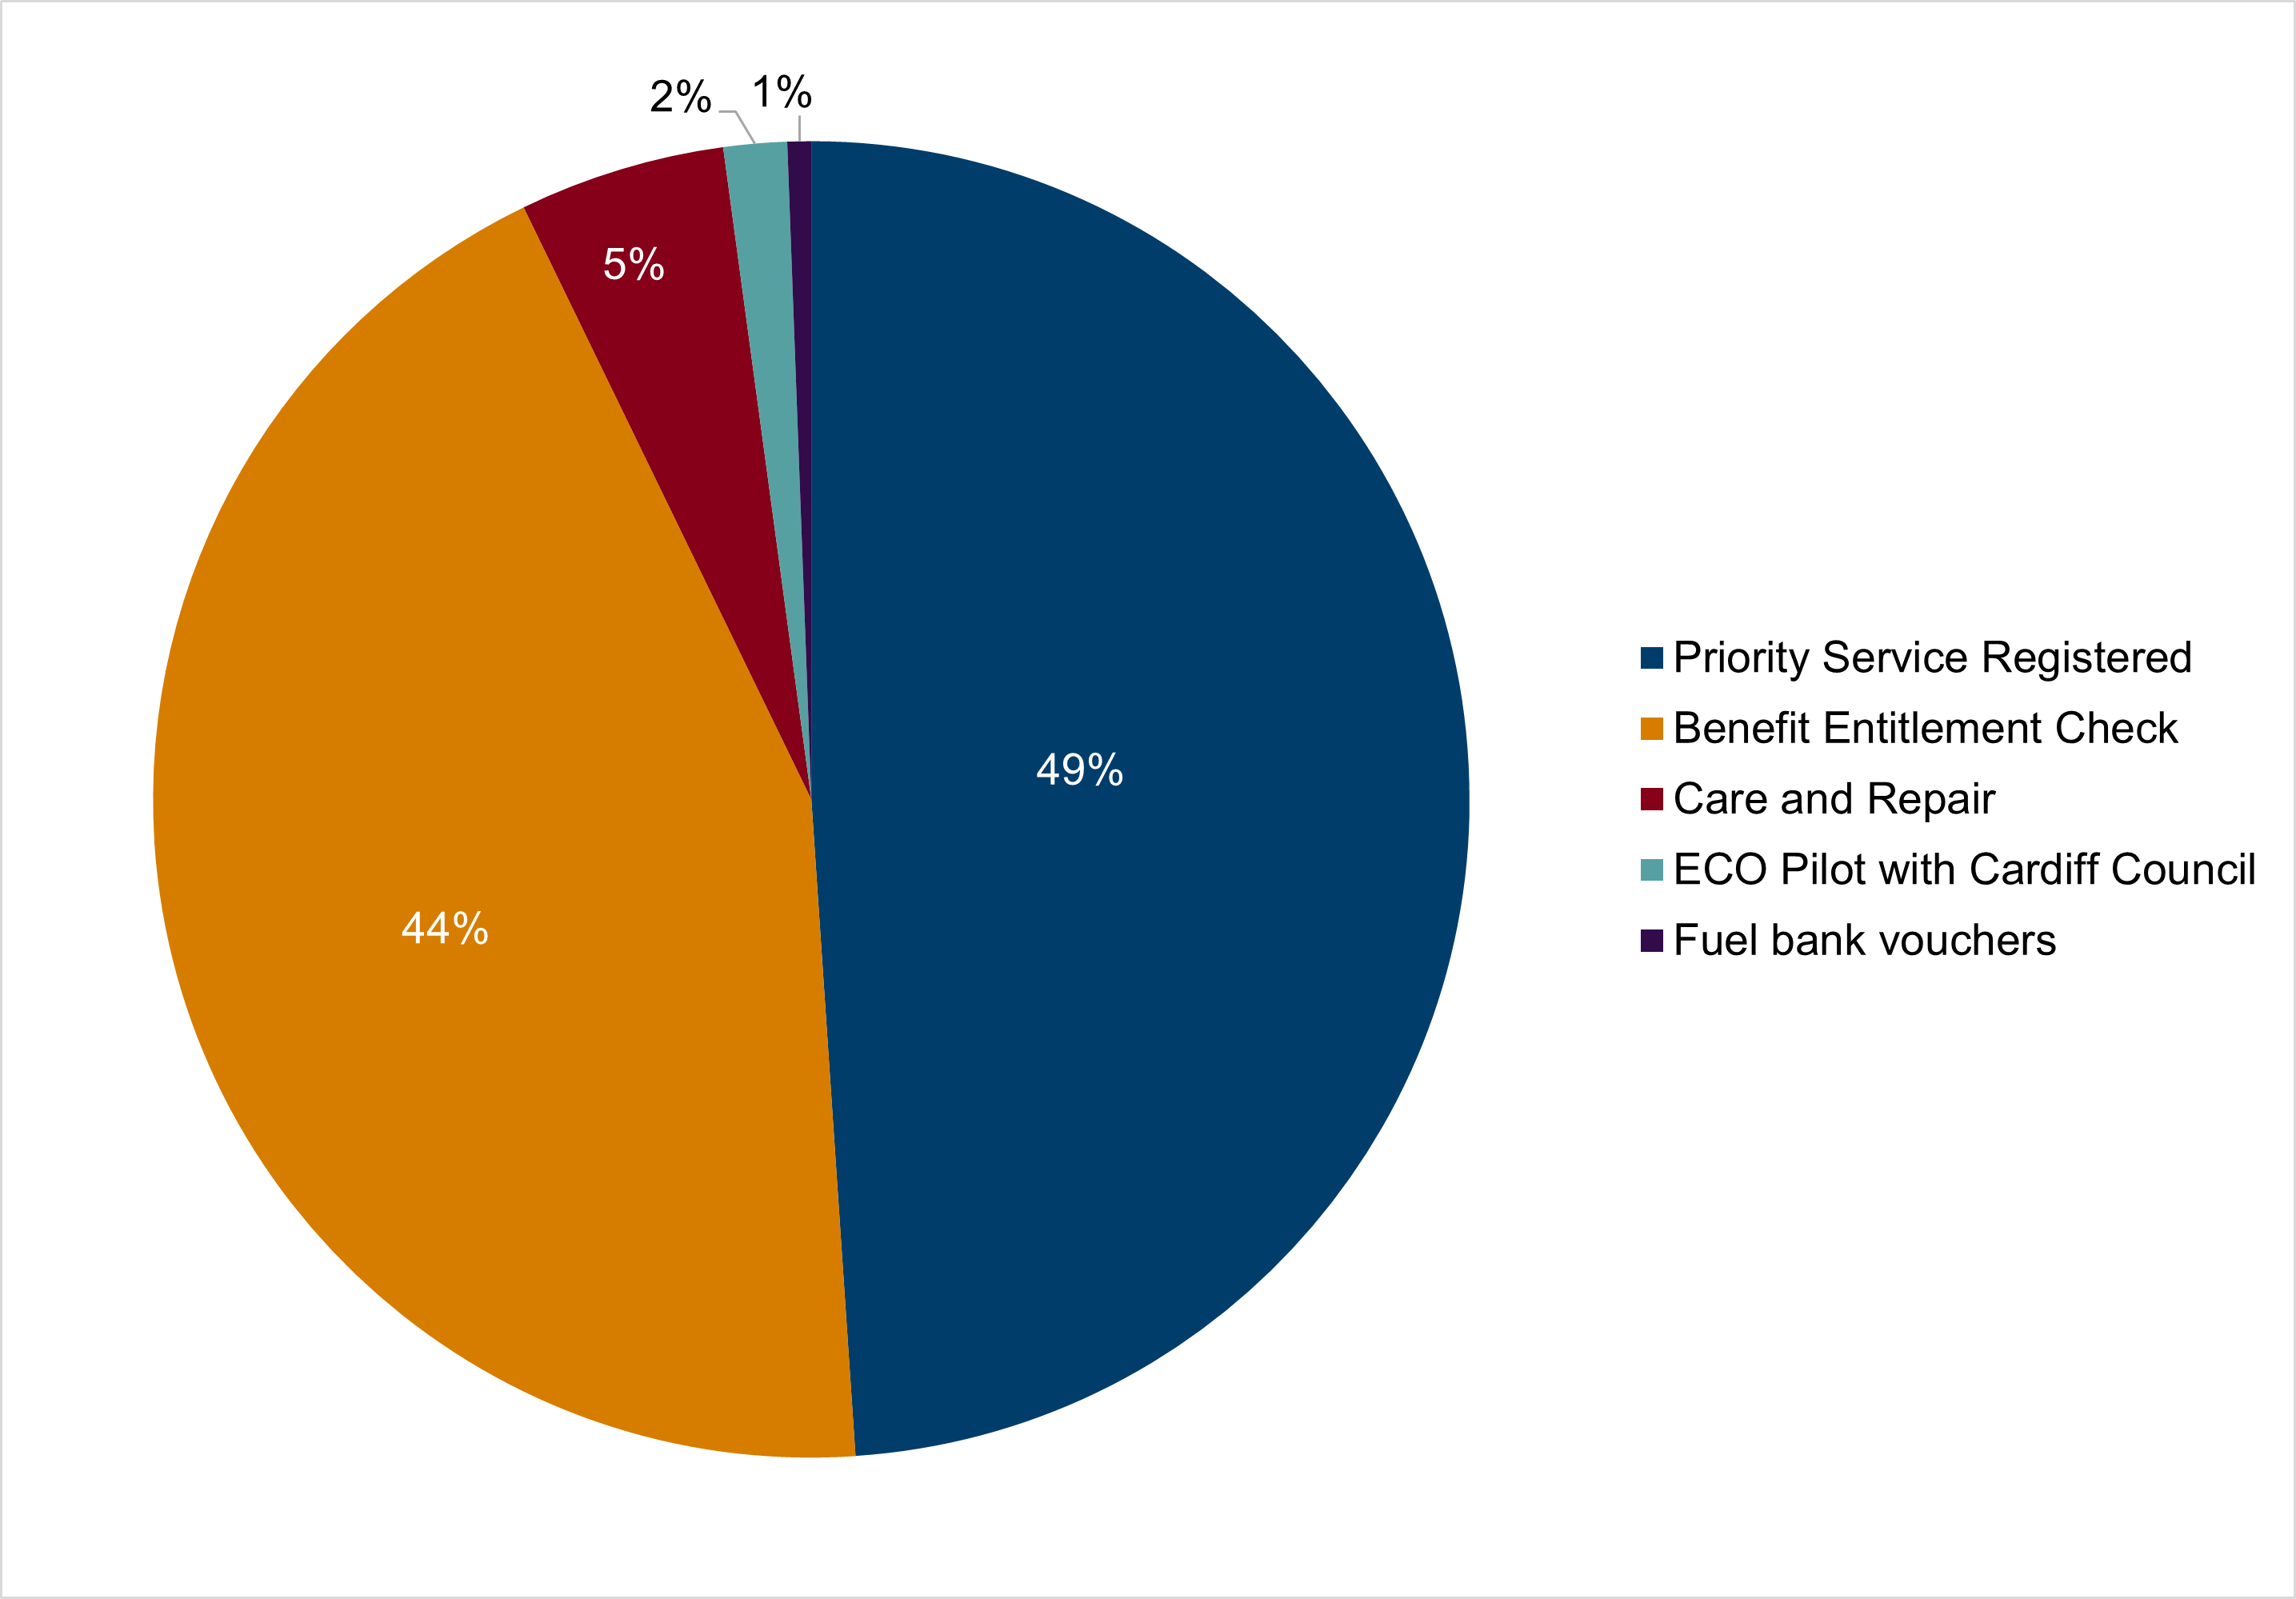
Description of figure 2: Pie chart showing the proportion of each type of third-party referral made, based on all 1,028 referrals.
Source: Nest management reports
Priority Service Registered (503 referrals, 49%)
Almost half of all referrals were to the National Grid Priority Services Register. This service helps vulnerable customers by offering extra support from energy suppliers and national grid, such as advance notice of power cuts and priority assistance during emergencies.
Benefit Entitlement Check (451 referrals, 44%)
Around 44% of referrals were for a benefit entitlement check. This ensures households are receiving all the financial support they are eligible for, helping to improve affordability and reduce fuel poverty.
Care and Repair (52 referrals, 5%)
Five percent of referrals were to Care and Repair, which provides practical help for older or disabled people to maintain and adapt their homes, supporting independent living.
Energy Company Obligations (ECO) Pilot with Cardiff Council (16 referrals, 2%)
Two percent of referrals were to the ECO pilot scheme with Cardiff Council. This initiative offers energy efficiency improvements to eligible households as part of a local partnership.
Fuel Bank Vouchers (6 referrals, 1%)
A small number of referrals (1%) were for Welsh Government fuel bank vouchers, which provide emergency credit for prepayment meters to help households in crisis.
Home energy improvement packages
Welsh Government’s Warm Homes Nest scheme helped households in fuel poverty by reducing energy bills through free energy efficiency improvements to their home.
Customers who contacted Nest for advice and support were assessed for their eligibility to receive a package of free home energy efficiency improvements.
The criteria for home improvements were:
- A household member was in receipt of a means-tested benefit and the property was privately owned or rented with an indicative energy rating of E, F or G; or
- A household member was living with a health condition (in a D, E, F, G rated privately owned or rented property) and was in receipt of an income below defined thresholds.
Health criteria data
The Nest scheme includes a separate route for people with specific health conditions who are on low incomes. To be eligible, a home must have an EPC rating of D or lower (SAP score 68 or lower), and someone in the household must have a qualifying health condition. Health conditions include a respiratory disease (respiratory infections, broncho-constriction in asthma, and chronic obstructive pulmonary disease), circulatory disease (including cardio-vascular disease, strokes and heart attacks) mental health (including depression, anxiety, psychosis and bipolar disorders) dementia intellectual and development disorders. More detail can be found in the Nest eligibility criteria.
Between April 2024 and March 2025, 2,341 households in Wales were assessed under the health route. Of these, 1,030 met both the health and home criteria and were referred for an income assessment. A total of 656 households then passed the income assessment and qualified for support.
Most households assessed included older adults, with 63% having at least one person aged 60 or over. Many properties were energy inefficient, with 42% rated E, F or G. Household incomes were generally low, with 61% earning less than 80% of the income threshold.
Figure 3: household referrals for an income assessment under the health criteria, by vulnerable household category, April 2024 to March 2025 [Note 1] [Note 2]
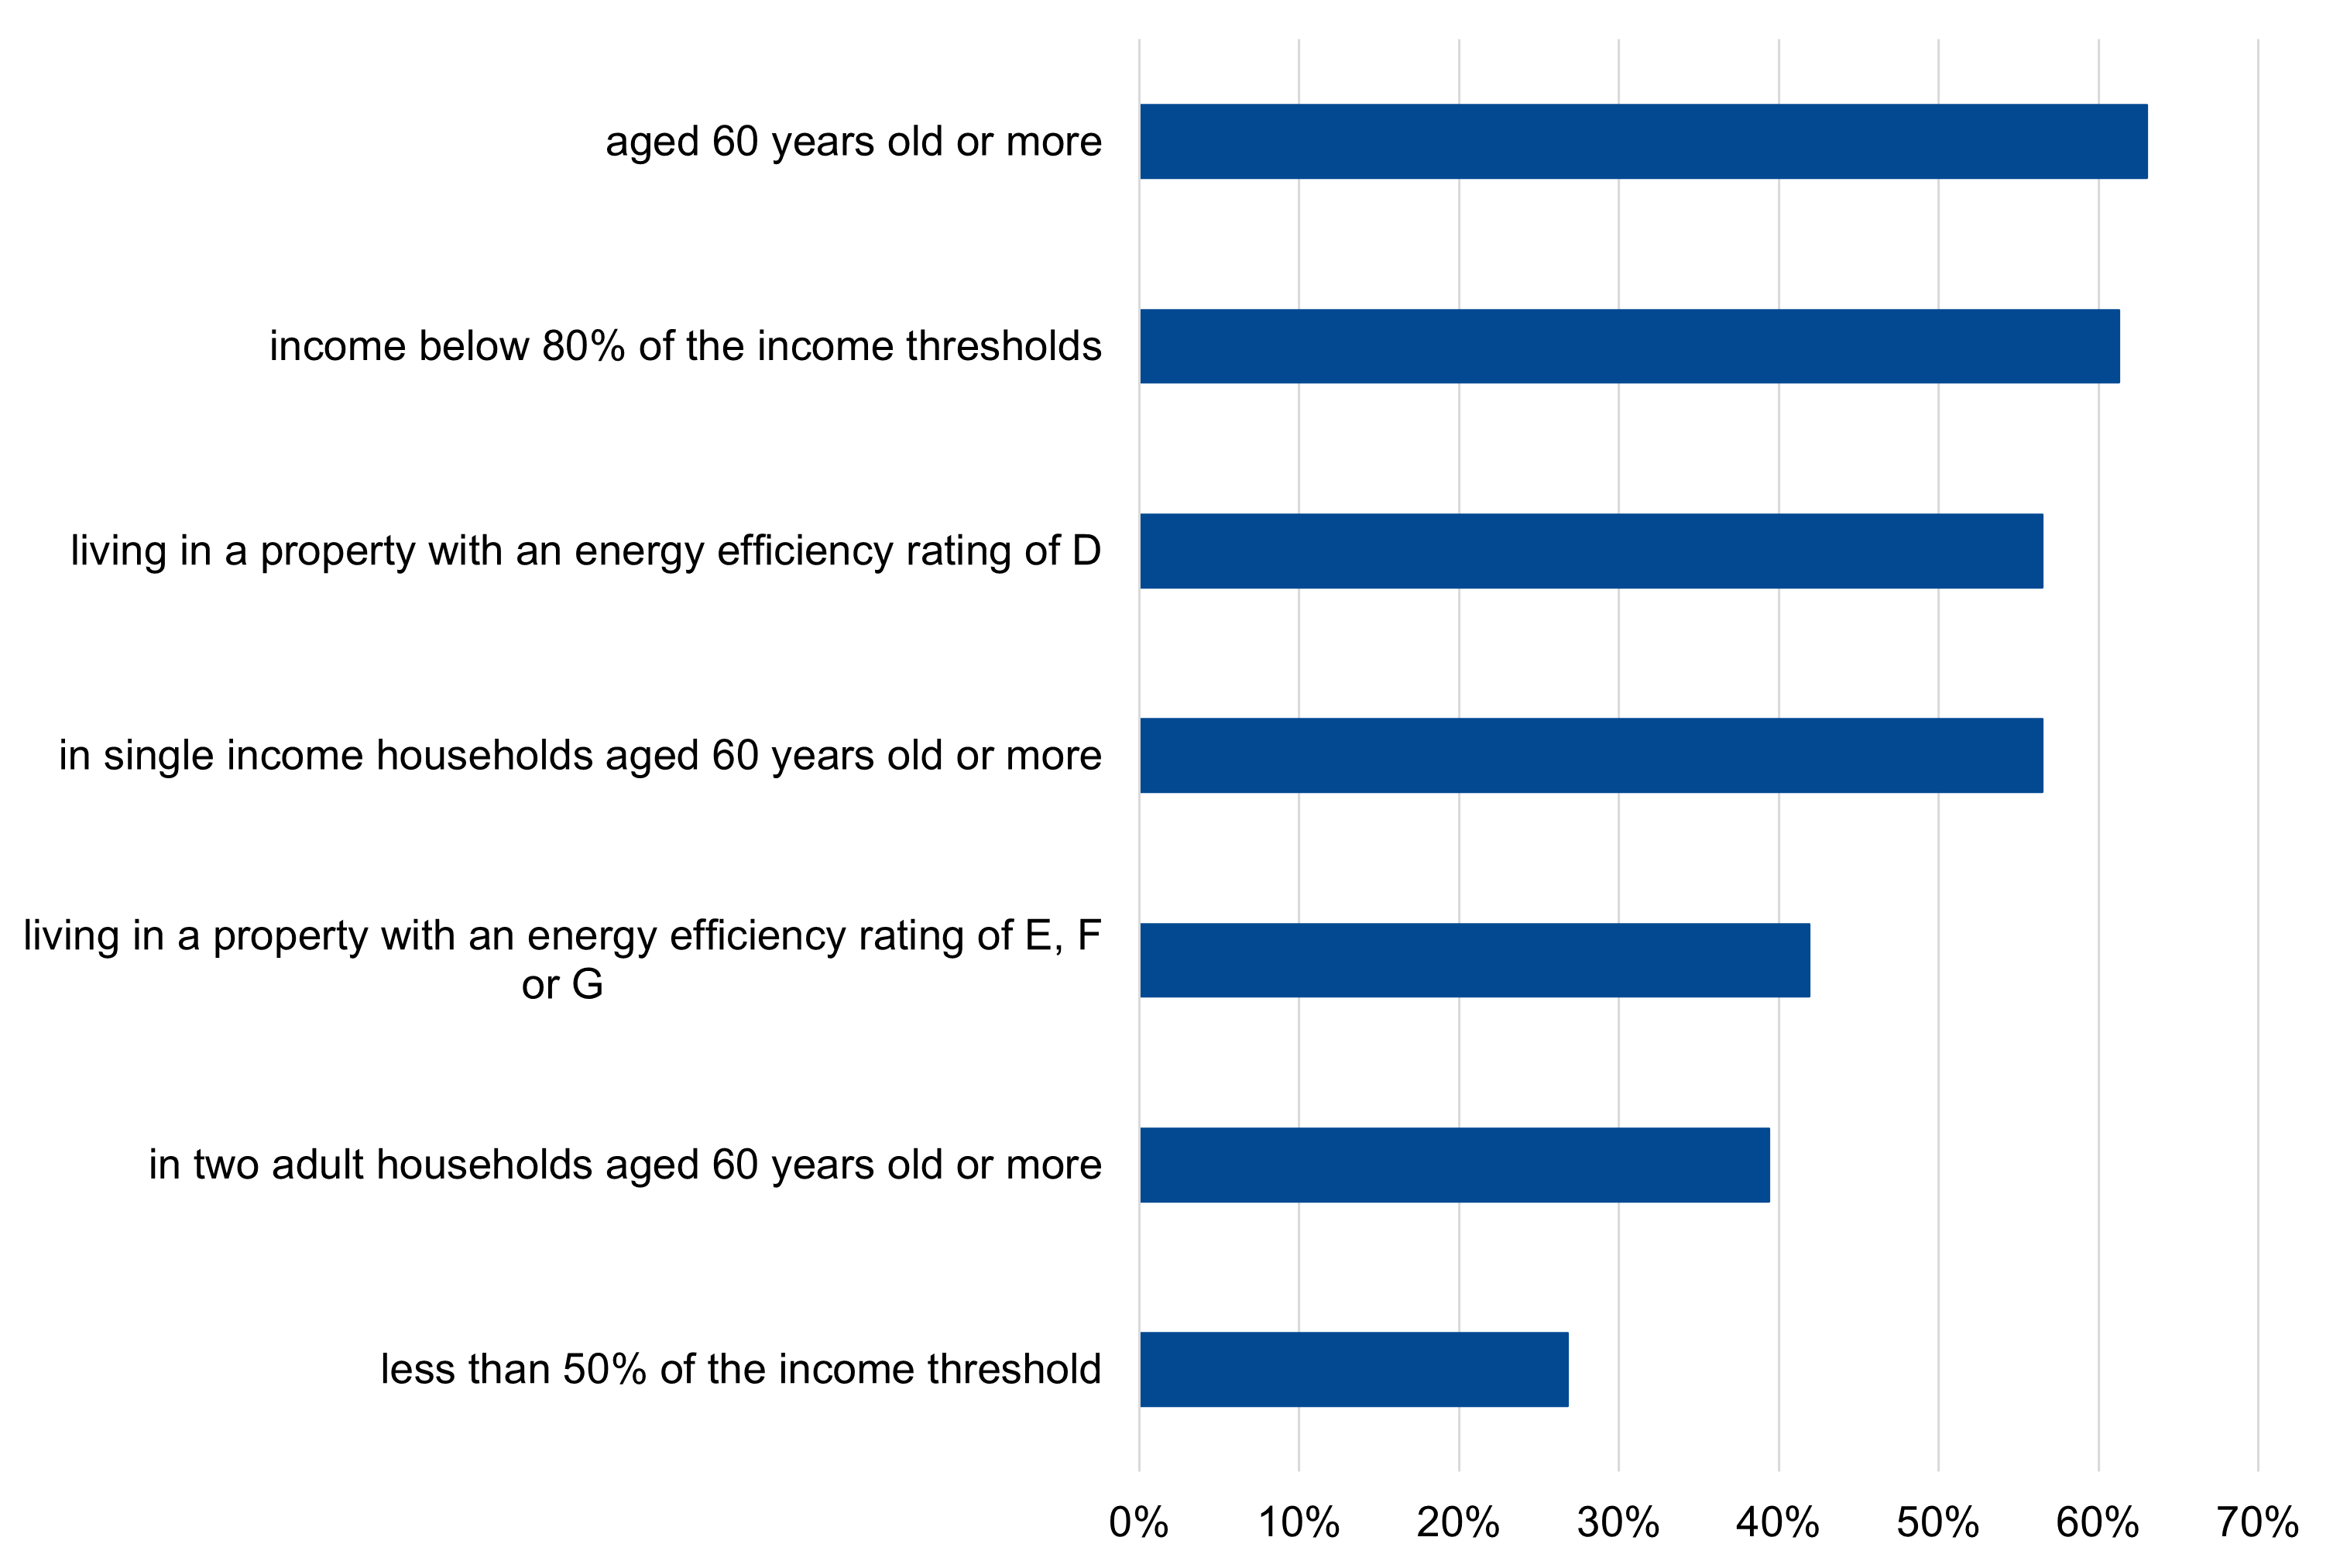
Description of figure 3: Bar chart showing the percentage of household referrals under the health criteria, by vulnerable household category.
Source: Nest management reports
[Note 1] The Nest eligibility criteria provides a detailed breakdown of the health criteria and income thresholds
[Note 2] A household referred for an income assessment under the health criteria may fall into more than one vulnerable household category.
Home energy improvement package installation process
As part of delivering support to tenants in privately rented homes, Nest worked in partnership with Rent Smart Wales to ensure that private landlords were officially registered before improvements were carried out in their properties.
For each customer referred from the advice service, a fully qualified assessor:
- visited the customer’s home to complete a whole house assessment;
- identified the most appropriate and cost-effective measures for the property; and
- confirmed the eligibility of the customer.
The Nest team ensured all required permissions and consents (landlords, planning etc.) and third-party requirements (gas connections, asbestos removal etc.) were completed prior to agreeing the installation dates with the customer.
A network of Wales-based installers provided the installation services under the management of the Nest team. An inspection was undertaken of the completed installation package and remedial work of any identified defects was completed quickly and effectively.
Nest home energy efficiency improvement packages were designed for individual properties, so there was no standard package of measures, but it could have included a new boiler, central heating system, or loft insulation and some may have included newer technologies like solar panels, air source heat pumps and external wall insulation.
Between October 2024 to March 2025, most energy efficiency installations were heating systems (boiler replacements or LPG water heaters), accounting for around 31% of all measures. Solar and other renewable energy measures made up 26% of installations. An Air Source Heat Pump and associated hot water cylinder were much less common, representing 2% of all installations.
Figure 4: Nest installations by types of measure, October 2024 to March 2025
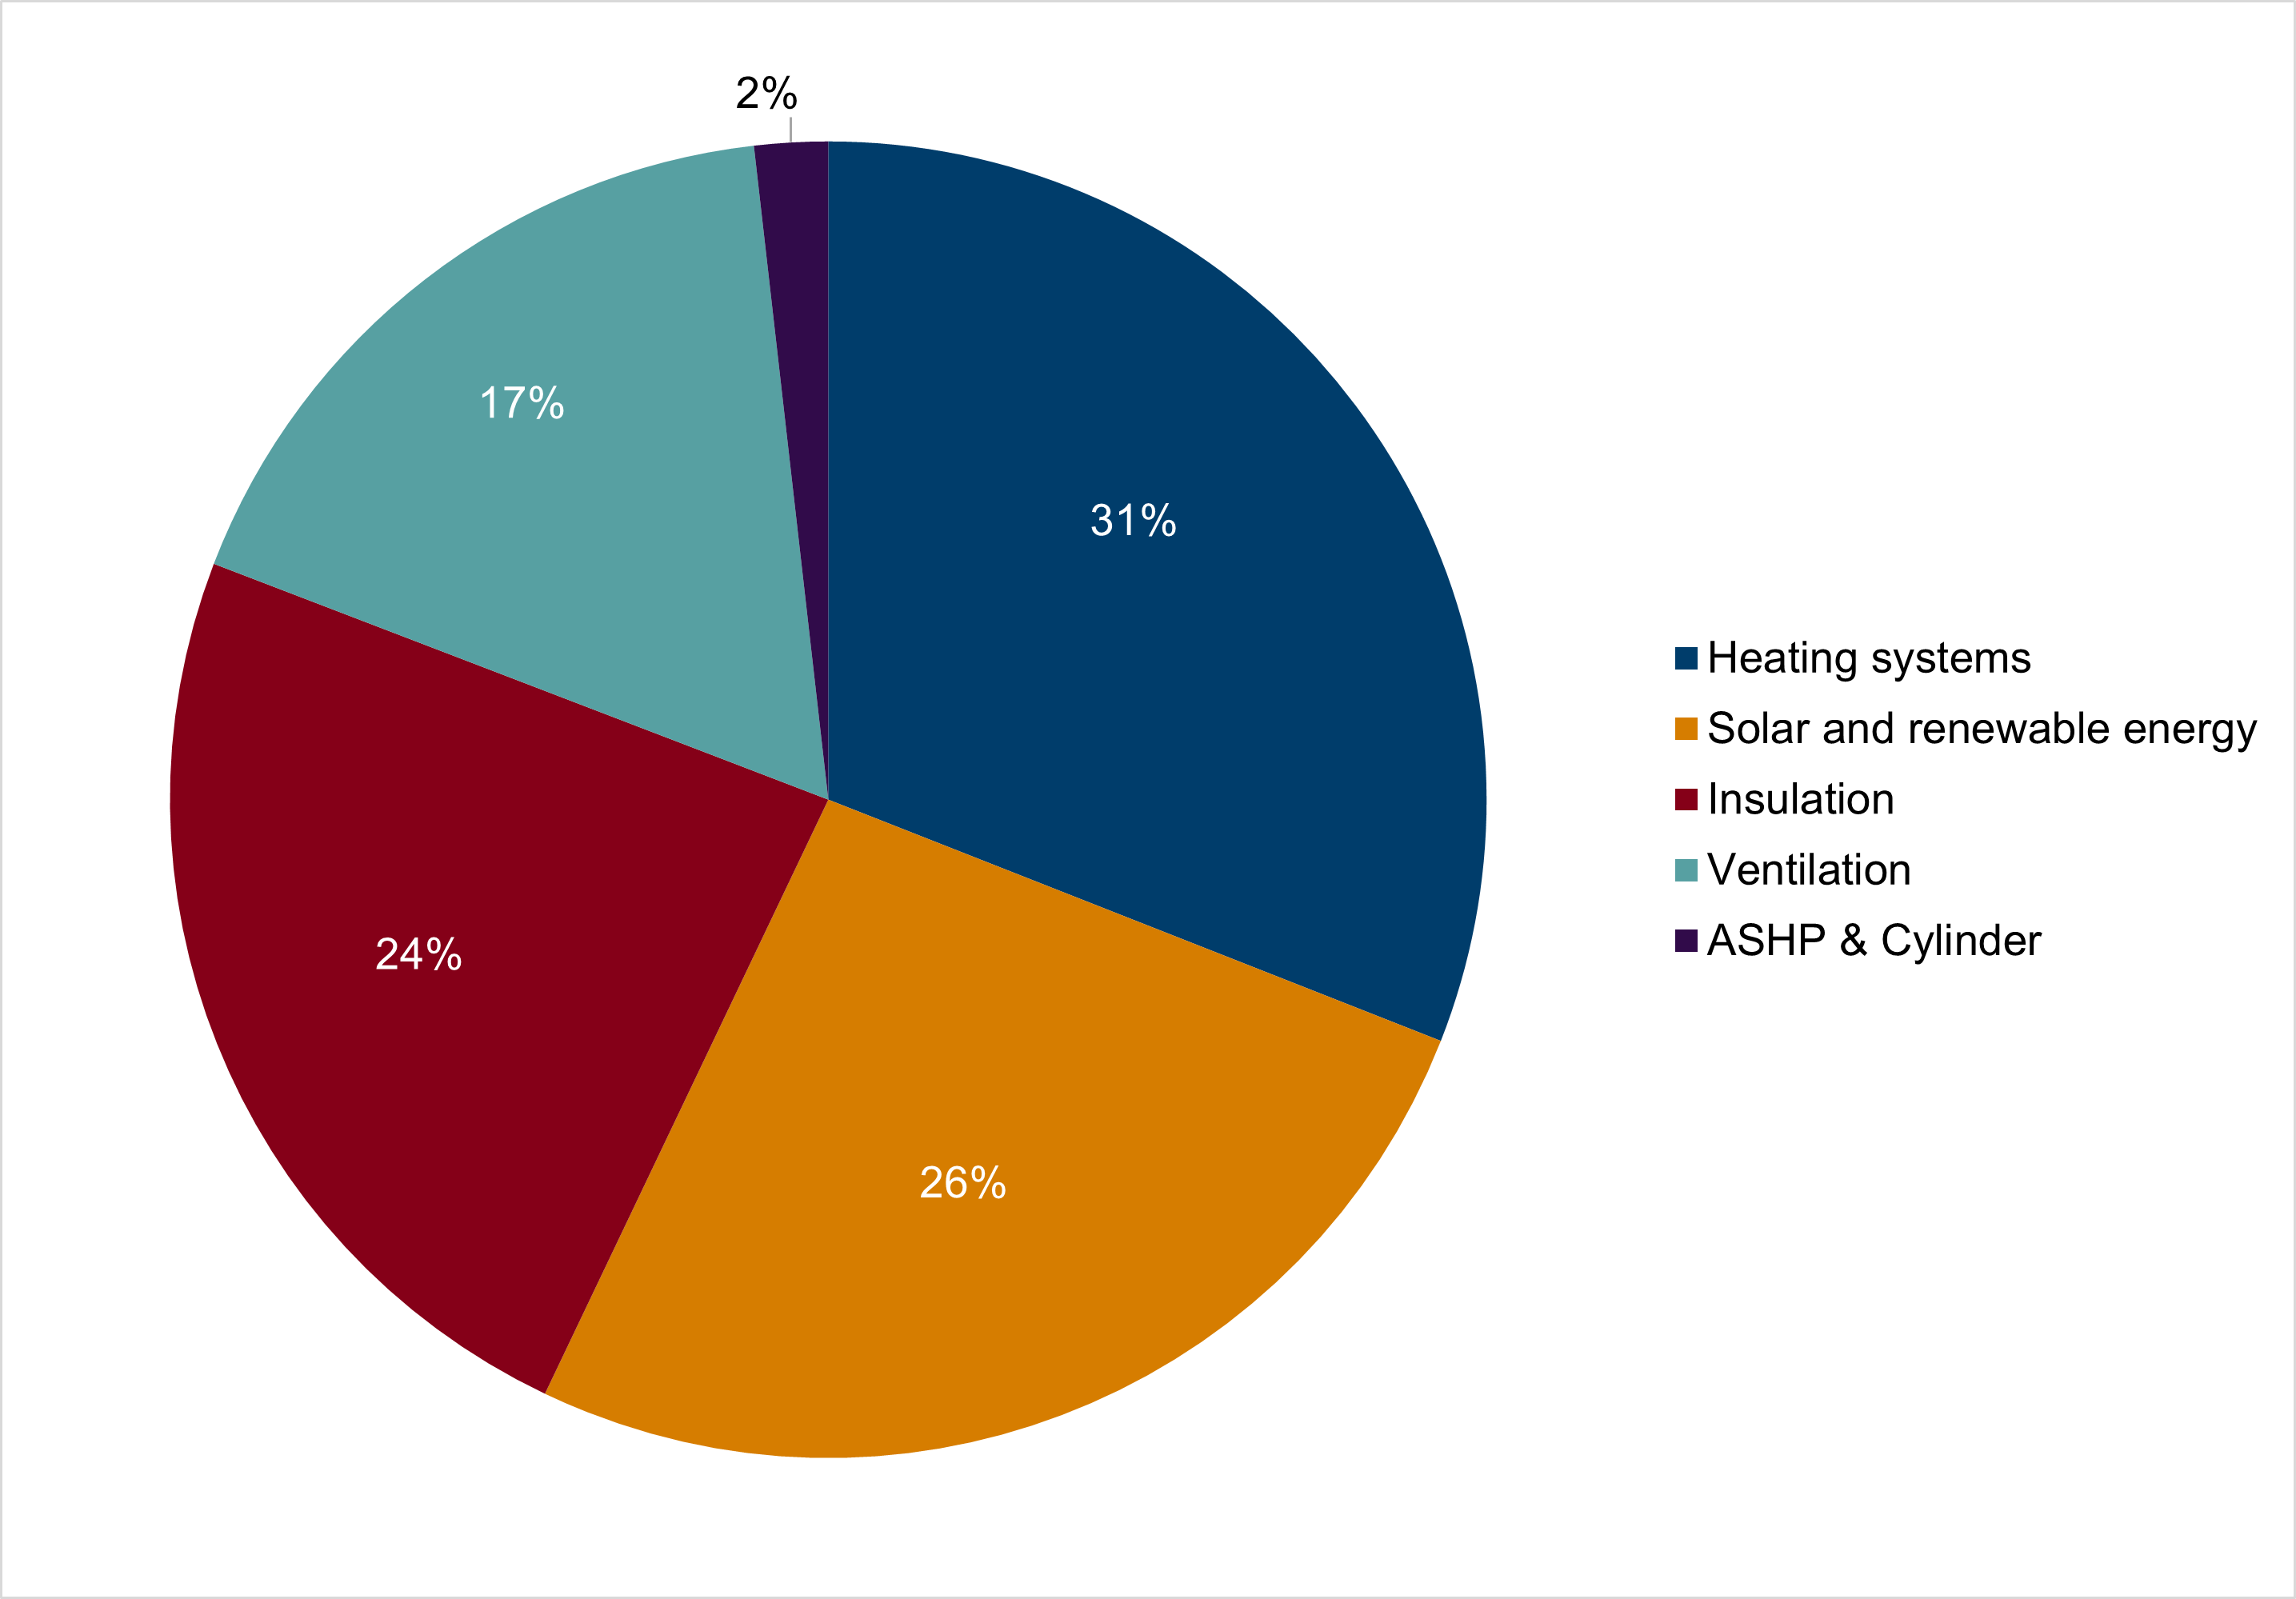
Description of figure 1: Pie chart showing the proportion of Nest installations by type of measure.
Source: Nest management reports
Between October 2024 to March 2025, Nest provided 348 energy improvement package installation. Rhondda Cynon Taf had the highest number of installations with 48, followed by Cardiff with 44.
Figure 5: home energy improvement packages by local authority, October 2024 to March 2025
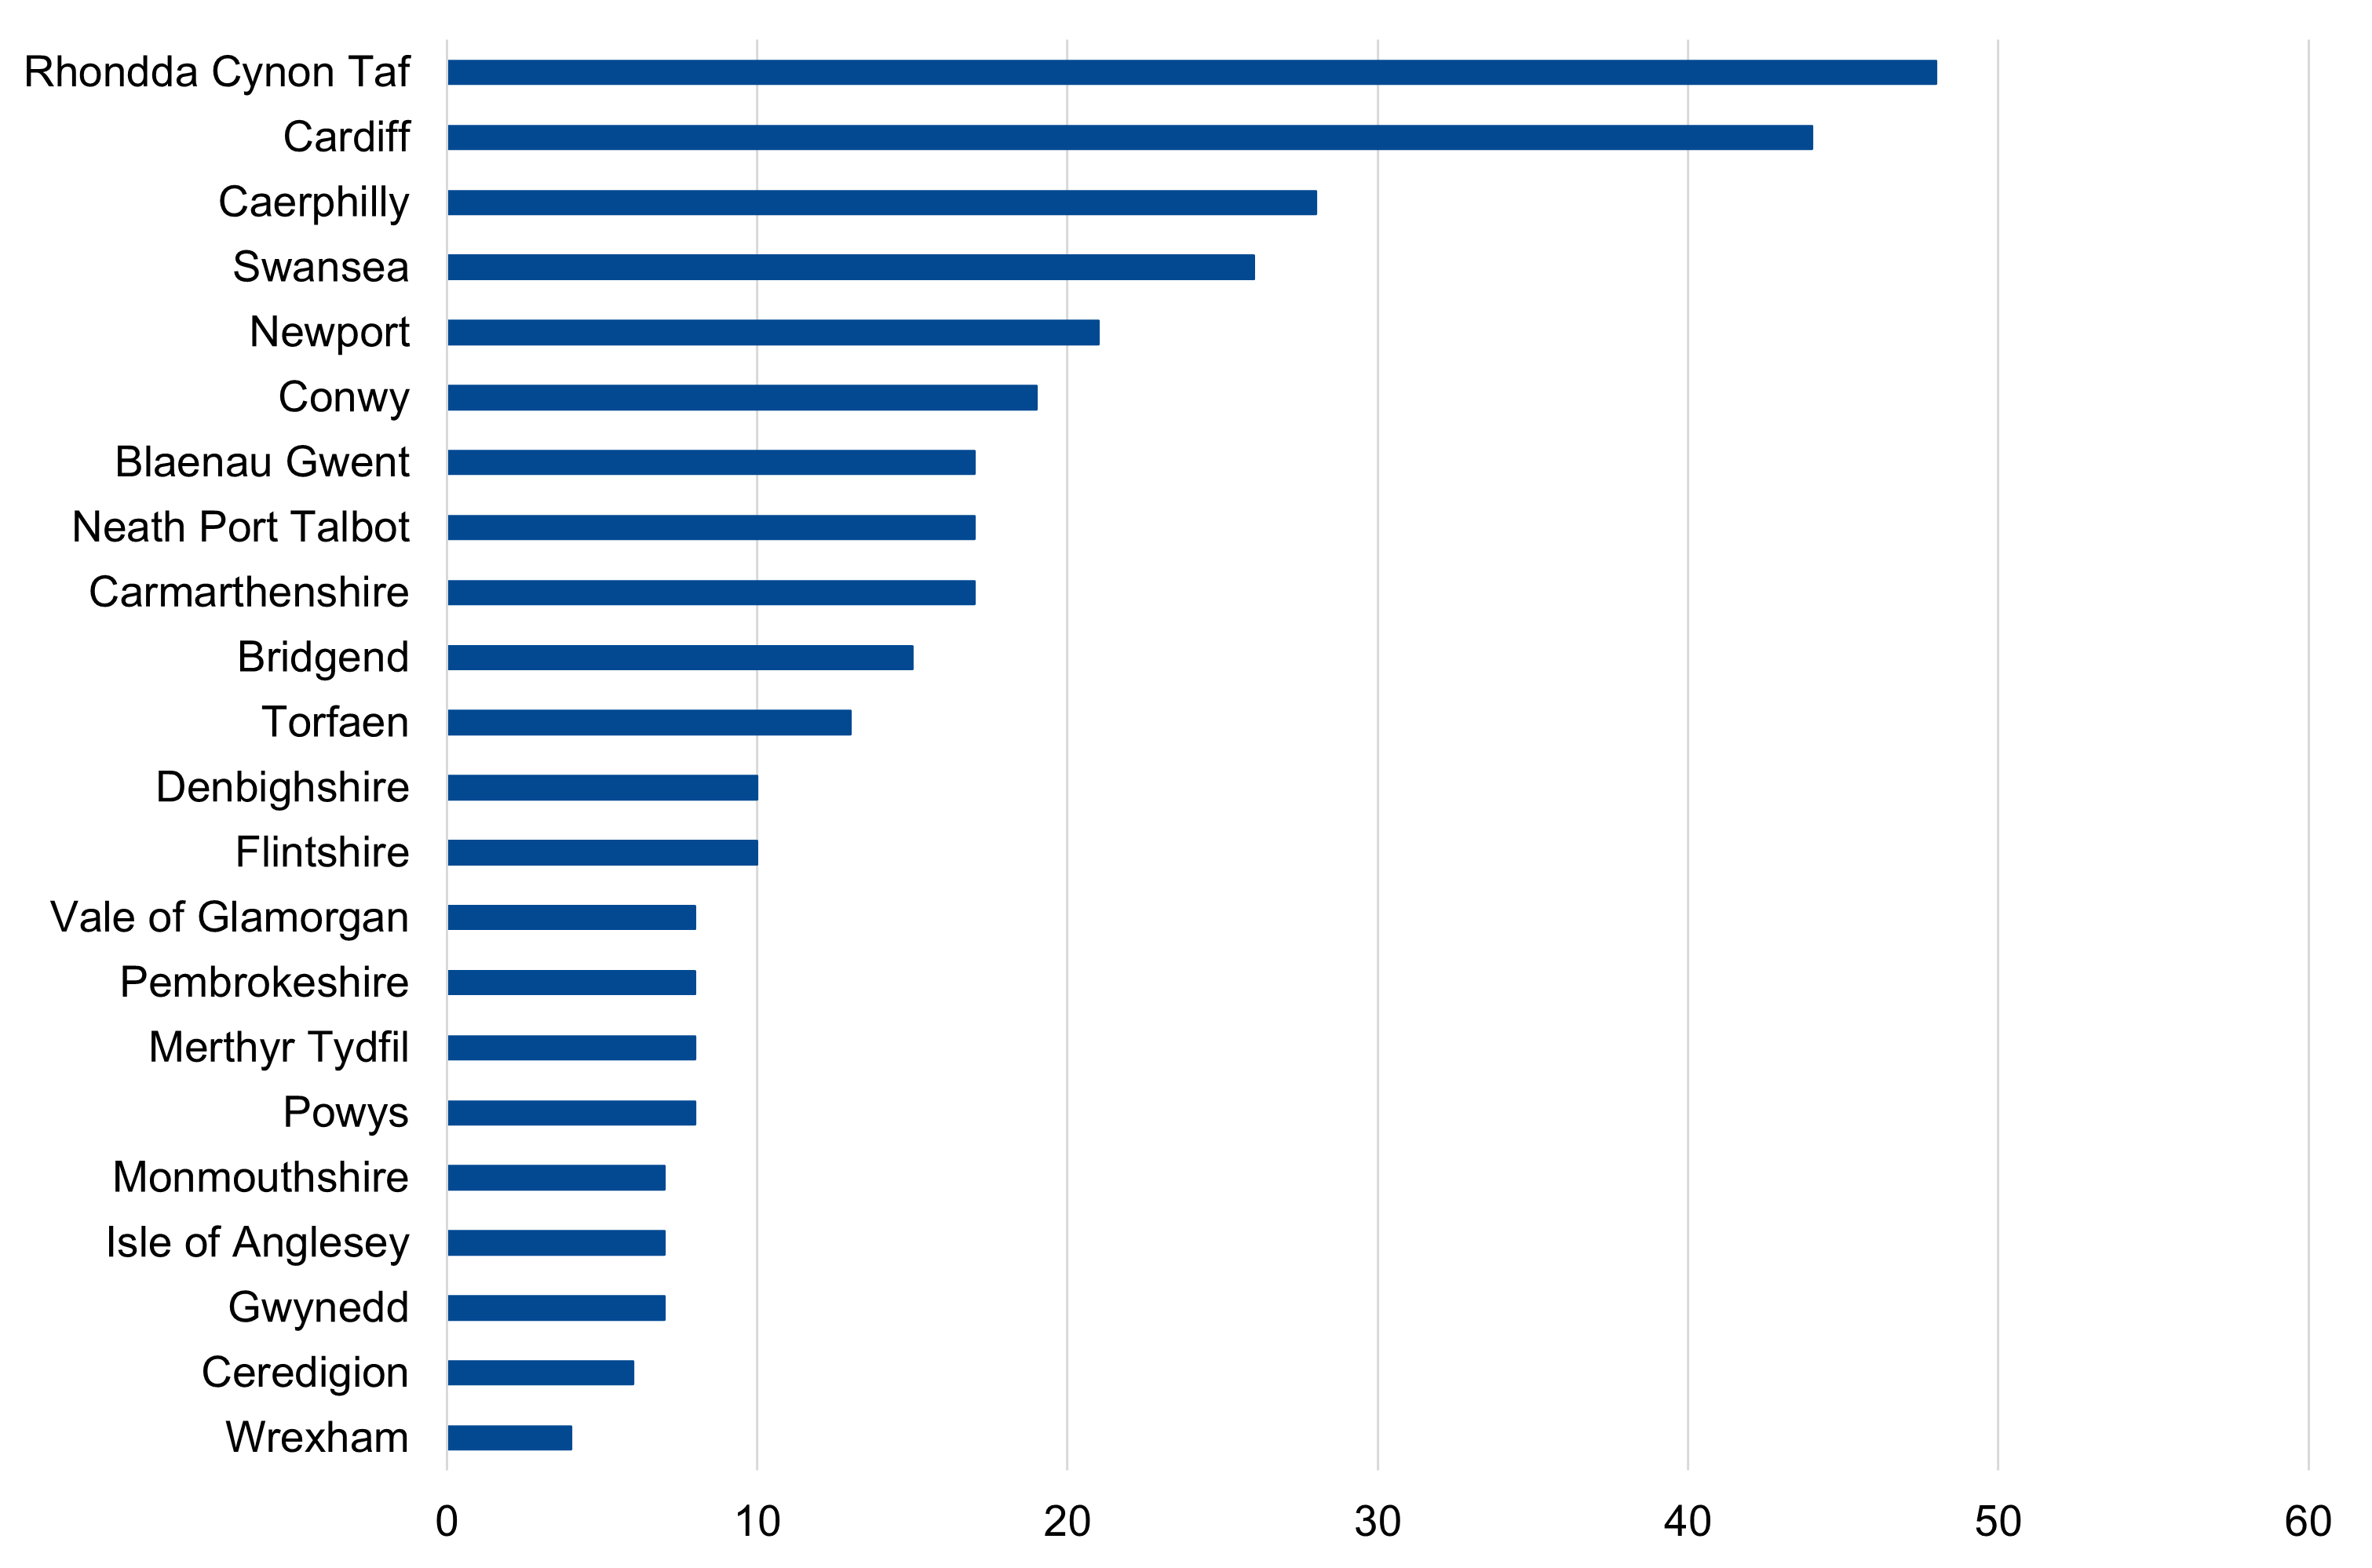
Description of figure 5: Bar chart showing the number of home energy improvement packages by local authority provided through Nest by local authority.
Source: Nest management reports
Household characteristics of those who received improvement packages
This section provides a summary of households that received Nest home energy efficiency improvement packages between October 2024 to March 2025, broken down by household characteristics. Information on households that received advice is provided earlier in the report. Detailed visualisations are represented on our interactive dashboard and published tables.
Fuel poverty profile
Nest aims to bring people out of fuel poverty. During the initial application process, householders were asked to confirm their household income. This information was assessed against modelled running costs for their household. This allowed the Nest advice team to assess whether the customer was living in fuel poverty.
Households who were assessed to be spending over 10% of their income on energy bills were classified as living in fuel poverty, with households spending over 20% classed as living in severe fuel poverty.
More than a third of households receiving a home energy efficiency improvement package self-reported being in fuel poverty. Around 37% said they were in fuel poverty, while 14% were in severe fuel poverty. The remaining 43% did not report themselves as being in fuel poverty and 6% did not provide information.
These figures are based on self‑reported status and do not necessarily reflect eligibility for the scheme, which is determined through broader criteria. As such, the proportion reporting they are not in fuel poverty should not be interpreted as evidence of mis‑targeting
Age profile of Household Reference person (HRP)
The Household Reference Person (HRP) is the person in whose name the property is owned or rented. If the property is jointly owned or rented, the HRP is the person with the highest income. If incomes are the same, the eldest person is chosen.
Households with an HRP aged 65 or over made up 34% of households receiving a home energy improvement package through the Warm Homes Nest programme. A further 23% of households receiving improvements had an HRP aged 55 to 64. In contrast, only around 8% of households receiving improvements had an HRP aged 16 to 34.
Tenure
Most households receiving a home energy efficiency improvement package through the Warm Homes Nest scheme were owner-occupiers. Around 83% of recipients owned their homes, 13% were in private rented accommodation, and 4% were recorded as unknown (either owner‑occupied or private rented). The Nest scheme did not fund social housing upgrades as there are separate Welsh Government funding schemes for that purpose.
Net income
Households receiving a home energy efficiency improvement package generally had low incomes. Around 44% reported a net annual income below £15,000, while 36% earned between £15,000 and £25,000. Only 20% had incomes above £25,000.
Protected characteristics
Information on protected characteristics such as ethnic group and disability status was collected. However, there were too many unknown or missing responses to allow meaningful analysis or reporting of these data. We will review and strengthen our data collection processes in future years to improve completeness and support more robust analysis of protected characteristics data.
Characteristics of the homes
This section provides a summary of households that received Nest home energy efficiency improvement packages between October 2024 to March 2025, broken down by the characteristics of their homes. Information on households that received advice is provided earlier in the report. Detailed visualisations are represented on our interactive dashboard and published tables.
Property type
Most households receiving a home energy efficiency improvement package lived in semi-detached or mid-terraced properties. Semi-detached homes accounted for 35% of recipients and mid-terraced homes for 30%. Detached properties made up 19%, while end-terraced homes represented 14%. Flats made up 2% of the home energy efficiency improvement packages. These proportions reflect the characteristics of the homes receiving improvements and do not reflect the proportions within in the housing stock as a whole.
Number of bedrooms
Smaller homes were more likely to receive a home energy efficiency improvement package. Almost half (49%) of recipients lived in homes with two bedrooms or fewer, while 42% were in three-bedroom homes. Only 8% lived in properties with four or more bedrooms. This pattern reflects the fact that smaller, lower‑cost homes are more commonly occupied by lower‑income or single‑income households, who are at greater risk of fuel poverty, rather than the size of the home itself being a driver of fuel poverty.
Age of property
Older homes were more likely to receive energy efficiency upgrades. Around 36% of supported properties were built before 1930, 13% between 1930 and 1949, and 25% between 1950 and 1966. A further 16% were built between 1967 and 1982, while only 10% were constructed after 1982. Older homes often lack modern insulation and efficient heating systems, which increases the need for improvements.
Main heating system and fuel type
Most households receiving a home energy efficiency improvement package had a boiler as their main heating system (97%). 92% of households used mains gas as their main fuel type.
Central heating systems include: boiler systems with radiators, warm air and other systems such as underfloor heating, and communal systems.
Gas connection
Most households receiving a home energy efficiency improvement package were connected to mains gas (92%). Homes without a gas connection often rely on alternative fuels, such as oil or LPG, which can be more expensive and less efficient.
Wall type and insulation
Half of the homes receiving a home energy efficiency improvement package had cavity walls. Between October 2024 to March 2025, 50% of properties had cavity walls, 23% had solid walls, and 21% had insulated solid walls.
Location: urban or rural classification
The location of a home receiving improvements was classified using the Office for National Statistics (ONS) 2011 Rural - Urban classification. Areas are treated as ‘urban’ if they are part of a built-up area which contains 10,000 people or more. Rural areas include towns and fringes, villages, hamlets and isolated areas.
90% of homes receiving improvements were in urban areas, while only 10% were in rural areas.
Improving energy efficiency
Nest home energy efficiency improvements including retrofit upgrades and crisis referrals have delivered estimated energy bill savings averaging £570 and £578 respectively, per household per year making a real difference to fuel-poor households.
Energy efficiency: SAP rating & EPC band
The Standard Assessment Procedure (SAP) is the UK Government’s method for assessing the energy efficiency of homes. It produces a score from 1 to 100, which is then grouped into Energy Performance Certificate (EPC) bands A to G, with band A representing the most energy efficient homes and band G the least energy efficient. The Reduced Data Standard Assessment Procedure (RdSAP) is a simplified version of SAP used to assess existing homes.
The Nest scheme uses RdSAP to calculate a home’s SAP score before and after energy‑efficiency measures are installed. This helps assess whether the proposed measures can cost‑effectively improve the energy efficiency of the home. Nest typically supports homes in lower EPC bands G to D, which correspond to SAP scores from 0 to 68 and indicate poorer energy efficiency and higher running costs. After improvements have been installed, the SAP score is updated to reflect the measures actually fitted, as packages may change due to technical issues or customer preferences.
Changes in EPC band before and after installation of home energy efficiency improvement packages
Before improvements, most households had very low energy efficiency. Around 34% were in EPC band G, 28% were in band F and 14% were in band E.
The change in EPC is primarily driven by the recommended installation measures. However, in some instances householders choose not to receive all measures offered, which impacts on the final EPC band. After installation, energy efficiency improved significantly. Around two thirds (66%) of households moved up to band C and 15% reached band B. Only 24% remained in band D, 8% in band E, 1% in band F and none remained in band G.
Figure 6: Energy efficiency rating before and after installation of home energy efficiency improvement packages [Note 1]
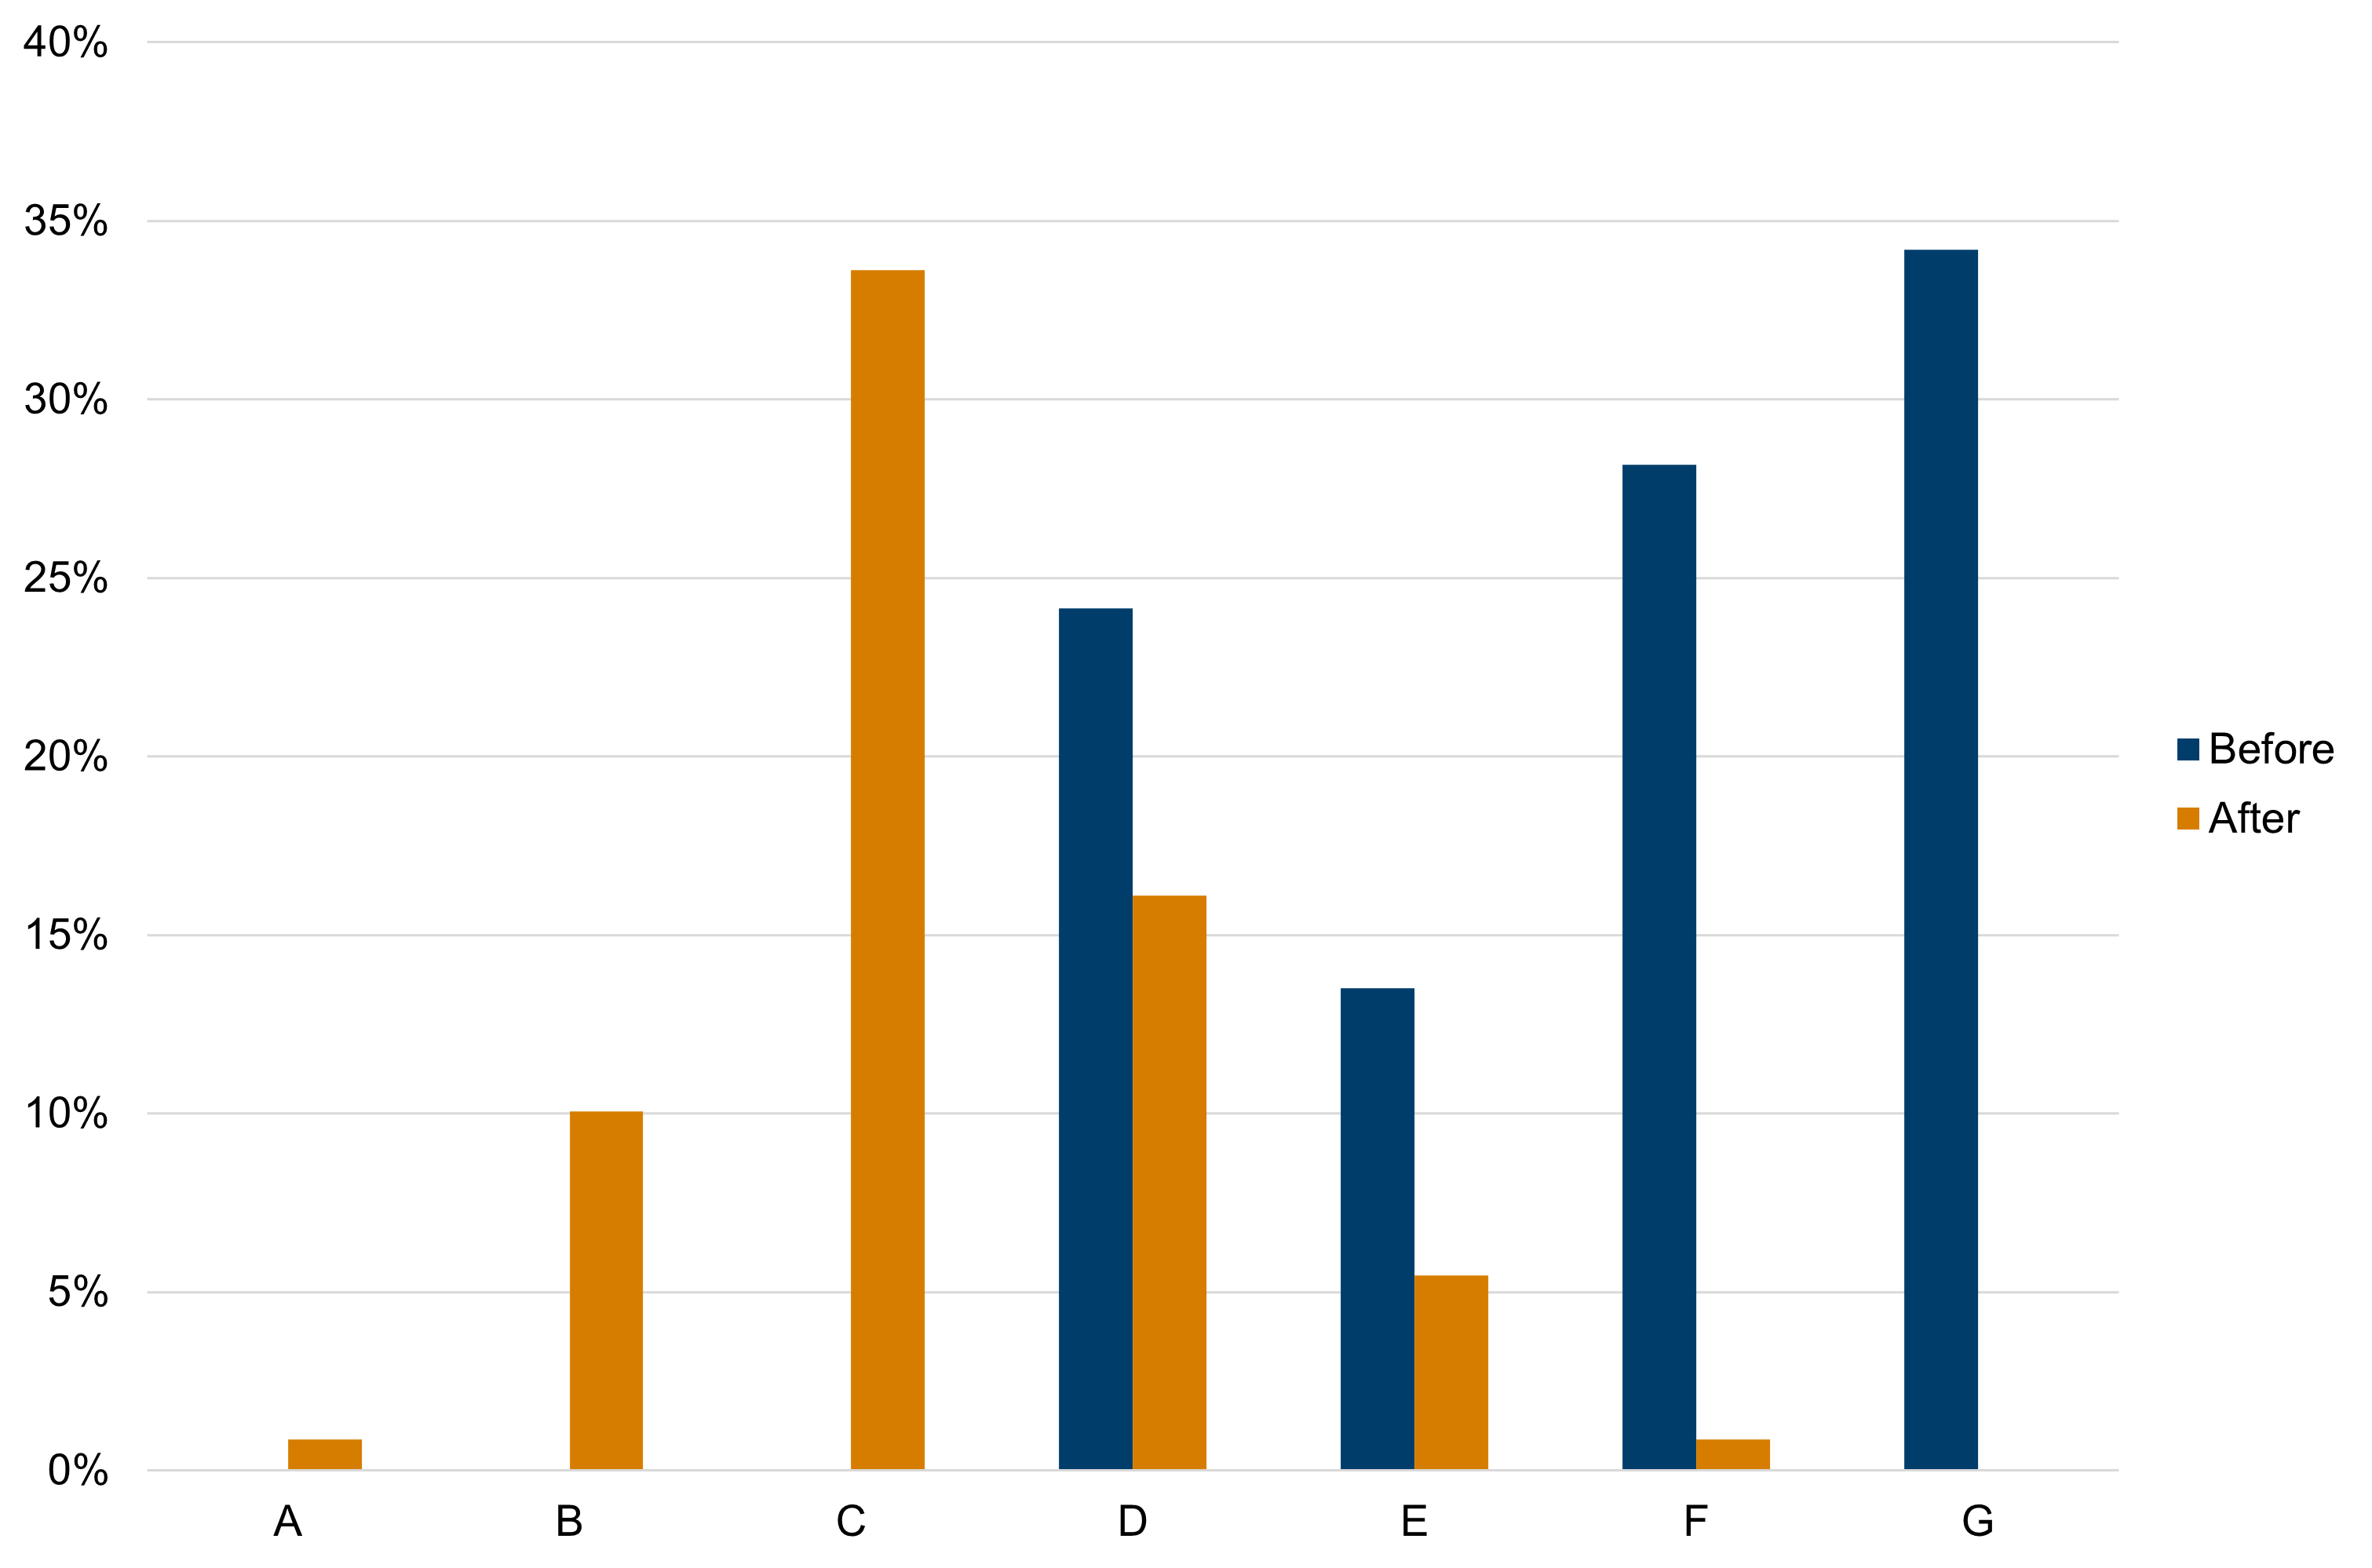
Description of figure 6: Bar chart showing the energy efficiency rating before and after installations of home energy efficiency improvement packages.
Source: NEST management reports
[Note 1] Data is based on home energy efficiency improvement packages delivered between October 2024 and March 2025. Out of 348 households supported, 232 have a recorded SAP score after installation. Post‑installation SAP scores were not available at the time the information was provided for 116 households.
Household savings: cost, energy and carbon dioxide emissions
Data on household savings have been reported separately for the standard Nest service, where the PAS2035 process is followed from the start, a whole house assessment is carried out first and a full set of recommendations inform the energy efficiency improvement package.
Households referred through the crisis route require immediate support. Consequently, an emergency response is deployed to restore heating and hot water. Customers are subsequently offered an assessment for further energy efficiency measures and, if accepted, these are installed at a later date.
Between October 2024 and March 2025, home energy efficiency packages delivered through the standard Nest service were estimated to save households around £570 a year on energy bills, equivalent to about 92,390 megajoules of energy annually. The analysis also shows the expected lifetime reduction in carbon emissions for households receiving improvements, with total emissions projected to fall by over 2,113 tonnes of CO2.
| Local Authority | Average of Fuel Cost Annual Saving | Sum of CO2 Lifetime Saving | Average of Energy Use Saving |
|---|---|---|---|
| Blaenau Gwent | £518 | 45 | 85,511 |
| Bridgend | £577 | 85 | 81,767 |
| Caerphilly | £569 | 161 | 97,344 |
| Cardiff | £477 | 256 | 93,849 |
| Carmarthenshire | £618 | 138 | 106,446 |
| Ceredigion | £1,102 | 28 | 39,819 |
| Conwy | £513 | 90 | 69,854 |
| Denbighshire | £549 | 61 | 75,570 |
| Flintshire | £509 | 56 | 103,510 |
| Gwynedd | £473 | 72 | 74,845 |
| Isle of Anglesey | £687 | 91 | 124,385 |
| Merthyr Tydfil | £508 | 48 | 125,194 |
| Monmouthshire | £822 | 83 | 164,612 |
| Neath Port Talbot | £441 | 48 | 58,866 |
| Newport | £545 | 52 | 60,944 |
| Pembrokeshire | £655 | 78 | 139,474 |
| Powys | £647 | 69 | 78,930 |
| Rhondda Cynon Taf | £565 | 230 | 131,899 |
| Swansea | £541 | 181 | 101,173 |
| Torfaen | £559 | 120 | 108,750 |
| Vale of Glamorgan | £554 | 105 | 98,188 |
| Wrexham | £442 | 18 | 42,965 |
| Total | £570 | 2,113 | 92,390 |
Description of Table 1: Breakdown of modelled energy savings per household receiving measures by local authority, with an estimated average saving of £570 per year or 92,390 megajoules (units of energy) per annum.
Between October 2024 and March 2025, home energy efficiency packages delivered through crisis referral were estimated to save households around £578 a year on energy bills, equivalent to about 21,355 megajoules of energy annually. The analysis also shows the expected lifetime reduction in carbon emissions for these households receiving improvements, with total emissions projected to fall by over 5,159 tonnes of CO2.
| Local Authority | Average of Fuel Cost Annual Saving | Sum of CO2 Lifetime Saving | Average of Energy Use Saving |
|---|---|---|---|
| Blaenau Gwent | £516 | 242 | 21,318 |
| Bridgend | £553 | 230 | 20,789 |
| Caerphilly | £610 | 454 | 21,788 |
| Cardiff | £568 | 628 | 21,170 |
| Carmarthenshire | £560 | 247 | 20,642 |
| Ceredigion | £200 | 7 | 18,804 |
| Conwy | £643 | 307 | 21,677 |
| Denbighshire | £623 | 124 | 21,854 |
| Flintshire | £622 | 176 | 20,823 |
| Gwynedd | £404 | 37 | 21,293 |
| Isle of Anglesey | £819 | 103 | 24,787 |
| Merthyr Tydfil | £567 | 133 | 21,372 |
| Monmouthshire | £503 | 92 | 21,715 |
| Neath Port Talbot | £520 | 246 | 20,714 |
| Newport | £525 | 314 | 21,003 |
| Pembrokeshire | £584 | 119 | 21,290 |
| Powys | £558 | 66 | 19,938 |
| Rhondda Cynon Taf | £617 | 970 | 21,876 |
| Swansea | £610 | 433 | 21,494 |
| Torfaen | £563 | 147 | 20,402 |
| Vale of Glamorgan | £636 | 71 | 22,330 |
| Wrexham | £395 | 12 | 19,940 |
| Total | £578 | 5,159 | 21,355 |
Source: Nest management reports
Description of Table 2: Breakdown of modelled energy savings (crisis route) per household receiving measures by local authority, with an estimated average saving of £578 per year or 21,355 megajoules (units of energy) per annum.
Welsh Government investment
Between October 2024 and March 2025, the Welsh Government invested £6.7m in delivering the Nest Scheme. To ensure value for public money, and to ensure the scheme’s support can reach as many people as possible, Nest has a threshold of £35k per household. Any project above this threshold requires additional assurance and sign-off before proceeding. The average spend per package of measures/home receiving support was highest in the Vale of Glamorgan at £19.7k, followed by Ceredigion at £17.5k. Gwynedd had the lowest average spend at £6.1k.
Differences in average spend are likely due to the type and cost of the work needed in each area. This likely reflects the types of homes in different areas of Wales, the rurality, connections to the gas grid, the age of the home and the materials used to build them.
Figure 7: average spend per household on home energy efficiency improvements by local authority, October 2024 to March 2025
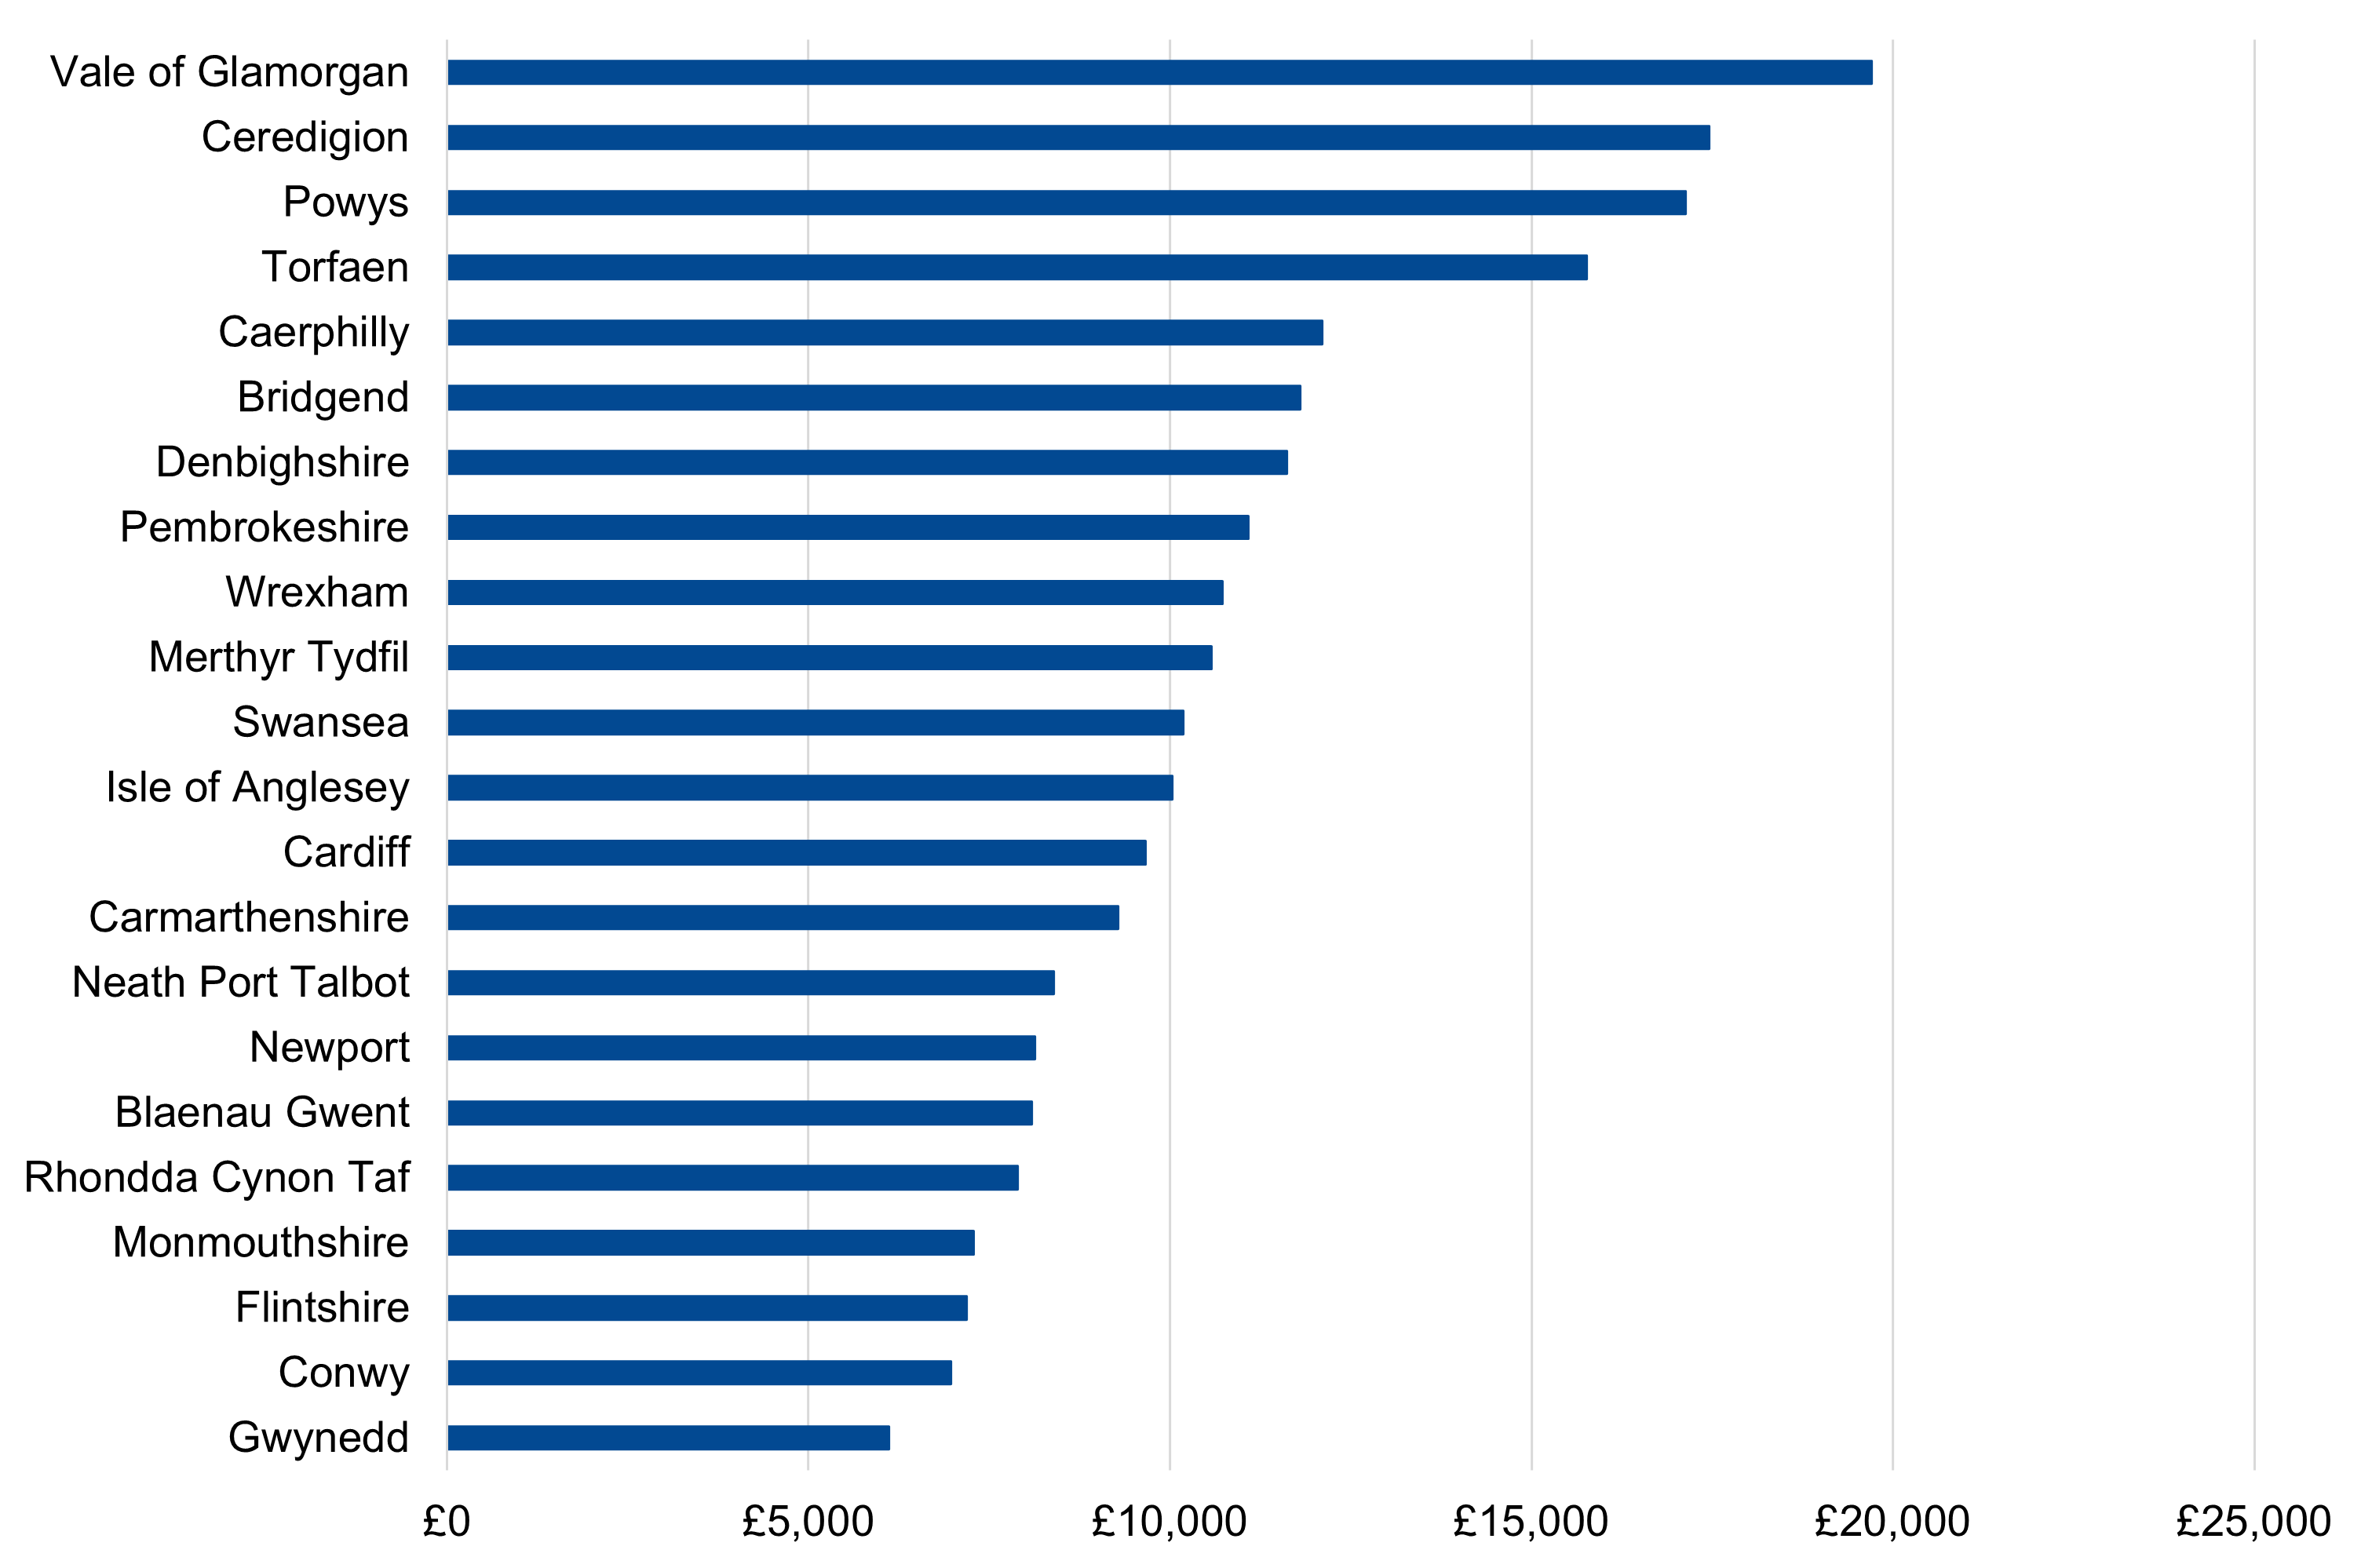
Description of figure 7: Bar chart showing the average spend per household on home energy efficiency improvements by local authority. The spend is higher in some local authorities due to the number of properties not on mains gas.
Source: NEST management reports
Quality and Householder Satisfaction
An independent contractor is employed to quality assure the Nest scheme. The contractor reviews the work of the service on a risk basis, with a greater level of scrutiny of more complex and higher risk installations. The delivery agent has a target of 98% of installations achieving a first-time pass on inspection. This was surpassed, with 98.4% of installations achieving a first-time pass.
Between October 2024 and March 2025, 348 home energy‑efficiency packages were installed. The percentage of customer complaints upheld during this period accounted for only 1.4% of all installations against a target of no more than 3% of upheld complaints, indicating very high satisfaction.
Across all householders advised or receiving improvements through the scheme, 5,490 postal surveys were issued to gather feedback on satisfaction with the service. The survey is sent per unique household and only where the Data Protection Agreement (DPA) has been ticked. Responses were monitored throughout each stage of the customer journey, with 595 householders answering the question on the overall service, of whom 79% reported being satisfied. As a separate exercise, British Gas measures customer satisfaction of the installations with the satisfaction rate for the period April 2024 to March 2025 being 98%.
Contact
Visit NEST for more information about the Nest scheme, including how to contact the team.