
Welsh Index of Multiple Deprivation 2025: deprivation in rural and urban areas
Analysis of patterns of deprivation in different types of rural or urban areas of Wales, using the Welsh Index of Multiple Deprivation (WIMD) 2025.
In this page
Introduction
This statistical article explores how the Welsh Index of Multiple Deprivation (WIMD) 2025 can be used to understand patterns of deprivation in different types of rural or urban areas of Wales.
Following the summary of main points, we provide a brief overview of WIMD and the Rural Urban Classification (RUC). We then provide analysis of overall deprivation and illustrative analysis of the income, access to services and housing domains of WIMD. Deprivation profiles and indicator datasets by RUC are available for all 8 domains of WIMD 2025 on StatsWales.
This report updates and builds on our WIMD 2014 statistical article on analysing deprivation in rural areas. It uses the more recent WIMD 2025 data and the latest RUC based on the 2021 Census.
Main points
This analysis uses statistically defined 'small areas', classified by settlement type:
- urban
- smaller rural settlements
- larger rural settlements
Within each settlement type, areas are further classified as being nearer to or further from a medium town or city (25,000 usual residents or more). Analysis of the data shows that:
- around 30% of the population of Wales live in rural areas (either larger rural or smaller rural)
- a lower than average share of rural areas (2% or 12 areas) are in the most deprived 10% across Wales, spread across 6 local authorities
- the most deprived rural area is Twyn Carno 1 in Caerphilly, ranked 12th most deprived area in WIMD 2025
- areas in the ‘smaller rural’ categories have the lowest proportions of their population in income deprivation, and areas in the urban categories have the highest
- out of all income deprived people, 77% lived in urban areas, 13% in larger rural areas and 10% in smaller rural areas
Multiple deprivation in rural areas is less visible in WIMD ranks because it is often more dispersed, but this is not true for all individual domains of deprivation.
- A third of rural areas are in the most deprived 10% for the access to services domain, and 16% are in the most deprived 10% for the housing domain.
- In the ‘smaller rural: further from a medium town or city’ category, just over three-quarters (77%) of areas are in the most deprived 10% for access to services, and 41% for the housing domain.
Background to WIMD
The WIMD is the official measure of relative deprivation for small areas in Wales. It is an accredited official statistic produced by statisticians at the Welsh Government. It identifies areas with the highest concentrations of several different types of deprivation:
- income
- employment
- health
- education
- access to services
- housing
- community safety
- physical environment
The 3 main components of the 2025 index
- The 54 underlying indicator datasets.
- Ranks for the 8 separate domains (or types) of deprivation, created by combining relevant indicators within each domain.
- Overall WIMD ranks, created by combining the domain ranks.
All of these components are calculated for each of the 1,917 lower layer super output areas or LSOAs in Wales. WIMD ranks all LSOAs from 1 (most deprived) to 1,917 (least deprived) for each separate domain and for the overall index
More information on the index can be found in the WIMD 2025 guidance. Data for WIMD has been published on StatsWales, as well as in the WIMD 2025 results report.
Background to the Rural Urban Classification
The 2021 Rural Urban Classification (RUC) is a statistical classification which provides a consistent and standardised method for categorising geographies as either rural or urban.
There are 3 settlement class for LSOAs in Wales under the 2021 RUC, these are:
- urban
- larger rural settlement
- smaller rural settlement
In this article, these settlement class are combined with the following relative access categories:
- nearer to a medium town or city: can reach a built-up area with 25,000 usual residents or more within 30 minutes travel by private vehicle
- further from a medium town or city: cannot reach a built-up area with 25,000 usual residents or more within 30 minutes travel by private vehicle
This approach to relative access differs to the primary categories in the 2021 RUC, which use a population threshold of 75,000 to define the relative access categories.
In this article, we sometimes group all the smaller and larger rural settlements and refer to these collectively as ‘rural’.
More information on the 2021 RUC can be found in the 2021 RUC methodology section.
Deprivation in rural areas
WIMD’s purpose is to identify concentrations of deprivation across all parts of Wales, including rural areas. However, there are limitations to the index that must be considered when focusing analysis on these areas.
WIMD allows for the identification of the most deprived areas, but each small area will contain a mixture of people. Many non-deprived people live in highly deprived areas, and many deprived people live in relatively less deprived areas.
Deprived people in rural areas of Wales tend to be more geographically dispersed than in urban areas. This means that pockets of deprivation in rural areas of Wales tend to be on a considerably smaller scale than even the small-scale geography at which WIMD is produced.
Although there are not many areas of high multiple deprivation in our definition of rural Wales, our analysis of the underlying WIMD indicators by RUC shows there are still notable numbers of deprived people living in rural areas.
People in rural communities can experience many of the same issues as deprived people in other areas. However, some commentators argue that certain issues can disproportionately affect people in rural areas, for example lack of employment opportunities and access to services. It can also be argued that some deprivation issues can disproportionately affect people in urban areas, such as congestion.
This article and the datasets underpinning it could be used as part of the evidence base to inform a range of rural-focused policy work. They contribute to a better understanding of the specific needs of rural communities, including challenges related to transport, access to services, and affordable housing. Insights from the data may help to inform rural development strategies, and support the rural-proofing of funding models and policies.
MHCLG’s supplementary report on the English indices of deprivation discusses the challenges and critiques regarding the selection of domains and indicators for measuring rural deprivation. It outlines methodological enhancements made to better capture rural conditions in the 2025 English indices, some of which also apply to WIMD 2025, notably:
- in the income domain, the adoption of an ‘after housing costs’ measure helps to capture the high cost of housing and living expenses in many rural areas
- the housing domain contains new indicators on energy efficiency and inability to afford to enter owner occupation or the private rental market
Our WIMD guidance summarises limitations of WIMD and advises on how to use WIMD effectively.
Population by RUC
| RUC | Count of population | Percentage of population | Number of LSOAs |
|---|---|---|---|
| Larger rural: further from a medium town or city | 154,000 | 5 | 92 |
| Larger rural: nearer to a medium town or city | 276,000 | 9 | 169 |
| Smaller rural: further from a medium town or city | 308,000 | 10 | 183 |
| Smaller rural: nearer to a medium town or city | 194,000 | 6 | 117 |
| Urban: further from a medium town or city | 111,000 | 3 | 65 |
| Urban: nearer to a medium town or city | 2,144,000 | 67 | 1,291 |
| Wales | 3,187,000 | 100 | 1,917 |
Source: ONS, small area population estimates 2024, count of population is rounded to the nearest thousand.
The table shows that:
- around 30% (932,000) of the population of Wales live in areas that are classified as rural, and of these half are classed as further from a medium town or city
- around two-thirds (67%) live in urban areas nearer to a medium town or city
In some of the figures in this article we have shortened the wording on relative access, for example ‘urban: nearer to a medium town’ or city is ‘urban: nearer’.
Figure 1: age distribution of the population by LSOA RUC
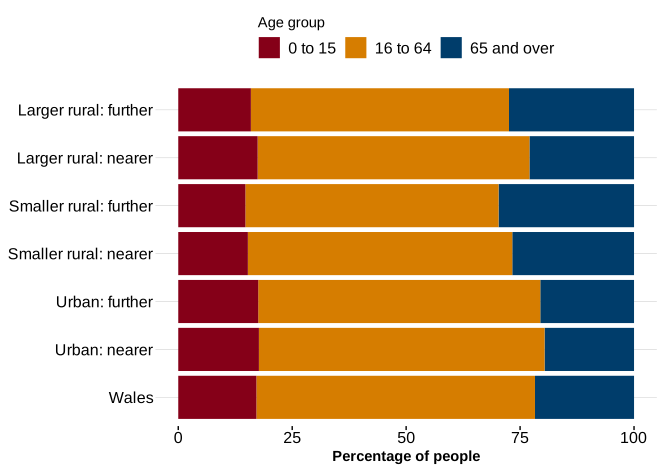
Description of figure 1: a bar chart showing that variation exists in proportions of children and older people by RUC of the small areas with rural categories generally having higher proportions of older people than urban categories.
Source: ONS, small area population estimates 2024
The data shows that:
- the proportions of people that are aged 0 to 15 are lower than the Wales average for rural categories except for ‘larger rural: nearer to a medium town or city’
- the proportions of people that are aged 65 and over are higher than the Wales average in all rural categories
- around 30% of the population is aged 65 or over in smaller rural areas further from a medium town or city, whereas in urban areas it is around 20%
Deprivation by RUC
Figure 2: WIMD 2025 deprivation profile by LSOA RUC
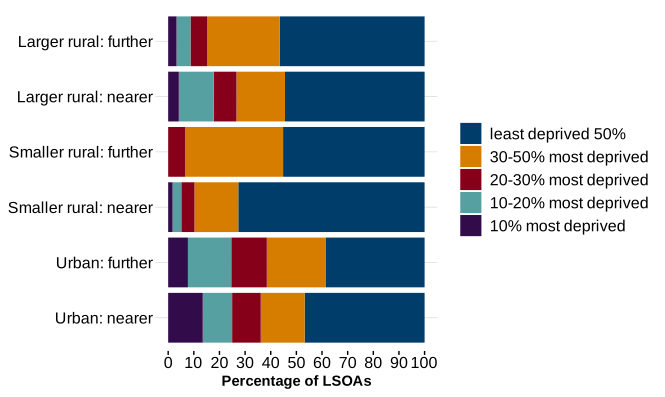
Description of figure 2: a bar chart showing the share of small areas in different deprivation groups, by RUC.
Analysis of the WIMD deprivation profiles also shows that:
- no small areas in the ‘smaller rural: further from a medium town or city’ category are in the top 20% most deprived areas across Wales
- for rural LSOAs, 2% (12 out of 561) are in the most deprived 10% overall (see table 2 for their details)
- the category with the highest percentage of areas in the most deprived 10% overall is ‘urban: nearer to a medium town or city’ at 13% (174 out of 1291 LSOAs)
- the category with the highest percentage of areas in the least deprived 50% overall is ‘smaller rural nearer to a medium town or city’ at 73% (85 LSOAs)
- the category with the lowest percentage of areas in the least deprived 50% overall is ‘urban: further from a medium town or city’ at 38% (25 LSOAs)
- for rural LSOAs, 59% (330 out of 561) are in the least deprived 50%
| LSOA | Local authority | RUC | WIMD 2025 rank |
|---|---|---|---|
| Twyn Carno 1 | Caerphilly | Larger rural: nearer to a medium town or city | 12 |
| Cymer (Neath Port Talbot) 2 | Neath Port Talbot | Smaller rural: nearer to a medium town or city | 15 |
| New Tredegar 3 | Caerphilly | Larger rural: nearer to a medium town or city | 56 |
| Denbigh Upper and Henllan 1 | Denbighshire | Larger rural: nearer to a medium town or city | 57 |
| Moriah 3 | Caerphilly | Larger rural: nearer to a medium town or city | 76 |
| Pembroke: Monkton | Pembrokeshire | Larger rural: further from a medium town or city | 83 |
| Cardigan Teifi | Ceredigion | Larger rural: further from a medium town or city | 90 |
| Pembroke Dock: Llanion 1 | Pembrokeshire | Larger rural: further from a medium town or city | 92 |
| Gwynfi | Neath Port Talbot | Larger rural: nearer to a medium town or city | 103 |
| Bettws (Bridgend) | Bridgend | Larger rural: nearer to a medium town or city | 138 |
| Darren Valley 2 | Caerphilly | Smaller rural: nearer to a medium town or city | 168 |
| Crumlin 3 | Caerphilly | Larger rural: nearer to a medium town or city | 177 |
The table shows that:
- the 12 most deprived rural LSOAs are spread across 6 local authorities
- the most deprived rural LSOA is Twyn Carno 1 in Caerphilly, ranked 12th most deprived LSOA in WIMD 2025
- Caerphilly has the most rural LSOAs in the top 10% most deprived areas in Wales (5), followed by Neath Port Talbot and Pembrokeshire (2)
- out of the 12 most deprived rural areas 10 are larger rural areas, 7 of these are in the ‘larger rural: nearer to a medium town or city’ category
Figure 3: map of rural LSOAS in the most deprived 10% across Wales
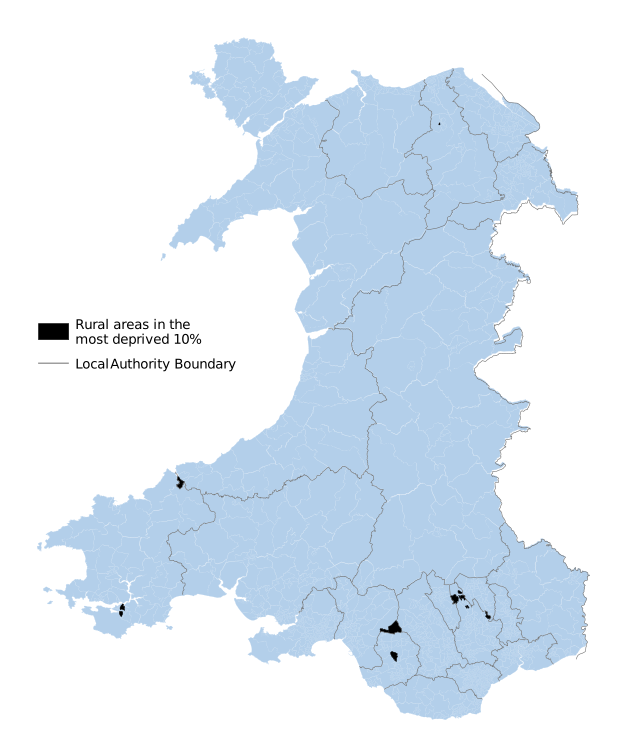
Description of figure 3: a map showing the 12 rural LSOAs that rank in the top 10% most deprived for WIMD 2025.
Figure 4: maps of rural LSOAS in the most deprived 10%, close ups for north, west and south Wales
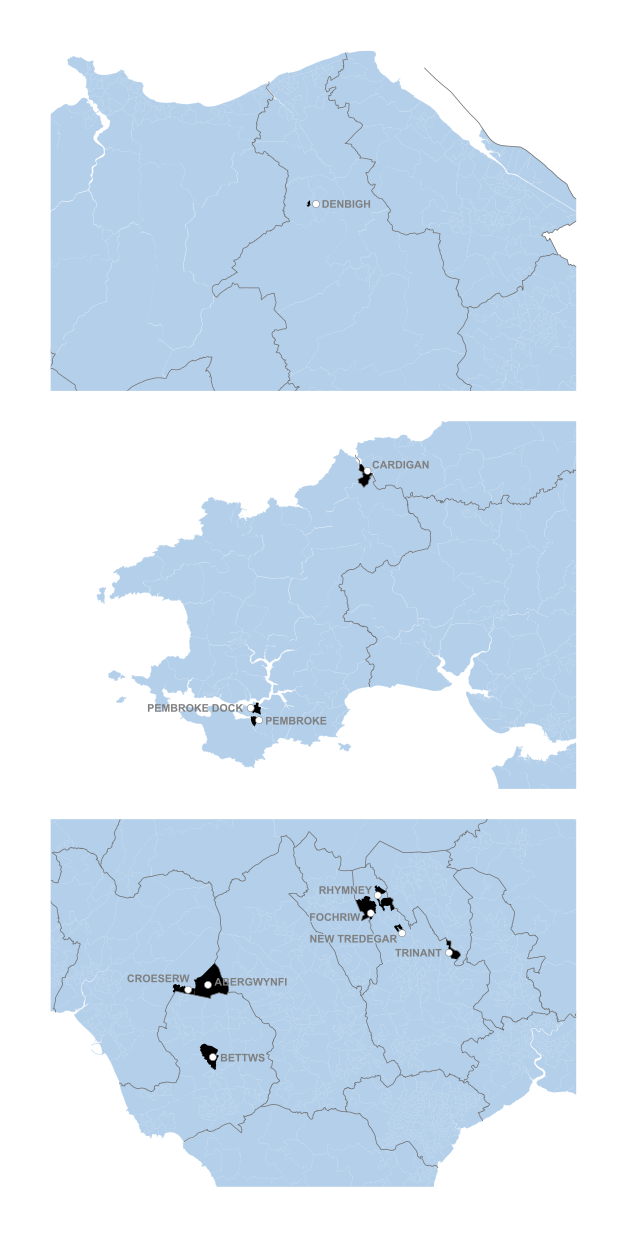
Description of figure 4: a map showing the 12 rural LSOAs that rank in the top 10% most deprived for WIMD 2025.
Figure 5: percentage of rural LSOAs in most deprived 10% in each domain of WIMD 2025
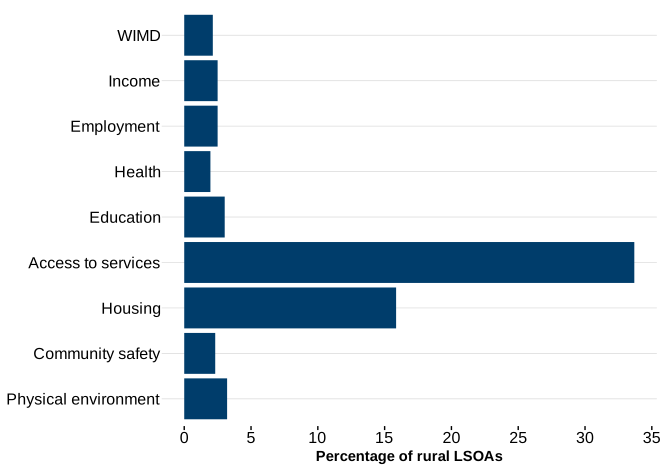
Description of figure 5: a bar chart showing that the share of rural LSOAs in the most deprived 10% by WIMD domain varies from 2% to 34%.
Analysis of the data shows that:
- a third of rural LSOAs (34%) are in the most deprived 10% in the access to services domain (189 LSOAs)
- for the housing domain 16% of rural LSOAs are in the most deprived 10% across Wales (89 LSOAs)
- for all other domains between 2% and 3% of rural LSOAs are in the most deprived 10% across Wales
Income domain
The purpose of the income domain is to measure the proportion of people experiencing deprivation relating to low income. The income domain has a relative weight of 22% in WIMD 2025.
The income domain is a cross-sectional snapshot of people in receipt of income-related benefits and tax credits and supported asylum seekers. It involves non-overlapping counts of means-tested claimants: both those that are out-of-work, and those that are in work, but who have low income. The summed counts are then expressed as a percentage of the estimated total population for the LSOA.
More information on the income domain is in the WIMD 2025 technical report.
| RUC | Income deprivation (% of population) |
|---|---|
| Larger rural: further from a medium town or city | 25 |
| Larger rural: nearer to a medium town or city | 23 |
| Smaller rural: further from a medium town or city | 17 |
| Smaller rural: nearer to a medium town or city | 16 |
| Urban: further from a medium town or city | 28 |
| Urban: nearer to a medium town or city | 27 |
| Wales | 25 |
The table shows that:
- the ‘smaller rural’ categories have the lowest proportions of their population in income deprivation, and the urban categories have the highest
- for each settlement type, on average the areas that are further from a medium town or city have slightly higher rates of income deprivation than those that are nearer to a medium town or city
Figure 6: percentage of income deprived population by LSOA RUC
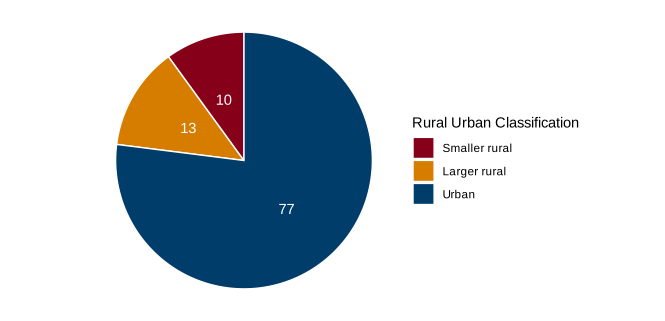
Description of figure 6: a chart showing the proportion of the overall income deprived population that lives in each of the RUC.
Out of all income deprived people in Wales:
- 77% lived in urban areas
- 13% lived in larger rural areas
- 10% lived in smaller rural areas
Figure 7: box plot of percentage of population in income deprivation by LSOA RUC
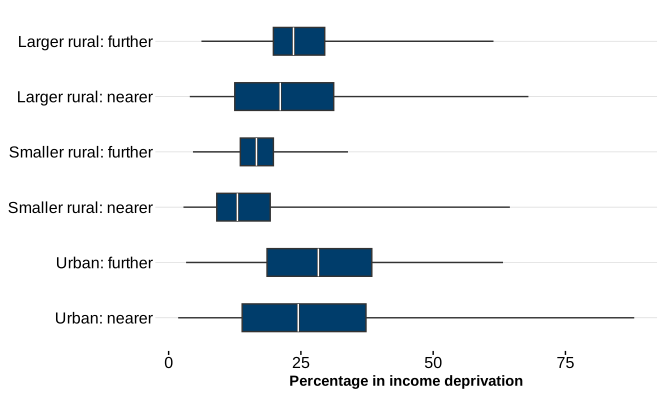
Description of figure 7: the chart shows the spread of rates of income deprivation for LSOAs within each rural urban category. The blue boxes contain values for half of the small areas (LSOAs) in each category, centred on the median (middle) rate of income deprivation for each category, and the ‘whiskers’ show the full range of rates of income deprivation within the category. A narrow box and range suggests that rates of income deprivation are similar for LSOAs within a category. A wider box and range means that the rates of income deprivation vary considerably within the category.
The chart shows that variation in rates of income deprivation by LSOA is largest in urban categories and the ‘larger rural: nearer to a medium town or city’ category and much lower in LSOAs in the small rural categories.
Access to services domain
The purpose of this domain is to capture deprivation as a result of a household’s inability to access a range of services considered necessary for day-to-day living, both physically and online. This covers both material deprivation (for example, not being able to get food) and social aspects of deprivation (for example, not being able to attend after school activities). The domain has a relative weight of 10% in WIMD 2025.
More information on the access to services domain and indicators is in the WIMD 2025 technical report.
Figure 8: access to services deprivation profile by LSOA RUC
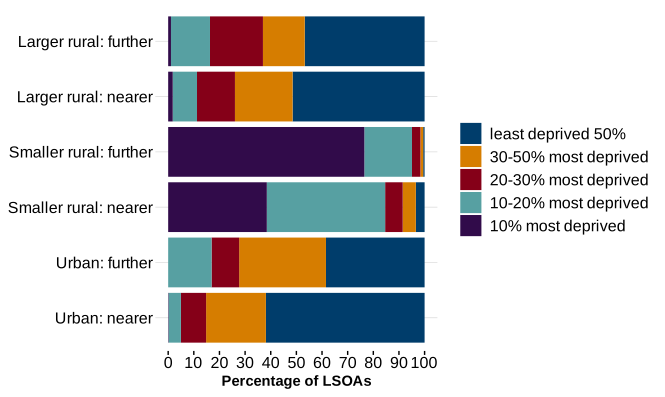
Description of figure 8: a bar chart showing the share of small areas in different access to services deprivation groups, by RUC with smaller rural categories having the highest proportion of small areas in the most deprived 10% of LSOAs in Wales.
Analysis of the data also shows that:
- three quarters (77%) of LSOAs classified as ‘smaller rural: further from a medium town or city’ are in the most deprived 10%, 95% are in the most deprived 20%, and only 1 LSOA is in the least deprived half
- for areas classified as ‘smaller rural: nearer to a medium town or city’, 38% were in the most deprived 10% of LSOAs for the access to services domain and 85% in the most deprived 20%
- there are no LSOAs in the ‘urban: further from a medium town or city’ category (and fewer than 2% of LSOAs in any other larger rural or urban category) in the most deprived 10%
As well as analysing data for the overall domain, we can analyse data for individual access to services indicators by RUC. An example is provided below for travel time to nearest childcare provider by public transport, which was a new indicator for WIMD 2025. The relative patterns (between the RUC categories) for travel time to the nearest childcare provider by private transport are very similar to those for public transport.
| RUC | Average return travel time in minutes |
|---|---|
| Larger rural: further from a medium town or city | 14 |
| Larger rural: nearer to a medium town or city | 14 |
| Smaller rural: further from a medium town or city | 93 |
| Smaller rural: nearer to a medium town or city | 32 |
| Urban: further from a medium town or city | 14 |
| Urban: nearer to a medium town or city | 12 |
| Wales | 27 |
The table shows that:
- the urban and larger rural areas have broadly similar average travel times (between 12 and 14 minutes) by public transport to nearest childcare provider, while the smaller rural areas have considerably higher average travel times
- the longest average travel time was 93 minutes for the ‘smaller rural: further from a medium town or city’ category
Figure 9: box plot of average travel time by public transport to nearest childcare provider by LSOA RUC
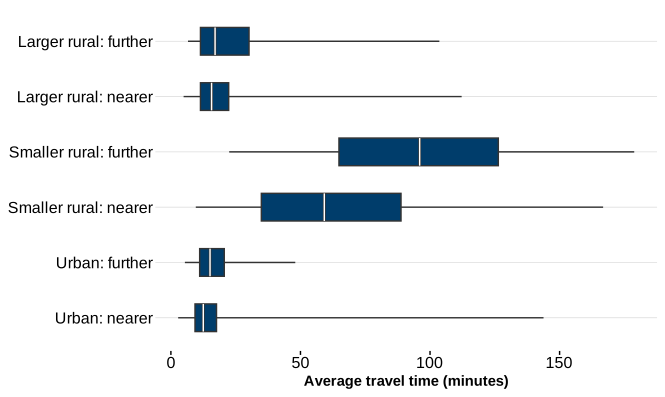
Description of figure 9: the chart shows the spread of return travel times by public transport to childcare providers for LSOAs within each rural urban category. The chart displays higher travel times and greater levels of variation for the smaller rural areas, whether nearer or further from a medium town or city.
Housing domain
The purpose of the housing domain is to identify inadequate housing, in terms of physical and living conditions and availability. Here, living condition means the suitability of the housing for its inhabitant(s), for example in terms of health and safety, and necessary adaptations. The domain has a relative weight of 9% in WIMD 2025.
The housing domain has 2 equally weighted sub-domains, housing availability and housing conditions, with 2 equally weighted indicators each.
The housing availability sub-domain contains indicators of:
- overcrowding: the percentage of households that are overcrowded (bedroom measure)
- inability to afford to enter owner occupation or the private rental market (this indicator is made up of 4 sub-components)
The housing conditions sub-domain contains indicators of:
- poor quality: the likelihood of housing being in disrepair or containing serious hazards, for example, risk of falls or cold housing (this indicator is made up of 2 sub-components)
- energy efficiency
More information on the housing domain and indicators is in the WIMD 2025 technical report.
Figure 10: housing deprivation profile by LSOA RUC
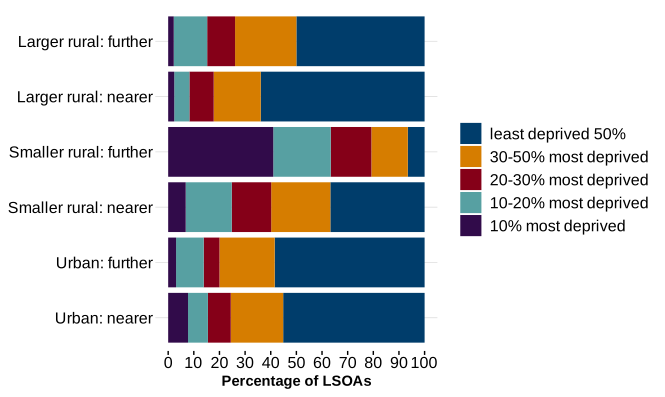
Description of figure 10: a bar chart showing the share of small areas in different housing deprivation groups, by RUC.
For the housing domain:
- the category with the highest proportion of its LSOAs in the most deprived 10% is ‘smaller rural: further from a medium town or city’ at 41%
- both ‘smaller rural’ categories have above average shares of their areas in the most deprived 20%, at 63% for those further from, and 25% for those nearer to a medium town or city, this is driven by the housing conditions indicators
- in the ‘urban: nearer to a medium town or city’ category 15% of LSOAs are in the 20% most deprived, driven by the housing availability indicators
As well as analysing data for the overall domain, we can analyse data for individual indicators by RUC, using the dataset on StatsWales. Below, we have chosen one indicator from the housing conditions sub-domain and one from the housing availability sub-domain for further analysis to give an indication of the type of analysis available.
Figure 11: selected housing domain indicators by LSOA RUC
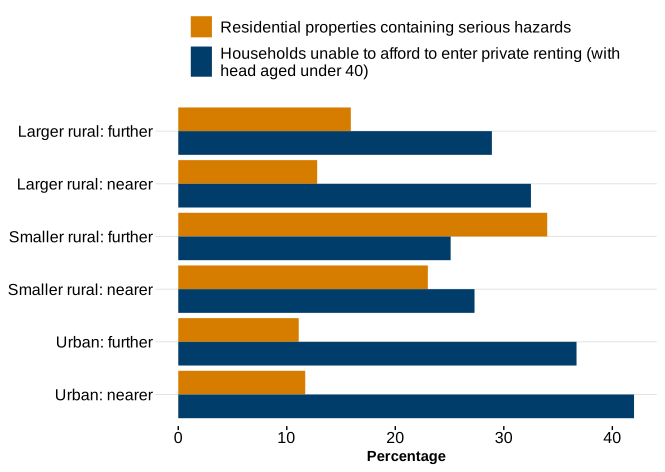
Description of figure 11: a bar chart showing indicator estimates for selected housing domain indicators in each RUC.
Analysis of the data shows that:
- for the housing availability sub-domain (which includes the overcrowding indicator and affordability sub-components), the rural categories generally show slightly lower levels of deprivation than all the urban categories
- the difference is most notable for younger households unable to afford to enter private renting: the proportion varies from 25% in the ‘smaller rural: further from a medium town or city’ category to 42% in the ‘urban: nearer to a medium town or city’ category likely due to higher rents in urban areas
- for the housing conditions sub-domain indicators or sub-components, the rural categories have a higher level of deprivation than the urban categories, except for the disrepair sub-component which is between 2% and 3% for both
Quality and methodology information
Further information on WIMD 2025 quality is provided in the background information section of the WIMD 2025 results report, and the methodology is described in detail in the technical report.
2021 RUC methodology
The 2021 RUC classifies areas based on:
- address density
- physical settlement form
- population size
- relative access to medium towns and cities
The method groups nearby Built Up Areas (BUAs) into larger Amalgamated BUAs (ABUAs). ABUAs with a population of 10,000 or more are classed as Urban, while those with fewer than 10,000 people are classed as Rural. Areas outside BUAs are mostly classified based on density of addresses. However, the classification also considers factors such as housing density, population size, whether an area overlaps a BUA, and how easily it can be reached (using travel times) to distinguish different types of rural areas.
In the 2021 RUC, relative access is assessed through estimates of travel time by car to major urban centres with a population of 75,000 or more. In this article, a population threshold for a medium town or city of 25,000 has instead been used. Stakeholders that we asked agreed that this lower threshold better represented the local context in Wales and recognised the importance of urban settlements with smaller populations in acting as hubs for nearby settlements.
While the 75,000 population threshold captures Cardiff, Newport and Swansea, the following additional settlements are classed as urban centres using a 25,000 population threshold:
- Aberdare
- Barry
- Bridgend
- Caerphilly
- Colwyn Bay
- Cwmbran
- Llanelli
- Merthyr Tydfil
- Neath
- Penarth
- Pontypool
- Pontypridd
- Port Talbot
- Rhyl
- Wrexham
It is important to note that the classification system focuses exclusively on physical settlement characteristics and relative accessibility by road. It does not account for economic, social, historical, or cultural elements contributing to rural or urban identity. Users should be aware that the categories are a tool to enable statistical analysis of trends affecting geographies with similar urban or rural settlement morphologies and similar levels of relative access. This does not mean that all areas within each category are identical, nor is this intended to be a definitive classification.
RUC settlement types for LSOAs in Wales can be found in table 1B of the supplementary tables on the 2021 Rural Urban Classification webpage (ONS). Relative access categories (25,000 population threshold) can be found in table 5A.
Detailed methodological information can be found in the Rural-Urban Classification User Guide on the ONS open geography portal.
Notes on the use of statistical articles
Statistical articles generally relate to one-off analyses for which there are no updates planned, at least in the short-term, and serve to make such analyses available to a wider audience than might otherwise be the case. They are mainly used to publish analyses that are exploratory in some way, for example:
- introducing a new experimental series of data
- a partial analysis of an issue which provides a useful starting point for further research but that nevertheless is a useful analysis in its own right
- drawing attention to research undertaken by other organisations, either commissioned by the Welsh Government or otherwise, where it is useful to highlight the conclusions, or to build further upon the research
- an analysis where the results may not be of as high quality as those in our routine statistical releases and bulletins, but where meaningful conclusions can still be drawn from the results
Where quality is an issue, this may arise in one or more of the following ways:
- being unable to accurately specify the timeframe used (as can be the case when using an administrative source)
- the quality of the data source or data used
- other specified reasons.
However, the level of quality will be such that it does not significantly impact upon the conclusions. For example, the exact timeframe may not be central to the conclusions that can be drawn, or it is the order of magnitude of the results, rather than the exact results, that are of interest to the audience.
The analysis presented does not constitute an official statistic, but may be based on official statistics outputs, and we have applied the principles of the Code of Practice for Statistics as far as possible during development. An assessment of the strengths and weaknesses in the analysis will be included in the article, for example comparisons with other sources, along with guidance on how the analysis might be used, and a description of the methodology applied.
Articles are subject to the release practices as defined by the release practices protocol, and so, for example, are published on a pre‑announced date in the same way as other statistical outputs.
Contact details
Social Justice Statistics
Email: stats.inclusion@gov.wales
Media: 0300 025 8099