
Supply, use and input-output tables: 2022 methodology
The tables provide a snapshot of the Welsh economy in 2022, showing the flows of goods and services across all sectors.
In this page
Overview
What this report is about
This report sets out the methods and data sources used to produce the 2022 Supply and Use Tables (SUTs) and Input‑Output Table (IOT) for Wales.
These tables provide a snapshot of the Welsh economy, showing how goods and services flow between Welsh industries, the rest of the UK, and the rest of the world.
This article is intended for analysts and users who want to understand how the SUTs and IOTs are compiled, where the main strengths and limitations lie, and how the results should be interpreted.
What we publish
We publish 4 datasets on StatsWales, including:
- a supply table at basic prices, with a transformation to purchasers’ prices (StatsWales)
- a use table at purchasers’ prices (StatsWales)
- an industry-by-industry input-output table (StatsWales)
- indicative economic multipliers (StatsWales)
All tables are also available in OpenDocument Spreadsheet (ODS) format.
How these tables compare with earlier releases
This is the second set of tables we have produced. They are not directly comparable with the 2019 release because we have made significant changes to the methods, data sources and presentation.
What you need to know about data quality
These tables are designated as official statistics in development (Office for Statistics Regulation). This reflects our ongoing work to develop the methods and engage with users.
Main limitations
- Some parts of the tables use UK-level patterns where Wales-specific data are not currently available, including production functions for non-manufacturing industries.
- Some estimates are more uncertain than others, particularly imports, which rely on simplifying assumptions about supply chains.
- Some business surveys do not cover parts of the Welsh economy, so we use apportionment methods and additional data sources where needed.
The tables are best used for analysing the economy or sectors as a whole, rather than individual transactions.
For suggestions or advice on how to use the tables or multipliers, email inputoutputtables@gov.wales.
Acknowledgements
We would like to thank Professor Calvin Jones for his ongoing support in developing these tables.
Supply and use tables
Structure of the supply table
The supply table shows where products are produced.
The core of the supply table is a product by industry matrix, which records the products produced domestically by each industry.
For disclosure control purposes, the published table summarises this information in a single column showing the total domestic supply of each product at basic prices. It excludes taxes on products and includes subsidies on products.
The supply table also includes estimates of imports by product, and valuation columns showing taxes less subsidies on products and distributors' trading margins. These valuation columns show the adjustments needed to convert supply at basic prices to supply at purchasers' prices.
Figure 1: structure of the supply table
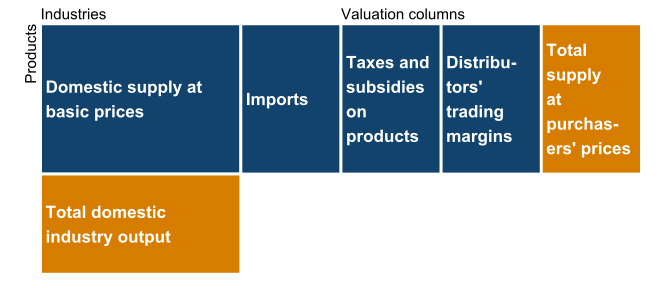
Description of figure 1: a diagram showing the structure of the supply table. The columns show the value of domestic supply by product, imports, taxes less subsidies on products, and margins. Together, these components equal total supply at purchasers' prices.
Structure of the use table
The use table shows how products are used.
Industries use a range of products as part of their production processes. This activity is known as intermediate consumption.
Households, government and the non profit sector purchase products for final use. This is known as final demand. In the supply-use framework, final demand also includes products used for capital formation (investment) and exports.
Intermediate consumption and final demand are initially presented at purchasers’ prices, consistent with the amounts paid by users. Product taxes are included and product subsidies are excluded.
The use table also includes an adjoining block, showing the components of gross value added by industry. These show how much of each industry's output is accounted for by compensation of employees, taxes less subsidies on production, and other value added. Together, they show how industries generate value beyond the cost of their intermediate inputs.
Figure 2: structure of the use table
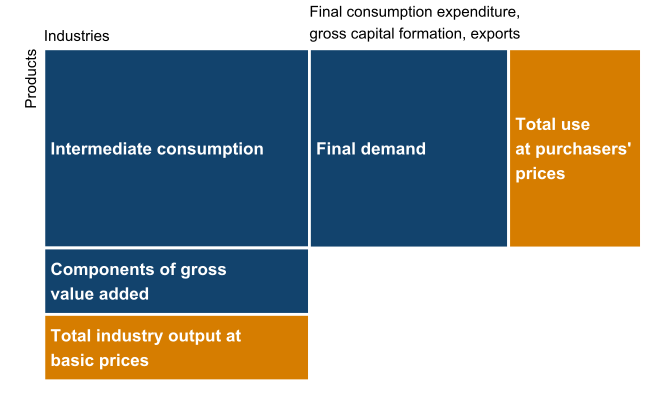
Description of figure 2: a diagram showing the basic structure of the use table. The upper left quadrant shows the use of products by industry, with products in rows and industries in columns. The bottom left quadrant shows the components of gross value added by industry. The upper right quadrant shows final demand for each product. The columns sum to total industry output at basic prices, and the rows sum to total use of products at purchasers’ prices.
When the supply and use tables are balanced, the total supply of each product at purchasers’ prices (the right-hand column of the supply table) equals the total use of that product at purchasers’ prices (the right-hand column of the use table).
Industry and product classifications
Both the supply and use tables are compiled in a product by industry format.
They are built using the same level of detail as the 2019 tables: 64 products (aggregated from the 2-digit CPA 2.1 (ONS) classification) and 64 corresponding industries (aggregated from the 2-digit SIC 2007 (ONS) classification). Our 2019 methodology article describes the rationale for selecting this breakdown.
These 64 industry groups mirror the NACE Rev.2 A64 industrial structure (Eurostat) with one exception. We group the sewerage industry (E37) and its associated product with ‘Water collection, treatment and supply’ (E36), rather than with ‘Waste collection, treatment and disposal activities’ (E38 and E39). This reflects the practical difficulty of separating water treatment and sewerage functions within Wales’ 2 water supply companies.
We aggregate some products and industries in the published tables to ensure no individual business can be identified and to address any outstanding concerns about data quality. The published tables therefore cover 58 products and industries.
We provide a full mapping of products and industries in the accompanying ODS spreadsheet.
Components of gross value added
What is gross value added
Gross value added (GVA) represents the value generated by each industry. It is an important component of the Welsh Government’s supply-use framework because it anchors the estimates of both industry output and intermediate consumption.
This section explains how we estimate three components of GVA for each of the 64 industries. These components include:
- compensation of employees (employee salaries and employers’ social contributions)
- taxes less subsidies on production (for example, non‑domestic rates)
- other value added, used here to refer mainly to gross operating surplus (profits) and mixed (self-employment) income
Regional GVA data
ONS publishes balanced estimates of GVA for Wales at 2-digit SIC level. We aggregate these to match our industry classification. These are the starting point for each industry’s production structure.
For 17 of the 64 industries, ONS also publishes estimates of the income components of GVA.
For the remaining 47 industries, we estimate the components ourselves by disaggregating the elements of the wider sector, using a combination of Welsh and UK data on wages, employment and taxes less subsidies ratios.
We estimate compensation of employees (CoE) first for 3 reasons:
- it is typically the largest component of GVA across most industries
- labour data at sub national level are more reliable than other GVA components
- CoE plays an important role in multiplier analysis
Estimating compensation of employees (CoE)
- We estimate full time equivalent employment for the 64 industries using data from the ONS Business Register and Employment Survey.
- We use UK mean weekly wages from the ONS Annual Survey of Hours and Earnings to represent wage levels for each industry, as Welsh estimates are not reliable at this detail.
- For each industry, we multiply estimated Welsh employment by the UK mean gross weekly wage to produce an initial proxy estimate of CoE.
- These proxy estimates are not used directly; instead, we constrain them to the ONS CoE totals for the relevant broader industry groups.
- We then distribute the constrained ONS CoE totals across the 64 industries using the wage-weighted estimates derived from both surveys.
Initial estimates sometimes produce CoE to GVA ratios that are implausibly high when compared with UK benchmarks, or even greater than one.
To address this, we apply the same constraining rule used for the 2019 tables. An adjustment is made when (all the following apply):
- the Wales CoE to GVA ratio is higher than the highest ratio reported in the UK IOT (89.8% in 2022)
- the Wales ratio exceeds the equivalent ratio in the UK IOT by more than 10 percentage points
Where an industry meets both conditions, we reduce the CoE estimate so that the revised ratio becomes the midpoint between the initial Welsh and UK ratios. Any ‘surplus’ CoE released by this adjustment is reallocated to other industries within the same broader industry group.
We apply this constraining rule until no industry breaches the criteria (3 iterations were required for 2022).
This approach reduces the influence of potentially unreliable estimates but may dampen genuine differences between the Welsh and UK industrial structures in some sectors.
Estimating other components of GVA
Taxes less subsidies on production
For industries where ONS publishes income component data for the same industry group, we use the ONS values directly.
For all other industries, we estimate taxes less subsidies on production using ratios from the UK IOT, while constraining totals to the ONS figures for Wales for each broader industry group.
Other value added
We calculate other value added by subtracting compensation of employees and taxes less subsidies on production from total GVA.
Special treatment of agriculture
Agriculture is treated separately because high quality Welsh data exist outside the UK regional accounts system.
We adopt compensation of employees and GVA estimates from the Welsh Government’s Aggregate agricultural output and income release.
Farm subsidies in 2022 (£283 million), mainly from the Basic Payment Scheme and Glastir, are treated as subsidies on production rather than subsidies on products. This is because they are largely no longer linked to the quantity of output being produced. This means they reduce GVA at basic prices in addition to GDP. This treatment aligns with the classification used in the Welsh Government’s Aggregate agricultural accounts.
We then derive other value added as the residual.
Special treatment of financial services
We also apply bespoke methods to the insurance sector (K65) using data from a leading insurance company’s annual accounts. This results in Welsh GVA estimates that are lower than the corresponding ONS regional accounts estimates.
Further details are provided in the industry output section.
Consistency with regional accounts
In general, we carry these GVA estimates through to the final IOT without further adjustment. During balancing, we give this part of the table greater weight because the estimates are already balanced within the ONS regional accounts framework.
There are, however, some exceptions. Agriculture and financial services are the main examples, but other industries may also show small differences where the balancing process reveals sufficiently strong evidence to depart from the ONS estimates.
This includes the 4 industries with substantial public sector activity:
- public administration and defence (O)
- education (P)
- human health activities (Q86)
- residential care and social work activities (Q87 and Q88)
We made some reallocations between these 4 industries during the 2022 balancing process, reflecting our judgement that government expenditure data provide stronger evidence on the use side than top-down supply side estimates.
We also review CoE shares again during balancing to ensure they remain consistent with industry evidence on pay.
Industry output
What is output
Output represents the value of all goods and services produced by an industry.
It is similar to business turnover, but not identical. Output also includes the value of products produced but not yet sold, including work in progress, and excludes goods sold that come from inventories built up in previous periods. Unlike turnover, output also excludes the value of products purchased and resold without further processing, an issue that is particularly important in the distribution sector.
Economic output is not published for UK countries or ITL1 regions in a form that meets System of National Accounts (United Nations) standards. UK SUTs provide this information only at a UK level.
Data gaps and survey design issues also affect the quality of some industry-level evidence.
We therefore supplement survey data with bottom up industry sources, such as financial accounts, where these are considered more accurate or reliable.
Annual Business Survey estimates
The ONS Annual Business Survey (ABS) is an important sample survey which collects financial data across most business sectors in Great Britain.
We estimate output for Welsh industries primarily by applying ratios derived from the ABS to our existing estimates of industry GVA.
Sub-GB, weighted ABS results are not available for the variables required to estimate output. While Welsh firms are sampled within the ABS, both the lack of a Wales-representative sampling stratum, and non response bias might affect the resulting estimates.
We therefore derive a GVA‑to‑output ratio from ABS returns and apply this ratio to the previously estimated GVA to produce an estimate of industry output.
We review each result by industry, comparing these with the UK SUTs, Scotland SUTs, workforce data, and time series trends to assess plausibility and to identify unusual ratios.
Where ABS data is limited, we use ratios from the UK SUTs, including for the public administration and financial services sectors, which are not fully covered by the survey.
Industries with bespoke output estimates
For some industries, we depart from the ABS-based approach.
A01: Agriculture and hunting
Agriculture benefits from several long running sector data sources. This includes the Farm Business Survey (Aberystwyth University) and the Welsh Government’s Survey of agriculture and horticulture, which provide information on livestock, land and other inputs, as well as the industry’s outputs.
As with GVA, our primary source for estimating output in this sector is therefore the Welsh Government’s Aggregate agricultural output and income release.
A02: Forestry and logging
Natural Resources Wales (NRW) is the dominant operator in the forestry and logging sector in Wales, although much of the harvesting activity is contracted out.
We estimate industry output using timber sales reported in NRW’s annual report and accounts, and add private sector softwood removals using data on UK grown timber (Forest Research).
To reflect that forestry output includes products beyond roundwood, we adopt principal product shares from the Scottish Government’s supply table (77%). We consider this more appropriate than the UK table, as it more closely reflects Welsh sector composition. The remaining 23% of output is assumed to be secondary production – goods that are not forestry products.
This approach provides an initial output estimate. However, the resulting GVA to output ratio was unusually low.
To address this, we set other value added to zero, reflecting that forested public land in Wales is managed to achieve the sustainable management of natural resources (Natural Resources Wales) rather than to maximise income or economic surplus.
C24: Manufacture of basic metals
The steel and basic metals industry in Wales is dominated by a few large firms. This makes a bottom up estimation approach feasible.
We estimate output using turnover data reported by these firms to Companies House. Information from the Business Register and Employment Survey is combined with employment information from annual accounts to estimate the share of each firm’s activity taking place in Wales. We then apply this share to their turnover linearly.
The combined turnover of the firms provides our estimate of industry output, although a true measure of output would also account for changes in inventories and work in progress.
C30: Manufacture of other transport equipment
A major aircraft parts manufacturer operates in Wales. We use Companies House data to capture the firm’s UK turnover and estimate the Welsh plant’s output using the company’s Welsh to UK employment ratio.
Output from other businesses operating in the sector is represented using ABS data, which are added to produce the complete industry estimate.
E36 and E37: Water supply and sewerage activities
We use turnover data for the two water supply companies operating in Wales, taken from their reports submitted to Companies House.
We do not account for work in progress due to the absence of suitable data.
H51: Air transport
We apply the output to GVA ratio for the wider UK transport sector to Welsh GVA. The corresponding ratio for the UK air transport sector cannot be used directly because UK air transport output includes the activities of airlines headquartered outside Wales. Wales has no headquartered airlines, and the output of non-Welsh airlines should not generally be allocated to Wales in a regional production framework.
We make further adjustments to the transport sector’s GVA components during balancing.
K65: Insurance and pension funding
We estimate output using data from the annual accounts of the dominant firm in the sector, and scale the results using the Wales to company employment ratio.
The same approach is applied to annual accounts-reported wages, profits, taxes and output to produce separate GVA component estimates, which replace the previously derived values.
This approach results in Welsh GVA estimates that are lower than the ONS figure.
Industries using UK GVA to output ratios
Some industries lack ABS coverage, and for a small number the Welsh specific ratios appear implausible. In these cases, we apply the relevant GVA to output ratios from the UK SUTs.
This applies to:
- financial service activities (K64)
- auxiliary financial services (K66)
- owner-occupiers' imputed rental (L68A)
- real estate activities (excluding imputed rental) (L68B)
- public administration and other public services (O84 to Q88)
- creative, cultural, entertainment and gambling activities (R90 to R92)
- activities of households as employers (T97)
Intermediate consumption
What is intermediate consumption
Intermediate consumption refers to the goods and services that industries purchase to produce outputs.
The relationship between output and intermediate consumption
We begin by deriving each industry's total intermediate consumption. In the national accounts framework, this is defined (at purchasers’ prices) as the difference between output and GVA.
Since both output and GVA have been estimated in earlier steps, this accounting identity determines the column totals for the intermediate consumption matrix. We then allocate each industry's intermediate consumption across products using evidence from the ONS Annual Purchases Survey.
This survey is designed to capture firms’ intermediate consumption and provides the product-level purchase proportions required to allocate each industry’s total across the 64 product groups.
Estimating intermediate consumption
We first map Annual Purchases Survey data to the Welsh industry classification by matching each business to the relevant industry, and each purchase to the corresponding product.
We then aggregate the data into a product by industry matrix that shows, for each industry, the relative share of spending on different products.
A small number of industries are not covered by the survey. In such cases, we adopt product purchase shares from the UK use table.
We then scale these product purchase shares so that total spending by industry matches the intermediate consumption estimates derived earlier from GVA and output.
The result is a complete 64-by-64 product by industry intermediate consumption matrix. This forms the top left quadrant of the use table.
Household final consumption expenditure
What is household final consumption expenditure
Household final consumption expenditure (HFCE) represents the value of final goods and services consumed by Welsh households.
Data sources
The ONS Regional Household Final Consumption Expenditure (RHFCE) release is the main source for the HFCE estimate in the 2022 tables. RHFCE provides regional totals that are consistent with the UK national accounts.
This is an improvement on the 2019 methodology, which relied solely on the ONS Living Costs and Food Survey. While this survey remains an important input into national RHFCE estimates, these new estimates incorporate a wider set of data sources.
Total HFCE recorded at basic prices is substantially higher than in the 2019 IOT:
- £57,624 million in 2022
- £38,310 million in 2019
On a per head basis, this implies that Wales contributed 4.1% of total UK HFCE in 2022.
Given that Welsh household incomes were 82.3% of the UK average (StatsWales), and taking account of a lower savings ratio in Wales, the 2022 figures are more consistent with available evidence on Welsh household incomes and saving behaviour than those in the 2019 table.
The ‘national’ and ‘domestic’ concept
The ONS publishes household consumption estimates using both:
- the national concept: consumption by Welsh residents, wherever the spending takes place (including elsewhere in the UK and overseas)
- the domestic concept: spending taking place within Wales, regardless of the purchaser’s residency
We use the national concept as the starting point, then treat spending by Welsh residents outside Wales as imports and spending in Wales by non residents as exports.
RHFCE is published using the Classification of Individual Consumption according to Purpose (COICOP) and must be mapped to CPA products for use in the tables. We use the ONS CPA-COICOP converter to achieve this.
Treatment of spending inside and outside Wales
To allocate household consumption correctly, the SUTs must distinguish between:
- outbound spending by Welsh residents on visits to the rest of the UK and overseas (treated as imports)
- inbound spending in Wales by visitors from the rest of the UK and overseas (treated as exports)
International visitor spending
RHFCE provides inbound international visitor spending totals by product, based on ONS International Passenger Survey data. These data also allow us to derive outbound international spending by Welsh residents.
Domestic (intra‑UK) visitor spending
Spending by Welsh residents visiting other parts of the UK is estimated using:
- spending totals for Welsh resident visitors from the VisitBritain Great Britain Tourism Survey for day and overnight trips (excluding Northern Ireland)
- spending patterns from the ONS UK Tourism Satellite Account (TSA) to allocate total spending across products
This outbound spending is already included in national HFCE but is also recorded as an import so that expenditure is allocated to its place of consumption.
We estimate inbound visitor spending in Wales using Great Britain Tourism Survey data on day and overnight visits to Wales.
Spending by non-resident visitors to Wales is not included in HFCE. It appears in a separate column of the use table alongside exports.
Direct imports by households, including online purchases or digital content delivered by suppliers outside Wales, are discussed separately in the section on imports.
Government final consumption expenditure
What is government final consumption expenditure
Government final consumption expenditure represents the value of goods and services provided by government for the benefit of society and households.
Within the SUT framework, government is treated as the final consumer of 2 types of output:
- non market output: services such as education, health, social care and public administration that are provided by government without charging economically significant prices
- social transfers in kind: market services and goods that government purchases from market producers and provides directly to households
Our aim is to produce Welsh specific estimates for the CPA product groups in the government final consumption column of the use table.
Unlike household consumption, government final consumption expenditure is concentrated in a relatively small number of service based CPA products.
Data sources and estimation methods
The estimates draw on a combination of UK and Welsh public finance sources. These include:
- HM Treasury’s Country and Regional Analysis
- ONS Country and Regional Public Sector Finances tables
- Welsh Government budget documents
- local authority outturn data (StatsWales)
- selected administrative datasets (such as the BBC Annual Report and Accounts)
Public spending is reported by function under the Classification of Functions of Government, while the use table classifies spending by product using CPA. We therefore map each function to the corresponding CPA product. Only items representing final consumption are retained; non consumption elements such as debt interest payments are omitted.
Although the largest products – education, health, social care and public administration – dominate government consumption expenditure, we apply the same mapping principles across all CPA products with non zero values in the UK use table’s government column.
In a previous step, we estimated government output (non-market output) using UK GVA-to-output ratios. In this step, we estimate government expenditure directly from expenditure data. The balancing process reconciles differences between the 2 approaches. For future tables, we will consider whether expenditure data could also be used to inform supply-side estimates for the public sector.
Non-profit institutions serving households final consumption expenditure
What are NPISH
Non profit institutions serving households (NPISH) are organisations that provide goods and services to individuals either free of charge or at prices that are not economically significant. They operate independently of government and do not primarily seek to generate a profit. Examples include:
- charities
- trade unions
- political parties
- some educational institutions
NPISH is treated as a separate institutional sector in the national accounts because its production, financing and consumption patterns differ from those of both market producers and general government.
This section describes how we estimate NPISH final consumption expenditure for the use table.
Approach to estimating NPISH final consumption expenditure
Information on the final consumption of the NPISH sector is limited for Wales, as it is for other devolved nations.
Our approach remains largely unchanged from that used in the 2019 tables.
Education
We directly estimate the largest component of the NPISH column – education services – using 2 elements.
First, expenditure by Welsh universities is estimated using financial data from the Higher Education Statistics Agency. To approximate spending during the 2022 calendar year, we take a weighted average of expenditure from the 2021 to 2022 and 2022 to 2023 academic years.
The second element relates to education provided by the independent school sector in Wales. These estimates draw on Welsh Government data on pupil numbers and the number of boarding pupils from the Independent School Census, combined with average term time fee data from the Independent Schools Council Annual Census. As with the university estimates, we apply a weighted average across academic years to align with the calendar year.
In the absence of suitable expenditure data, we use estimated fee income as a proxy for independent schools’ spending on education services. As most independent schools operate as charities, we assume that fee income funds educational provision and is therefore the best available indicator of output.
Other consumption products
For NPISH consumption in Wales outside education, we allocate the non-education entries in the NPISH column of the UK use table in proportion to Wales's share of UK households.
We calculate this share using the 2021 Censuses for England, Wales and Northern Ireland and the 2022 Census for Scotland. This approach implicitly assumes that the pattern of NPISH activity in Wales mirrors that of the UK overall for non-education products.
Further work may help identify additional data sources to support more detailed estimates for other parts of the NPISH sector in Wales, such as:
- trade unions
- political parties
- other non-profit bodies
Gross capital formation
What is gross capital formation
Gross capital formation (GCF) records how industries add to the stock of their long lived assets and inventories. It shows how investment increases the future productive capacity of the economy.
In the Welsh SUTs, GCF has 2 components:
- gross fixed capital formation (GFCF): spending on fixed assets that can be used repeatedly, such as buildings, machinery, vehicles and IT equipment
- changes in valuables and inventories: changes in stocks of materials, work in progress and finished goods, as well as acquisitions of valuables held as stores of value
Gross fixed capital formation
The ONS has discontinued the regional GFCF publication used for the 2019 IOT, and only limited data on investment in new buildings and structures are available for 2022.
As a result, we adopt a different method for estimating GFCF for the 2022 tables. These estimates are not directly comparable with the earlier estimates.
Industries covered by the ABS
Our starting point is ABS data on net capital expenditure and total output.
We calculate industry level ratios of net capital expenditure to output. Next, we multiply these ratios by the Welsh output estimates derived earlier to produce initial GFCF values for industries covered by the ABS.
Industries not covered by the ABS
Some industries – such as financial services and most public services – are not covered by the ABS.
For these sectors, we use Wales’ share of UK gross operating surplus from the ONS regional accounts. We apply this Welsh share to UK industry level GFCF estimates to produce estimates for Wales.
Dwellings
We estimate GFCF on dwellings by applying Wales’ share of UK new dwelling construction output, based on ONS data on regional construction output, to the corresponding value in the UK SUT.
Transfer costs
We estimate ownership transfer costs by allocating the UK total using a Welsh share derived from HM Land Registry data on transaction volumes and house prices.
Converting industry estimates to products
By this stage, we have GFCF estimates by industry, along with separate estimates for dwellings and transfer costs.
However, the use table requires GFCF by product, not by industry. We therefore convert industry level Welsh estimates to product level values using the UK GFCF product by industry matrix. This assumes that Welsh industries invest in different types of capital assets in the same proportions as UK industries.
We then aggregate these estimates to derive Welsh GFCF values for the 64 products in the use table.
Changes in valuables and inventories
We estimate changes in valuables and inventories by applying simple shares from the UK use table to Welsh domestic output.
Inventory levels can vary sharply from year to year. Welsh firms may accumulate or run down stocks for operational reasons that do not necessarily follow the patterns implied by the UK use table. However, broader economic factors – such as tariff uncertainty or supply chain disruption – may result in stock movements that align more closely with UK wide trends.
A more robust method would require Welsh specific data on stock levels and a clear distinction between real volume changes and price effects. This would involve valuing stocks at both the start and end of the year using appropriate deflators.
Changes in valuables and inventories appear alongside GFCF in the final demand section of the use table. Together, they form the second component of GCF.
Users should note that this element typically absorbs many of the remaining imbalances once all other relevant information has been incorporated during balancing. For this reason, we advise users interested in modelling investment to use gross fixed capital formation estimates rather than total gross capital formation.
Exports
What are exports
Exports are the final component of the use table.
In the Welsh SUTs, exports include both exports to the rest of the world (ROW) and sales of goods and services to the rest of the UK (RUK).
We first estimate exports by industry because the Trade Survey for Wales (TSW) and our bespoke methods measure exports on an industry basis. We then convert these estimates to a product basis using the Welsh supply table, which reflects the mix of products supplied by each industry.
Data sources
We use 3 main approaches:
- bespoke (“bottom up”) estimates, where reliable, sector specific evidence exists
- Trade Survey for Wales (TSW), which provides firm reported export shares to RUK and ROW
- HMRC Regional Trade Statistics and ONS International Trade in Services survey, used where TSW coverage is insufficient (note that these sources directly measure product exports)
A decision framework guides the choice of method for each industry, based on sample size, coverage, and whether goods and services exports can be separately identified.
Bottom up export estimates
We use industry-specific methods to estimate exports for some sectors.
CPA A01: Agriculture and hunting products
Export estimates are informed by sector specific evidence from Hybu Cig Cymru, Agriculture in the UK (DEFRA), and economic appraisals of the Welsh food and drink sectors.
ROW exports of livestock are derived using published sector shares, with remaining output allocated between Wales and RUK using population proportions.
We use similar methods to estimate exports of:
- dairy
- eggs
- cereals
- horticulture
- poultry exports
CPA A02: Forestry and logging products
We estimate exports of the forestry industry by comparing Welsh softwood removals with the volume processed in Welsh sawmills using data on UK-grown timber (Forest Research). We treat surplus material as exports.
ROW exports are assigned using UK export shares for forestry products, with the remaining surplus allocated to RUK.
CPA A03: Fishing and aquaculture products
ROW exports of the fishing industry are taken from Business Wales’ economic appraisal of the Welsh food and drink sectors.
We allocate the remaining output between Wales and RUK using population shares.
CPA B: Mining and quarrying
We exclude coal output from our export calculations for the mining and quarrying industry due to predominantly local consumption. Our export estimates therefore relate to non coal products (such as aggregates), using UK SUT export proportions to derive ROW exports.
RUK exports estimates are based on Wales’s share of UK construction activity, adjusted with a gravity factor to reflect the strongly localised markets for heavy construction materials.
CPA C24: Basic metals
We use Companies House data for the major steel manufacturing firms to estimate ROW exports of basic metals. These values are scaled to reflect the share of the firms’ workforce located in Wales.
We allocate the remaining output between local consumption and RUK exports using Wales’s share of UK gross fixed capital formation. This approach reflects the sector’s close links to fixed investment activity.
CPA D35: Electricity, gas, steam and air-conditioning
We do not separately identify ROW electricity exports from Wales within the current framework.
We use data on electricity transfers to England from the Digest of UK Energy Statistics (GOV.UK) to inform RUK export estimates.
CPA E36 and E37: Natural water, and water supply and sewerage services
A small RUK export value is recorded to reflect licenses for cross border abstraction of water and related income flows (note this is not a measure based on the physical volume of water transferred to England).
We set ROW exports to zero, noting that exports of bottled water are captured in the food processing industry.
CPA K64 to K66: Financial services
As detailed Welsh export data for financial services is limited, we estimate ROW exports by applying UK export to output ratios from the UK IOT to Welsh output. We allocate the remaining output to RUK using a population share approach.
This method provides export estimates that align with the size and structure of the Welsh financial services sector, which is considerably smaller than its Scottish and English counterparts.
Trade Survey for Wales (TSW)
TSW is the preferred data source where bespoke evidence is not used.
We use TSW data where minimum sample size and turnover coverage thresholds are satisfied, and where service export values are available.
Other trade data sources
Where TSW data are unavailable or do not meet quality thresholds, we draw on HMRC Regional Trade Statistics for goods and the ONS International Trade in Services survey for services.
For goods, we map SITC coded trade data to CPA products using a bespoke SITC-HS-CPA concordance.
Although the HMRC trade data relies on top down apportionment methods from UK level customs returns, both sources still provide essential coverage in sectors where Welsh firm level evidence is limited.
Estimating RUK exports
RUK exports are derived mainly from TSW. Detailed 64-sector estimates may be unreliable, so they are constrained to TSW-published broad sector totals.
Where TSW evidence is not available, we use the export propensity for the broader sector from TSW as a starting point. In many such cases – for example, public administration – RUK exports are expected to be negligible in economic terms.
Non-resident household spending in Wales
Spending in Wales by non residents (international visitors and visitors from the rest of the UK) is treated as an export, as national accounts classify transactions based on the residency of the consumer. We draw these values from the earlier HFCE calculations and include them as a separate column in the exports section of the use table.
Having derived the export estimates, the use table is now complete but not yet balanced.
Industry supply
What is industry supply
This 2022 release includes, for the first time, a Welsh supply (or “make”) matrix.
The supply matrix estimates which products are produced by each Welsh industry and is essential for transforming industry‑based estimates into the product‑based classification used in the SUTs.
It also allows us to publish standalone Welsh supply and use tables, which was not possible in the previous release.
The core product-by-industry element of the supply table describes the relationship between industries and the products they produce. It records domestic output only; imports are handled separately.
Values on the diagonal typically represent an industry’s primary product, while off‑diagonal entries capture secondary production – for example, farms providing accommodation services as part of diversification activity.
Constructing the Welsh supply table
We use the UK supply table as the starting point for the Welsh table and adapt it using Wales-specific evidence.
First, we reclassify the UK table to align with the 64 industries and products used in the Welsh framework.
Next, we use data from the ONS PRODCOM survey to replace UK production proportions with Welsh evidence for manufacturing industries. This provides Welsh-specific information for 20 product rows in the supply table.
Welsh industry output estimates, derived earlier in the methodology, provide the column totals for the supply table. We apply UK or Welsh product proportions to these totals to estimate output by product and industry.
The resulting matrix shows the pattern of domestic production in Wales. Its row totals represent total domestic output for each product.
Strengths and limitations
The introduction of a separate supply matrix represents a substantial improvement over the 2019 approach. It provides a structured approach to mapping Welsh production patterns across a subset of industries.
However, a significant share of the supply matrix still relies on UK production functions. This means that, for many sectors, we implicitly assume that Welsh industries have the same product mix as their UK counterparts – an assumption we know to be imperfect. For example, Welsh agriculture is less diversified than the UK average, while research and development activity is smaller and less widely distributed.
Future improvements
There remains considerable scope to increase the Welsh content of the supply table.
TSW collects information on the top products sold by businesses and could be used to supplement PRODCOM for manufacturing, while also extending coverage into service sector products.
The ONS Annual Survey of Goods and Services could potentially allow a PRODCOM style approach to be applied to non manufacturing industries.
Additional administrative datasets – for example in agriculture or research and development – could further refine individual product rows.
Incorporating these sources would enable the Welsh supply table to reflect the structure of Welsh industry more accurately and reduce reliance on UK production patterns.
We will consider these enhancements in future editions of the SUTs.
Taxes and subsidies on products
What are taxes and subsidies on products
Taxes and subsidies on products relate directly to what is purchased. Examples include VAT and excise duties. This differs from taxes and subsidies on production, which relate to the activities of producers.
Taxes and subsidies on products are included within the values recorded in the use table but are not included in domestic output in the supply table.
To ensure that total supply and use are valued consistently during balancing, we estimate these items and include them as a separate valuation column in the supply table.
We now estimate over 20 taxes and around 15 subsidies on products separately at product level, constraining each to Welsh totals supplied by the ONS. This provides a more accurate picture of product taxes and subsidies in Wales and aligns with the figures used to construct ONS regional GDP estimates.
Estimating taxes and subsidies by product
- We start with data on UK tax and subsidy rates supplied by ONS.
- We apply these UK shares to the Welsh use table to produce initial product level totals for VAT, other taxes on products, and subsidies on products.
- We then constrain these estimates so that the totals for each tax or subsidy match the Welsh figures used in the regional GDP estimates.
As discussed in a previous section, agricultural subsidies are treated as subsidies on production, so we do not include them again here.
Once Welsh totals have been set, we distribute them across industries and final demand categories to form a valuation matrix.
The resulting valuation matrix shows, for each product, how much of its use table value consists of VAT and other taxes and subsidies on products.
These valuation adjustments are summarised in the supply table.
Distributors’ trading margins
What are distributors’ trading margins
Distributors’ trading margins represent the value added by wholesalers, retailers and transport providers in distributing goods from producers to purchasers.
In the use table, these margins are embedded within the purchaser‑price values of individual product rows. In the supply table, however, they are shown explicitly as part of the output of the margin‑producing industries.
To reconcile these valuation bases, we construct a valuation matrix with the margin adjustments for each product and industry.
The 2022 tables adopt a more detailed approach than the 2019 release. We now use comprehensive margin rates supplied by ONS, applied at product level, and then constrain the results so margins remain consistent with Welsh evidence from ABS.
Estimating margins
ONS provides UK margin rates showing how much wholesalers, retailers and motor trades add to different products. These rates vary by product and by use category. They provide the best available evidence on the structure of margins, even though they are not specific to Wales.
We first adapt these UK margin rates to the product groups used in the Welsh tables. We then apply these margin rates to the Welsh use table. This provides us with an initial estimate of the value of wholesale, retail and transport margins associated with each product and each use category.
We apply the same margin rates used for household consumption to RUK exports and spending in Wales by non-residents, as these purchases more closely resemble within-Wales retail activity than standard international export transactions.
Once margins have been removed from the product rows, they are reallocated to the industries that provide the distribution services:
- wholesale and retail trade and repair of motor vehicles and motorcycles (G45)
- wholesale trade, except of motor vehicles and motorcycles (G46)
- retail trade, except of motor vehicles and motorcycles (G47)
No value is gained or lost. It is simply reassigned to ensure consistency between the supply and use sides.
However, an important limitation remains. The UK margin rates do not distinguish between margins generated within Wales and those generated elsewhere in the UK.
We therefore constrain the total margins allocated to each distribution industry so that they do not exceed output levels for the Welsh distribution sectors.
These margin adjustments will later be used to convert use table values from purchasers’ prices to basic prices.
Imports
What are imports
As with exports, imports include both imports from the rest of the world and purchases of goods and services from the rest of the UK.
Our aim is to produce credible import shares for every product used in Wales.
In the final IOT, these shares determine the scale of economic leakages – how much additional production in a Welsh sector is supported through Welsh supply chains, and how much flows out through imports.
Unlike exports, information on the origin of inputs is rarely available from company accounts or public sources. This makes import estimation one of the most challenging elements of the Welsh SUTs.
Trade Survey for Wales (TSW)
TSW helps address this evidence gap by providing industry level information on where inputs are purchased – Wales, RUK and ROW. These data enable us to estimate initial import propensities for each industry.
However, TSW data are recorded by industry, while the SUT framework requires product level import values. This mismatch means that we can observe the overall geographic pattern of an industry’s purchases, but not the origin of specific products within that mix.
Applying industry propensities to product rows
To address this, we use the same simplifying approach adopted in the 2019 release. As an initial approximation, we assume that each product inherits the import proportions of the industry that primarily produces it.
In practice, all users of a given product are assigned the same import share. Product rows therefore reflect fixed import proportions based on the primary producing industry, rather than industry-specific purchasing behaviour.
This approach does not reflect real supply chains. Industries import a wide range of inputs – not only their main product – and the TSW import shares capture these broader purchasing patterns, not solely imports of the primary product.
These initial estimates should therefore be seen as a starting structure for balancing, rather than as a direct measurement of Welsh product-level sourcing.
Handling low quality or missing TSW data
Where TSW evidence for an industry does not meet quality thresholds – for example, because of small sample sizes or low turnover coverage – we use the UK IOT to infer the ROW share.
We then allocate the remaining share between Wales and RUK using the best available TSW evidence, or earlier survey years where necessary. This ensures that every product has a full set of proportions for within Wales sourcing, and for imports from RUK and ROW.
Household imports, import taxes and integration into the SUTs
Direct household imports
Direct household imports include online purchases or digital content delivered by RUK or ROW suppliers. Detailed data on these purchases are limited.
For now, we assume households import each product in the same proportions as industries. While this is a simplification, it provides a transparent basis for estimation until more detailed household-level data become available.
Import taxes
Some imported goods also incur import taxes. We estimate these using UK product‑level import tax rates and apply them to the Welsh ROW import estimates.
We then constrain the resulting tax values to the total import tax figure for Wales supplied by the ONS regional accounts team.
Assembling the imports-use tables
Once finalised, we apply the import propensities to the Welsh use table to produce import‑use matrices for RUK imports, ROW imports and import taxes. Although these full matrices are not published, their row totals are summarised in the supply table. This shows how we move between domestic and total supply.
Spending by Welsh residents while abroad or visiting other parts of the UK is also included in total imports. These estimates were derived earlier as part of the HFCE calculations.
Future improvements
Import estimation remains one of the weaker areas of the Welsh SUTs and is therefore often one of the first components adjusted during balancing.
As part of this process, we compare initial ROW estimates with HMRC goods import data (mapped from SITC to CPA) and ONS estimates of trade in services. This provides a useful check on the reasonableness of the TSW‑based estimates.
Future developments to the TSW – particularly the inclusion of product‑level questions on purchases and their origins – could significantly strengthen Welsh import estimates. We are currently trialling the inclusion of such questions in the survey, which should help reduce the existing industry-product mismatch.
Users should note that goods imported and subsequently exported without further processing are not explicitly identified in the current SUT framework, due to a lack of suitable data.
Balancing the supply and use tables
What is table balancing
We now have a complete supply and use table, along with the required import matrices and valuation matrices. These matrices summarise the tax, subsidy and margin adjustments required to move between basic and purchasers’ prices, and domestic and total supply.
However, the SUTs are currently unbalanced; the estimated supply of each product does not match estimated use.
Balancing the tables involves ensuring that, for each product, total supply equals total use when measured on a consistent price basis.
The challenges of table balancing
The approach to balancing is significantly improved by the addition of a Welsh supply table. In this release, we have – for the first time – produced a Welsh estimate of product supply that can be compared directly with Welsh use.
For 2019, balancing involved ensuring that regional supply equated regional industry output plus industry imports, with some adjustment for inferred product-industry mix – a cruder approach.
Despite this improvement, significant challenges remain when balancing SUTs for a sub national economy.
First, important economic surveys – such as the ABS and Living Costs and Food Survey – have limited sample sizes at devolved nation level. Survey design often makes expanding this coverage costly or impractical. This means estimates are often subject to greater uncertainty. Supply-side and household surveys do not return identical data for conceptually similar metrics, even at UK level.
Second, some surveys are not structured to support devolved or regional reporting. They may lack regional stratification or any mechanism to scale responses so that they accurately represent Welsh economic activity.
Third, several conceptual issues are less well documented. This includes the treatment of cross regional distribution margins and inter regional movements of goods and intra firm financial flows.
These challenges are particularly acute in Wales. For historical and geographic reasons, the Welsh economic‑statistical system is more closely integrated with England than Scotland or Northern Ireland are with the UK.
This increases the difficulty of achieving a fully balanced SUT.
Manual balancing of supply and use
Balancing is carried out in 2 stages.
We begin by balancing supply and use manually. For each product, we compare total supply at purchasers’ prices from the supply table with total use at purchasers’ prices from the use table.
We review each component of the product row to assess its reliability and accuracy. This includes intermediate consumption and final demand, import propensities and industry output, which forms the basis of our estimate of domestic supply.
We also consider wider contextual evidence, including employment location quotients, UK product level export ratios, the wage levels implied by our assumptions, and other relevant information.
Where weaknesses are identified, or where results appear unreasonable, we amend the estimates to bring product supply and demand into balance. All amendments are recorded, agreed within the research team and stored in a version‑controlled database.
Changes made to one product row often affect the balance of others, including products previously balanced. As a result, the process must be repeated several times before an approximate balance is reached across all products.
While the detailed mechanics of the balancing process are not set out here, most of the manual balancing adjustments relate to import and export estimates. Imports are the most frequently adjusted component. This reflects ongoing challenges associated with the measurement of imports at a product level.
We also make several adjustments to output estimates, particularly for industries where the initial estimates were derived from UK GVA to output ratios due to limited ABS coverage.
Algorithmic balancing using the RAS method
When the tables are close to balanced, we use a bi proportional scaling technique known as the RAS method.
This method repeatedly adjusts rows to match the target row totals and then adjusts columns to match the target column totals. Each iteration reduces the remaining imbalance until total supply matches total use.
The standard RAS algorithm cannot assess the quality of any individual data point. For this reason, we still do most of the balancing manually, where we can apply judgement on data quality and on the reasonableness of the estimates.
Balancing identities
Once the system is fully balanced, several identities must hold. The first – and the main purpose of balancing – is that, for every product, total supply at purchasers’ prices must equal total use at purchasers’ prices.
The 3 standard GDP identities must also hold.
Standard GDP identities
- Production approach: GDP is derived by subtracting intermediate consumption from output to obtain GVA, and then adding taxes less subsidies on products to reach GDP at market prices.
- Income approach: GVA equals the sum of compensation of employees, taxes less subsidies on production, and other value added, with taxes less subsidies on products added to reach GDP at market prices.
- Expenditure approach: GDP equals the sum of household final consumption, government final consumption, NPISH final consumption, gross capital formation, and exports, minus imports.
Deriving the input-output table
Differences between SUTs and IOTs
SUTs describe how goods and services are produced and used within the economy. They also show which industries produce each product.
A single product can be produced by several industries. For example, most visitor accommodation is provided by the hospitality industry, but some farms also supply visitor accommodation as part of diversification activities.
Industry output is similarly diverse, with many industries producing a range of products beyond their primary outputs. In some cases, production is spread across many industries. Research and development is one example, as this activity takes place across many sectors.
In SUTs, the supply and use of each product is balanced within a single row. This total does not correspond directly to the output of the product’s primary industry, as multiple industries may produce the same product and each industry may produce multiple products.
SUTs are conceptually robust and form a core component of the national accounts. They offer a framework for producing balanced GDP estimates.
However, SUTs cannot directly support modelling methods that require a symmetric matrix in which each row total equals the corresponding column total. For this reason, most statistical agencies publish both SUTs and symmetric IOTs, either as industry by industry or product by product tables.
Industry-by-industry and product-by-product tables
Product by product tables are constructed using technology assumptions relating to secondary production.
In UK practice, a hybrid approach is used that combines industry technology and product technology assumptions. Under this approach, secondary products may be assumed either to use the same input structure as the producing industry or the typical input structure of the product itself, depending on the nature of the activity.
Industry-by-industry tables use a different assumption. They assume that the sales pattern of a product does not depend on which industry produces it.
Under this fixed product sales structure assumption, each product has the same sales pattern regardless of producer. As a result, secondary production is assumed to have the same sales pattern as the output of the same product supplied by its primary industry.
Both approaches rely on assumptions that will not always hold. For example, an industry by industry table may imply that fertiliser is used in on farm visitor accommodation.
Despite such limitations, symmetric input output tables are widely used, remain an essential analytical tool, and are required to derive multipliers.
Industry by industry tables are more common because they typically align more closely with policy needs and are more amenable to multiplier analysis.
The Welsh Government publishes an industry by industry input output table.
Deriving the industry-by-industry matrix
The first steps in deriving the input-output table are to isolate domestic use, and to convert the use table into basic prices. This involves removing taxes and subsidies on products and reallocating trade and transport margins using the valuation matrices.
We then remove imports from the use table using the imports‑use matrix.
After these adjustments, the revised use table is expressed on a consistent basis with domestic supply.
Once the domestic use and domestic supply matrices are prepared, we divide each cell of the domestic supply matrix by the total output of the corresponding industry. The resulting matrix shows the proportion of each product supplied by each industry.
The industry-by-industry input-output table is assembled using 3 components:
- intermediate consumption (at basic prices with imports removed)
- value added by industry
- final demand (at basic prices with imports removed)
Value added is already presented on an industry basis and requires no further adjustment. Intermediate consumption and final demand, however, are presented in product‑by‑industry format. To convert these to an industry-by-industry basis, we transform each matrix using the proportions derived from the domestic supply matrix.
Lastly, we assemble the transformed components to produce the final industry‑by‑industry IOT.
Structure of the input output table
The IOT differs from the use table in several respects:
- all values are in basic prices, with taxes less subsidies on products shown separately below the intermediate consumption matrix
- distributors’ trading margins have been reallocated to the industries that provide them
- imports are recorded in their own row, so the main body of the table reflects only domestic transactions
- the table is presented on an industry by industry basis rather than by product
Figure 3: structure of the industry-by-industry input-output table
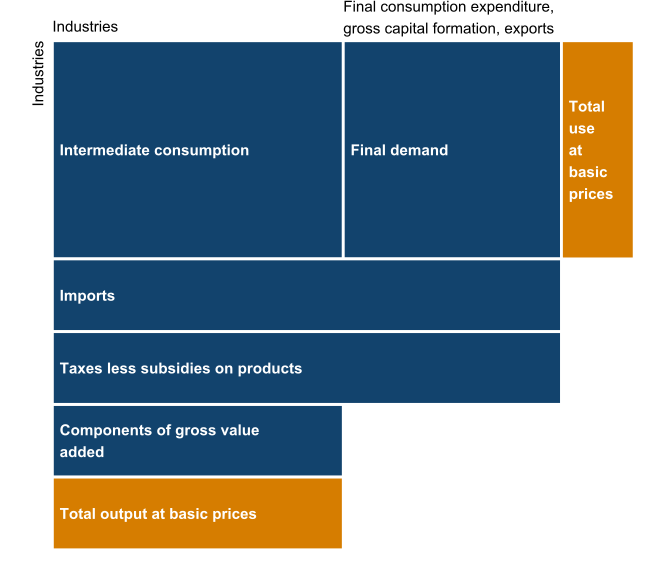
Description of figure 3: an IOT with an intermediate consumption matrix in the top left and final demand columns in the top right. Below these are rows showing imports, taxes less subsidies on products, and the components of gross value added. For each industry, the column total – comprising intermediate consumption, imports, taxes less subsidies on products and gross value added – equals total output at basic prices. Row totals show total use at basic prices.
Crucially, for each industry, total input at basic prices (the column totals) will match total output at basic prices (the row totals).
Statistical disclosure control
A further 2 steps are carried out before publication.
First, we ensure that no information about an individual business from any survey can be identified in the published tables.
Secondly, we assess whether any data or conceptual limitations are significant enough to prevent publication at the intended level of detail.
Where necessary, we combine industries and products to protect confidentiality or address quality issues. After completing these checks, we prepare the final SUTs and IOTs with 58 industries and products.
The industries (and related products) which are combined in the published tables are:
- manufacture of coke and refined petroleum (C19); manufacture of chemical products (C20)
- manufacture of motor vehicles (C29); manufacture of other transport equipment (C30)
- water transport (H50); air transport (H51); warehousing and support activities for transportation (H52)
- financial service activities (K64); insurance and pension funding (K65); activities auxiliary to finance and insurance (K66)
Further reading
Supply, use and input output tables are published across the UK. Methods differ, but each administration provides useful guidance on how the tables are built and how to interpret them. Helpful sources include the ONS Blue Book and the Scottish Government’s input-output methodology guide.
Our work follows, as far as possible, the framework set out in the European System of Accounts (2010). Eurostat publishes a detailed manual on SUT and IOT compilation.
Users looking for an introduction to wider national accounts concepts may find the OECD book on Understanding National Accounts useful.
For users interested in modelling, Miller and Blair’s ‘Input-Output Analysis’ (Cambridge University Press) provides a comprehensive account of input‑output methods, including chapters on multipliers and the challenges of regional table construction. The Welsh Government also publishes guidance on how to interpret these multipliers.
The Welsh Economy Research Unit (Cardiff University) previously produced IOTs for Wales, with the latest version before the 2019 release covering the year 2007. Work done by the Welsh Government since 2022 builds on this broader understanding but does not use Cardiff University data or intellectual property. Users who want more background on earlier Welsh estimates may find these historical publications helpful.
How the tables compare with other data sources
The SUTs and IOTs draw on a wide range of survey and administrative sources within a single balanced framework. As a result, estimates produced from the tables are often closely related to, but not identical to, statistics published elsewhere.
For example, we take ONS regional accounts as the starting point for GVA estimates, but we do not formally constrain to them. Differences arise particularly for agriculture, where we use Welsh Government agricultural accounts, and the financial services sector, where alternative evidence suggests lower levels of activity than implied by the regional accounts.
We base household final consumption estimates primarily on the ONS RHFCE publication. We then make additional adjustments to align them with the Welsh supply-use framework. As a result, the estimates are not directly comparable with the national or domestic measures published by ONS.
Similarly, export and import estimates draw on several sources, including the Trade Survey for Wales, HMRC trade statistics and ONS trade surveys. As a result, they will not match any individual source exactly.
These differences reflect the purpose of the SUT framework, which is to provide a coherent and internally consistent picture of the Welsh economy rather than to reproduce any single source dataset.
Definitions
Basic prices
Prices received by producers, excluding taxes on products and including subsidies, but excluding trade and transport margins invoiced separately.
Changes in valuables and inventories
Net changes in stocks of materials, work in progress, finished goods and valuables held as stores of value. This is a component of gross capital formation.
Compensation of employees (CoE)
Total remuneration paid by employers, including salaries and employers’ social contributions.
CPA (Classification of Products by Activity)
CPA is a Eurostat product classification system that groups goods and services according to the activity that produces them. It provides the product framework for the Welsh Government supply and use tables.
Domestic supply
Domestic supply represents output produced in Wales. This is valued at basic prices in the supply table.
Final consumption expenditure
Spending on final goods and services by households, government and non-profit institutions serving households.
Final demand
The consumption of goods and services by households, government and non-profit institutions serving households, plus gross capital formation and exports. It represents all uses of products that are not intermediate consumption and forms the top‑right section of the use table.
Gross capital formation (GCF)
Total investment in fixed assets, valuables and inventories.
Gross fixed capital formation (GFCF)
Investment in long lived fixed assets such as buildings, machinery and vehicles. This is typically the largest component of gross capital formation.
Gross value added (GVA)
The value generated by industries, defined as output minus intermediate consumption.
Imports-use matrix
A matrix showing the amount of each product imported by industries and final demand sectors. It is used to derive the domestic input output table.
Industry by industry input output table
A symmetric matrix showing flows between industries at basic prices, used to derive multipliers and support economic modelling.
Intermediate consumption
The goods and services used up or transformed as part of the production process. This appears in the top-left of the use table.
Margins (distributors’ trading margins)
The value added by wholesalers, retailers and transport providers as goods move from producers to users.
Multipliers
Measures showing the total economic impact of a change in final demand, including supply chain effects. We publish detailed guidance on how to interpret multipliers in a separate article.
Non profit institutions serving households (NPISH)
Organisations providing goods and services to households free or at prices that are not economically significant. Examples include charities and some education providers.
Other value added
The residual component of GVA after deducting compensation of employees and taxes less subsidies on production. This mainly consists of profits and self-employment income.
Output
The total value of goods and services produced by an industry, including additions to inventories and work in progress.
Purchasers’ prices
Prices paid by users, including taxes on products and margins and excluding subsidies.
RAS algorithm
A bi proportional scaling technique used to adjust rows and columns during the final stages of balancing so that total supply equals total use.
SIC (Standard Industrial Classification)
SIC is the UK’s official industrial classification system that groups businesses according to their economic activity. It is used as the basis for industry groupings in the Welsh Government supply and use tables.
Supply table
A table showing domestic production of each product at basic prices, taxes and subsidies on products, imports and margins.
Taxes and subsidies on production
Payments or receipts linked to the activities of producers rather than specific products, such as non-domestic rates.
Taxes and subsidies on products
Taxes or subsidies applied per unit of a product purchased, such as VAT or excise duties.
Use table
A table showing how products are used across industries and final demand sectors at purchasers’ prices.
Valuation matrices
Matrices that allocate taxes, subsidies and margins across products and users. These allow us to move between basic prices and purchasers’ prices.
Quality and methodology information
Statement of compliance with the Code of Practice for Statistics
Our statistical practice is regulated by the Office for Statistics Regulation (OSR). OSR sets the standards of trustworthiness, quality and value in the Code of Practice for Statistics that all producers of official statistics should adhere to.
All our statistics are produced and published in accordance with a number of statements and protocols to enhance trustworthiness, quality and value. These are set out in the Welsh Government’s Statement of Compliance. These official statistics in development (UK Statistics Authority) demonstrate the standards expected around trustworthiness, quality and public value in the following ways.
Trustworthiness
We developed this release in line with the UK Statistics Authority’s Code of Practice for Statistics. Pre-release access was provided only to the appropriate named officials.
The tables were prepared by professional analysts using the best available data and methods, and free from political influence.
We are publishing this detailed methodology report to support transparency and to enable users to understand the methods and data sources that underpin the estimates.
The IOT project is overseen by an internal project board that includes the Welsh Government’s Chief Statistician and Chief Economist.
Quality
These statistics are produced to high professional standards. We have engaged widely on data sources and methods, including peer review and advice from experts in academia, the ONS and other devolved governments. We have aligned to international standards for national accounts as far as possible.
The estimates have undergone a quality assurance process carried out by colleagues who were not involved in producing the tables. We also developed reproducible analytical pipelines to automate parts of the workflow and to provide additional assurance over manual processes.
We believe these estimates provide the best available picture of the structure of the 2022 Welsh economy. However, gaps remain in Welsh economic data. This report identifies areas where the underlying information is weaker and sets out planned improvements for future updates.
Value
We publish the data both in ODS format and on StatsWales. This allows users to work with the data directly or programmatically via the StatsWales API.
We also publish multipliers, supported by guidance that explains how they should be interpreted and their limitations.
We remain committed to engaging with users to ensure that these outputs continue to meet their needs. We welcome feedback on the use of these statistics, or on any aspect of the data or methodology. Any feedback will help inform future developments.
You are welcome to contact us directly with any comments on how we meet these standards. Alternatively, you can contact OSR by emailing regulation@statistics.gov.uk or via the OSR website.
Well-being of Future Generations Act (WFG)
The Well-being of Future Generations Act 2015 is about improving the social, economic, environmental and cultural wellbeing of Wales. The Act puts in place seven wellbeing goals for Wales. These are for a more equal, prosperous, resilient, healthier and globally responsible Wales, with cohesive communities and a vibrant culture and thriving Welsh language. Under section (10)(1) of the Act, the Welsh Ministers must (a) publish indicators (“national indicators”) that must be applied for the purpose of measuring progress towards the achievement of the wellbeing goals, and (b) lay a copy of the national indicators before Senedd Cymru. Under section 10(8) of the Well-being of Future Generations Act, where the Welsh Ministers revise the national indicators, they must as soon as reasonably practicable (a) publish the indicators as revised and (b) lay a copy of them before the Senedd. These national indicators were laid before the Senedd in 2021. The indicators laid on 14 December 2021 replace the set laid on 16 March 2016.
This release does not directly include any national or contextual indicators. However, applied modelling using the IOTs may be used to support two of the national indicators, namely:
- emissions of greenhouse gases within Wales
- emissions of greenhouse gases attributed to the consumption of global goods and services in Wales
Information on the indicators, along with narratives for each of the wellbeing goals and associated technical information is available in the Wellbeing of Wales report.
Further information on the Well-being of Future Generations (Wales) Act 2015.
The statistics included in this release could also provide supporting narrative to the national indicators and be used by public services boards in relation to their local wellbeing assessments and local wellbeing plans.
Contact details
Input-output tables team
Email: inputoutputtables@gov.wales
Media: 0300 025 8099