
Wellbeing of Wales 2026 - A Wales of cohesive communities
A summary of progress on improving our social, economic, environmental and cultural wellbeing.
In this page
The goal for a Wales of cohesive communities
Attractive, viable, safe and well-connected communities.
Progress towards the goal
Community cohesion indicators had been broadly stable since financial year 2016 to 2017 until a sizeable increase in 2020 to 2021. Since then the percentage of adults agreeing with all 3 measures of community cohesion has fallen, with this trend also observed in 2024 to 2025, moving closer towards pre-pandemic levels.
Signs of a return to pre-pandemic levels are particularly apparent in people’s satisfaction with their local area and people feeling they can influence local decisions. The percentages reported for these indicators in 2024 to 2025 were either equal to or within a percentage point of what was observed in 2018 to 2019.
People feeling safe after dark has remained relatively constant since first asked in 2016 to 2017 and stood at 68% in 2024 to 2025.
The percentage of people volunteering had been falling but is an indicator that has seen recent increases. The national milestone to have 30% of people volunteering was reached in 2022 to 2023, and continues to be met, with 32% of people volunteering in 2024 to 2025.
Loneliness, based on a composite of 6 separate measures, has remained the same over recent years, with 13% of people in Wales found to be lonely in 2022 to 2023. Within the overall measure, the percentage that ‘miss having people around’ has followed a different pattern with a substantially increased percentage during the coronavirus (COVID-19) pandemic in 2020 to 2021 and 2021 to 2022 before falling to previous levels in 2022 to 2023 (36%).
In the past year the percentage of households successfully prevented and relieved from homelessness has slightly increased, whilst the number of individuals in temporary accommodation has decreased, as has the estimated number of individuals sleeping rough.
Half of people in Wales think crime has risen a lot nationally in recent years. This figure has returned to the pre-pandemic levels observed in 2018 to 2019 and 2019 to 2020 after a drop in 2022 to 2023. However, since 2015 to 2016, there have been general downward trends in the proportion of adults who were victims of crime (excluding fraud), and victims of personal crime. In the last year (2025 to 2026) police recorded crime in Wales (excluding fraud) has decreased by 3% whilst the proportion of adults who are victims of crime has also reduced (4% of adults in 2025 to 2026).
Community cohesion
In financial year 2024 to 2025, nearly 6 in 10 adults (58%) agreed with all 3 measures of community cohesion (belonging to the local area, people from different backgrounds getting on well together, and treating each other with respect and consideration). This is an increase on pre-pandemic years but lower than what was reported in 2021 to 2022.
These figures had been broadly stable since they were first collected in 2012 until the sizeable increase in 2020 to 2021. Whether the increases in 2020 to 2021 and 2021 to 2022 were a short-term effect of the pandemic (with communities coming together locally) and whether the fall observed in 2024 to 2025 will be sustained or partly sustained over the longer term will not become clear until data is available for future years.
A breakdown by factors linked to all 3 measures of community cohesion is available in the 2025 Wellbeing of Wales report.
Belonging to the local area
In relation to the belonging to the local area measure of community cohesion specifically, between April 2024 and March 2025, 73% of people in Wales agreed that they belong to their local area. This is down from 79% between April 2021 and March 2022.
People who felt they belonged to their local area were more likely to be aged 45 to 64, or 65 or older (77% and 80% respectively) in comparison to people aged 16 to 44 (65%). They were also more likely to be White (Welsh, English, British, etc.) (73%) or part of an ethnic minority (excluding White minorities) (77%). No differences could be identified when comparing these groups with each other; however, both groups were more likely to agree they belonged to their local area compared with White minority groups (56%). In addition, the type of area in which people lived was found to be linked to a feeling of belonging to the local area, with this the case for 79% of people who lived in a rural area relative to 70% of people who lived in an urban area.
People from different backgrounds getting on well together
With regards to the people from different backgrounds getting on well together measure of community cohesion, between April 2024 and March 2025, 80% of people in Wales thought that people from different backgrounds in their local area got on well together. This is down from 82% between April 2021 and March 2022, the last time this question was asked in the National Survey for Wales.
People who thought that people from different backgrounds got on well together in their local area were more likely to be 65 or older (84%) compared with people aged 16 to 44 (78%), or 45 to 64 (79%). They were also more likely to not have a limiting long-standing illness or disability (82%) relative to people who do have a limiting long-standing illness or disability (76%), plus they were more likely to be satisfied with their ability to get to local services or facilities (82%) in comparison to people who were not satisfied (73%).
Belonging to the local area was also found to be a factor linked to agreeing that people in the local area from different backgrounds get on well together. 89% of people who strongly agreed that they belonged reported this compared with just 50% of people who strongly disagreed they belonged to their local area.
Figure 5.1: percentage of people agreeing with statements about their local area, by financial year, between 2012 to 2013 and 2024 to 2025 [Note 1]
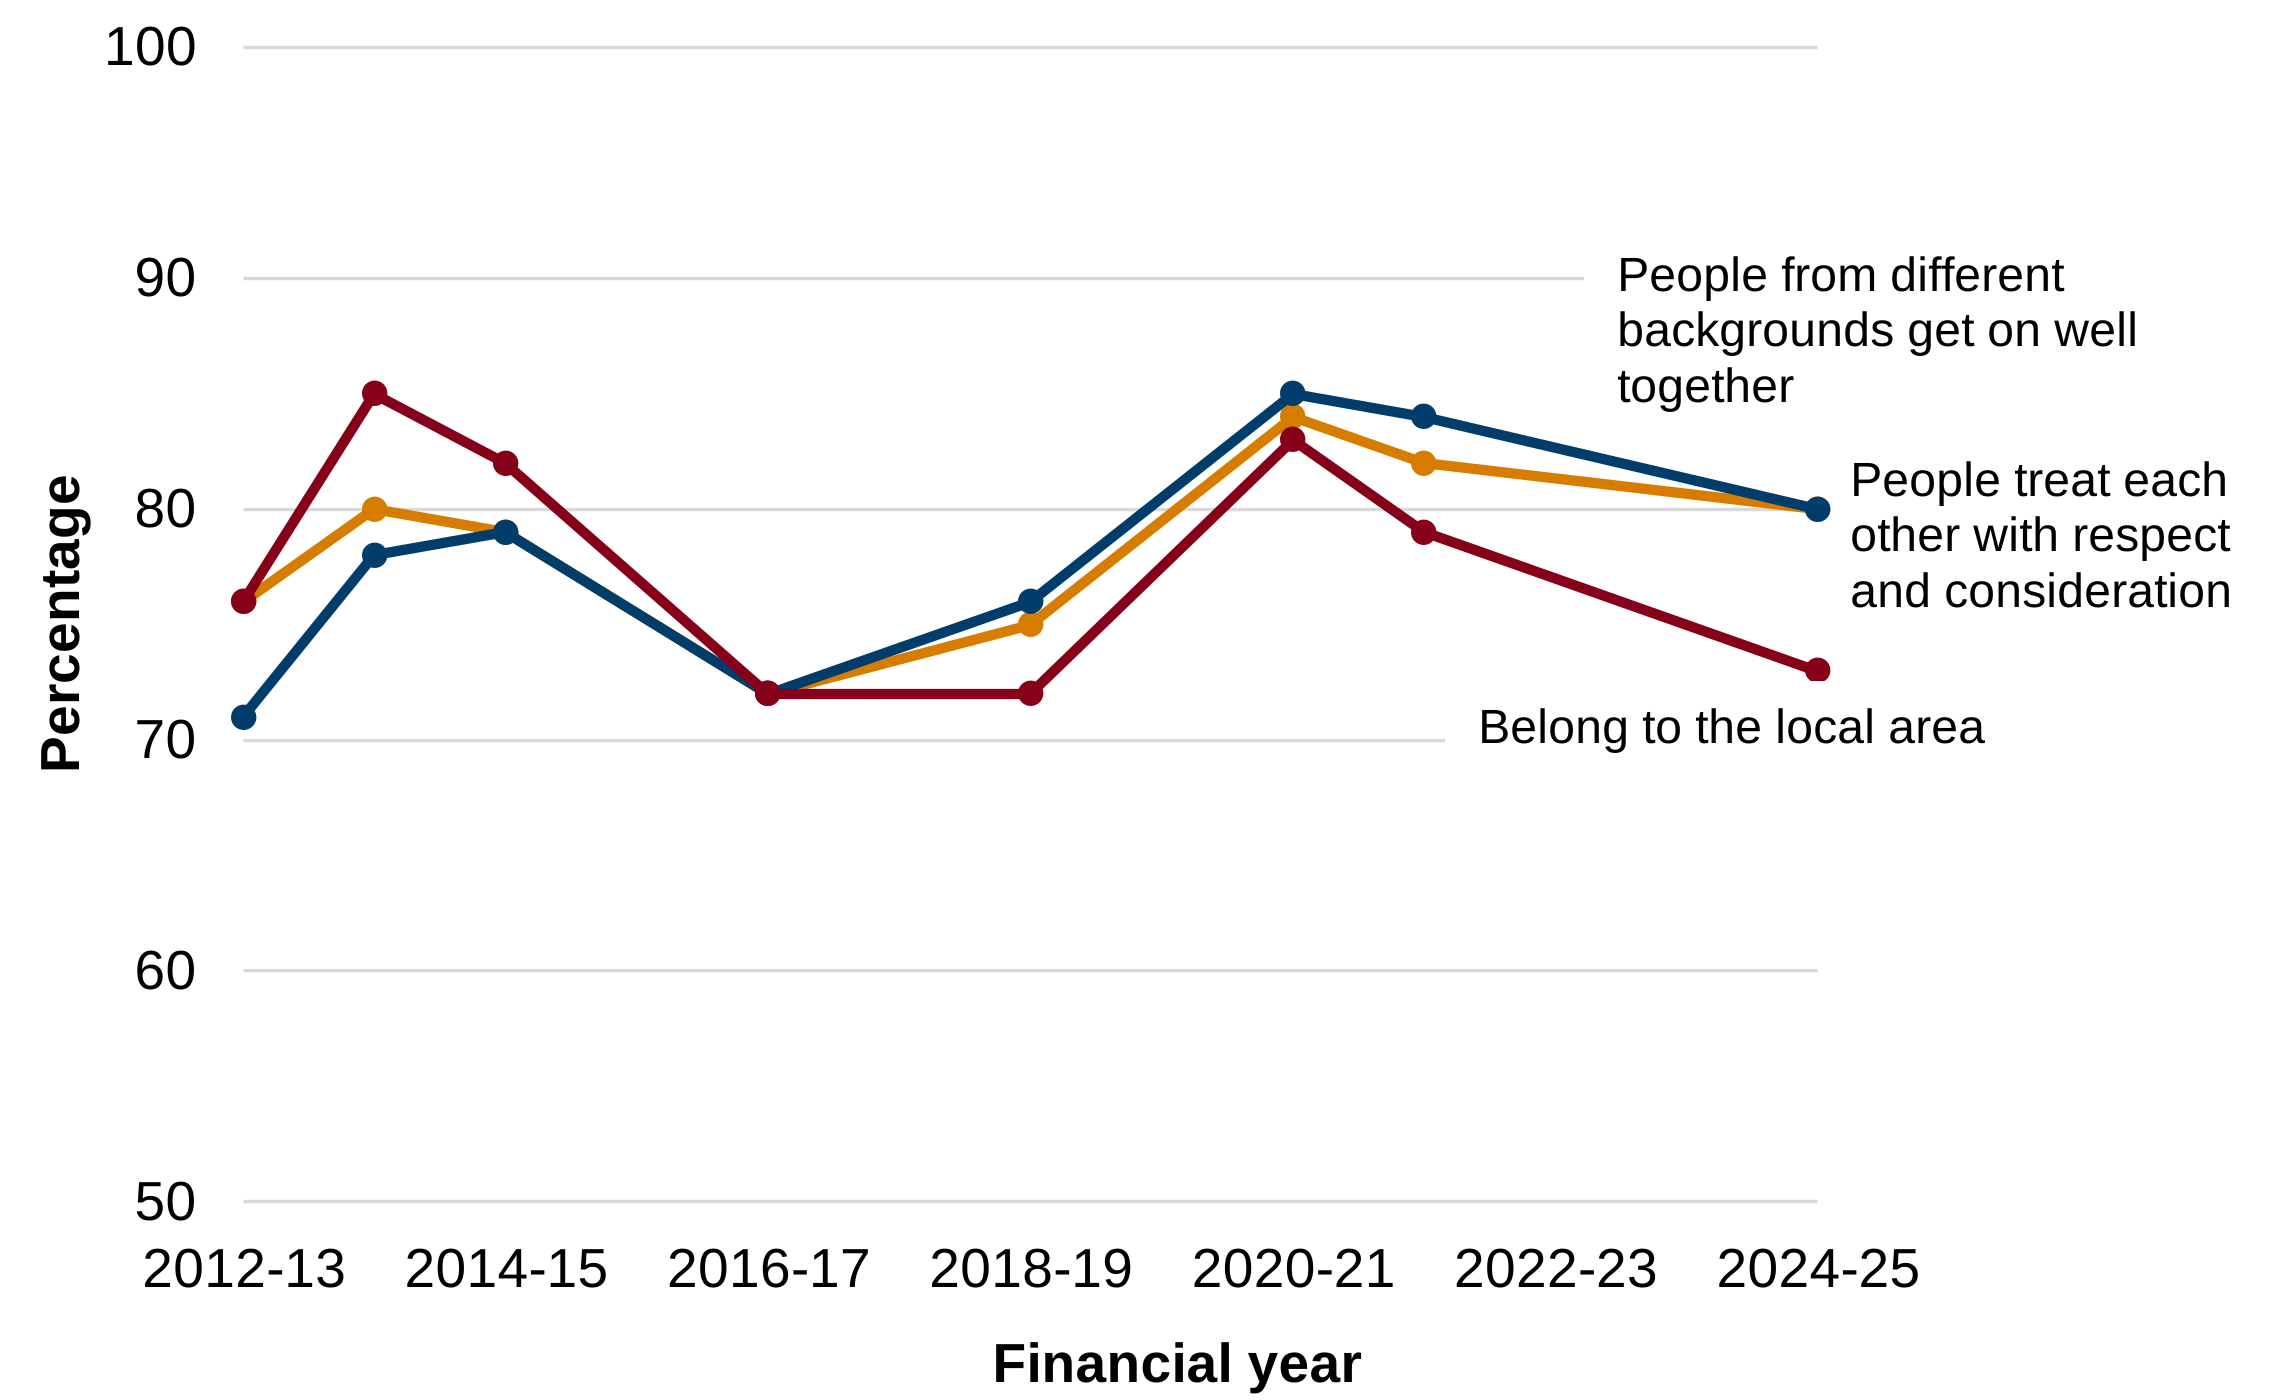
Description of figure 5.1: line chart showing percentage of people who agree with 3 statements about community cohesion in their local area from financial year 2012 to 2013 until 2024 to 2025. In 2024 to 2025, 80% agreed people in the area from different backgrounds get on well together; 80% agree people treat each other with respect and consideration; and 73% agreed they belong to the local area.
Source: National Survey for Wales: Welsh Government
[Note 1] The years 2015 to 2016, 2017 to 2018, 2019 to 2020, 2022 to 2023 and 2023 to 2024 have no data associated with them.
Feeling safe after dark
Just over two-thirds of adults feel safe in various situations after dark.
The national indicator is the percentage of people that agreed with 4 statements about feeling safe after dark at home, walking in their local area, travelling by public transport or travelling by car. In financial year 2024 to 2025, 68% of people felt safe in all 4 situations. These results have remained relatively constant across the years since first asked in 2016 to 2017.
A breakdown by factors linked to feeling safe after dark is available in the 2025 Wellbeing of Wales report.
Figure 5.2: percentage of people agreeing with statements about feeling safe after dark, financial year 2024 to 2025
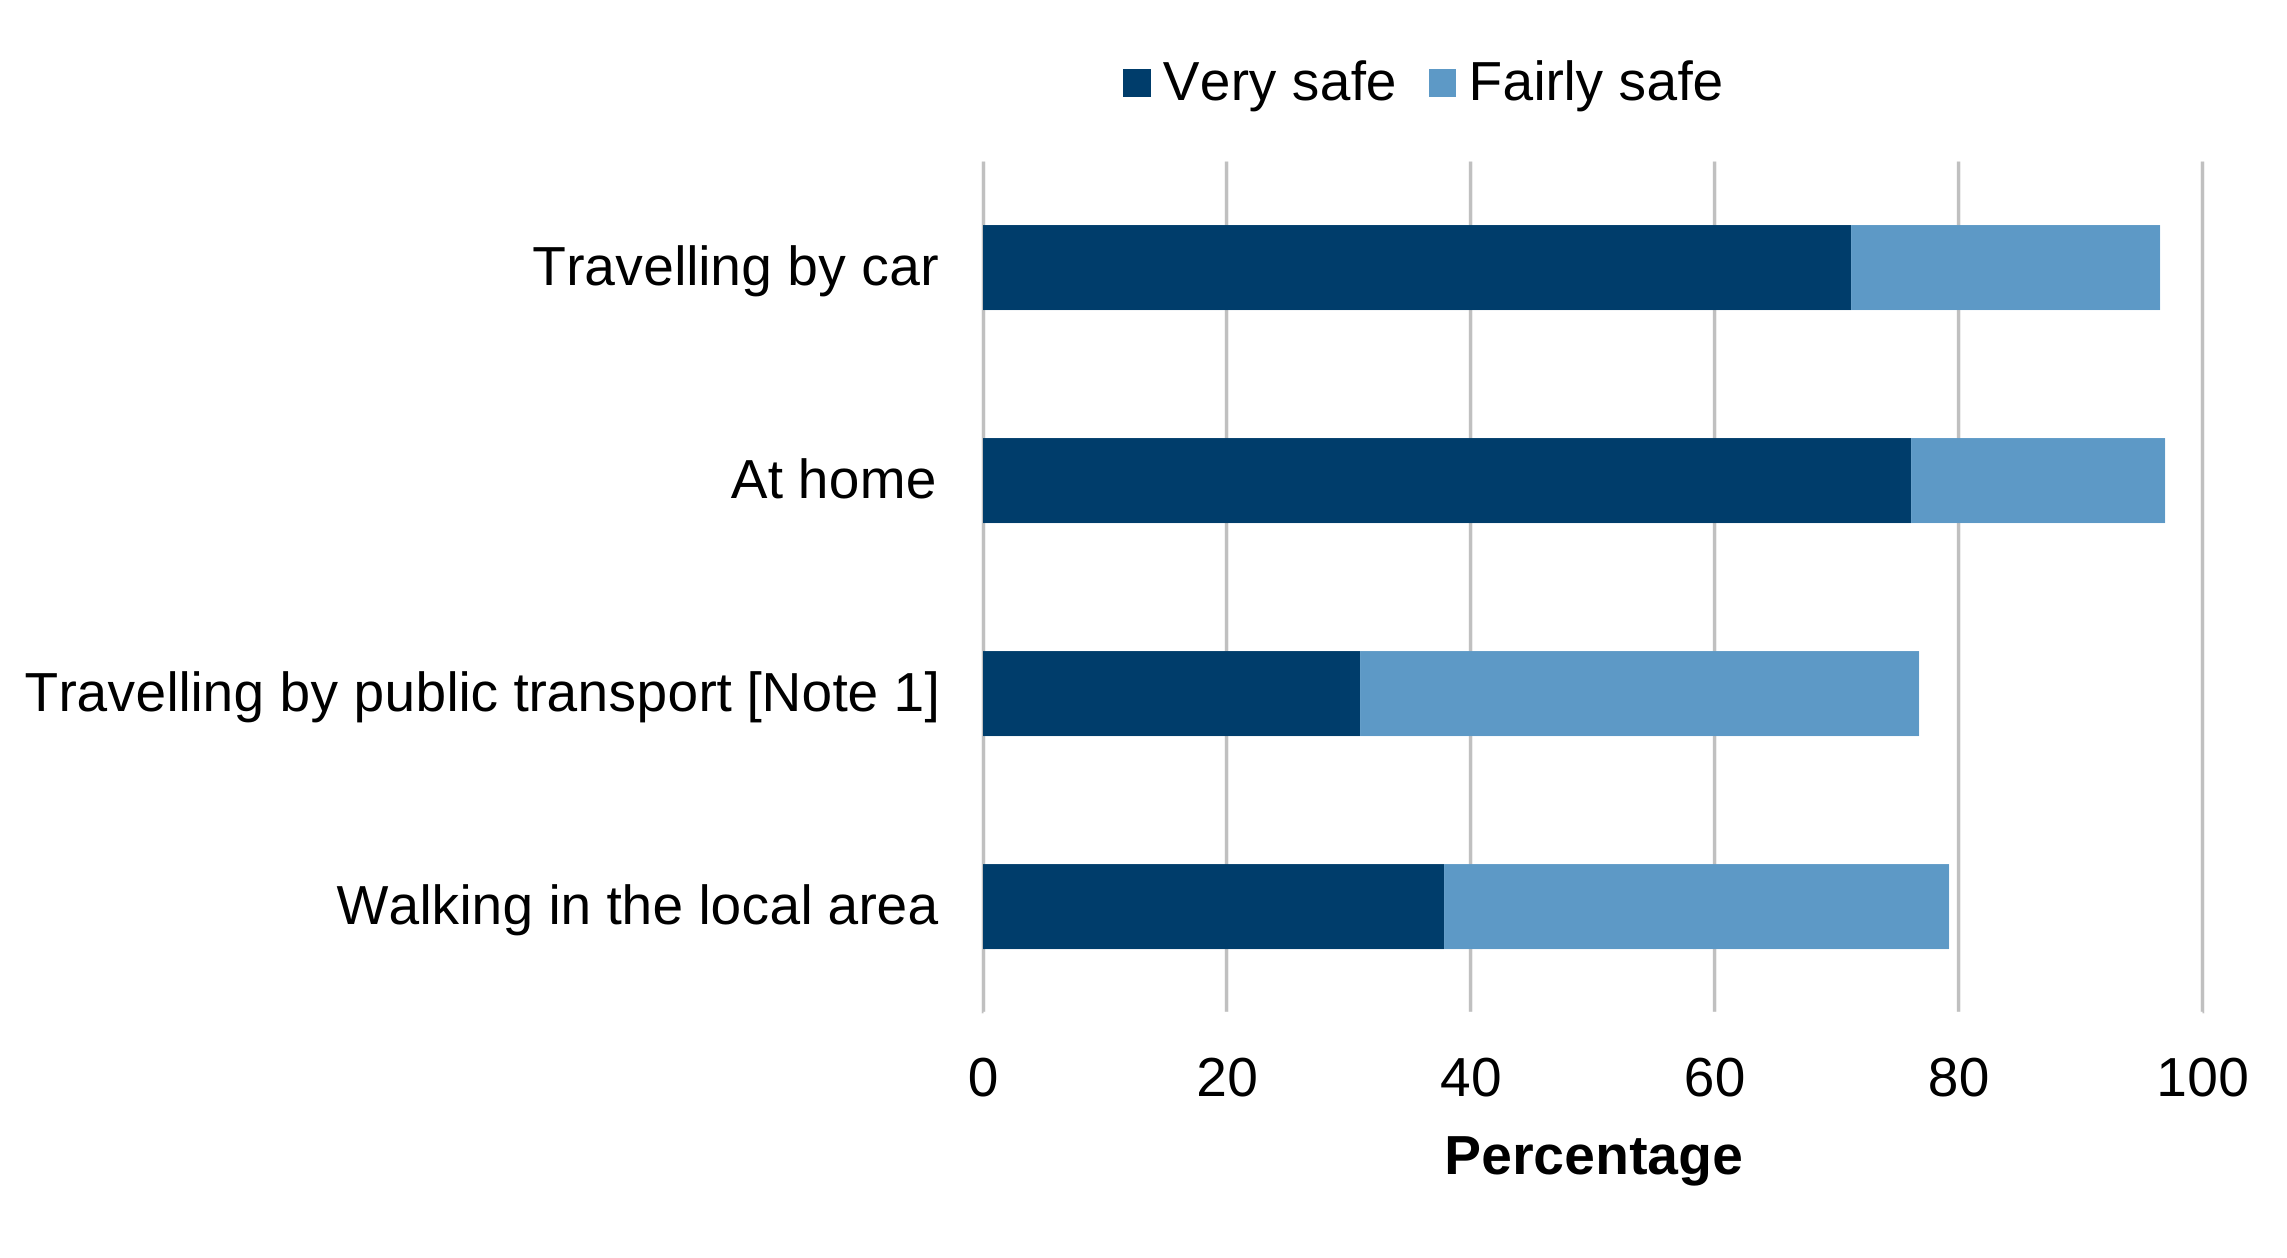
Description of figure 5.2: a bar chart showing the percentage of people agreeing with statements about feeling safe after dark in financial year 2024 to 2025. 97% felt safe at home, 97% felt safe travelling by car, 79% felt safe walking in the local area and 77% felt safe travelling by public transport.
Source: National Survey for Wales
[Note 1] 16% of people who were asked said 'Don't know' to the question about public transport and were excluded from the analysis.
Satisfaction with local area
In financial year 2024 to 2025, 84% of people said they are satisfied with their local area as a place to live, lower than the results in previous years and similar to what was reported pre-pandemic.
A breakdown by factors linked to satisfaction with local area is available in the 2025 Wellbeing of Wales report.
Access to good services and facilities
In April 2024 to March 2025, 78% of people in Wales were satisfied with the ability to get to local services or facilities. This is down from 86% between April 2021 and March 2022, the last time this question was asked in the National Survey for Wales.
People who were satisfied with their ability to get to local services or facilities were more likely to live in an urban area (81%) compared with people living in a rural area (74%). They were also more likely to not have a limiting long-standing illness or disability (82%) relative to people who do have a limiting long-standing illness or disability (72%).
Both life satisfaction and belonging to the local area were also found to be linked with being satisfied with the ability to get to local services or facilities. People who were satisfied with their ability to get to local services or facilities were most likely to have a very high life satisfaction (85%), followed by people with a high life satisfaction (79%). People with a medium life satisfaction were next most likely (69%) and people with a low life satisfaction were least likely to be satisfied with their ability to get to local services (56%). With regards to a sense of belonging to their local area, people who agreed they belonged were more likely to be satisfied with their ability to get to local services and facilities than people who disagreed (strongly agree: 83%; tend to agree: 79%; tend to disagree: 65%; strongly disagree: 67%).
Figure 5.3: access to good services and facilities by area, financial year 2024 to 2025
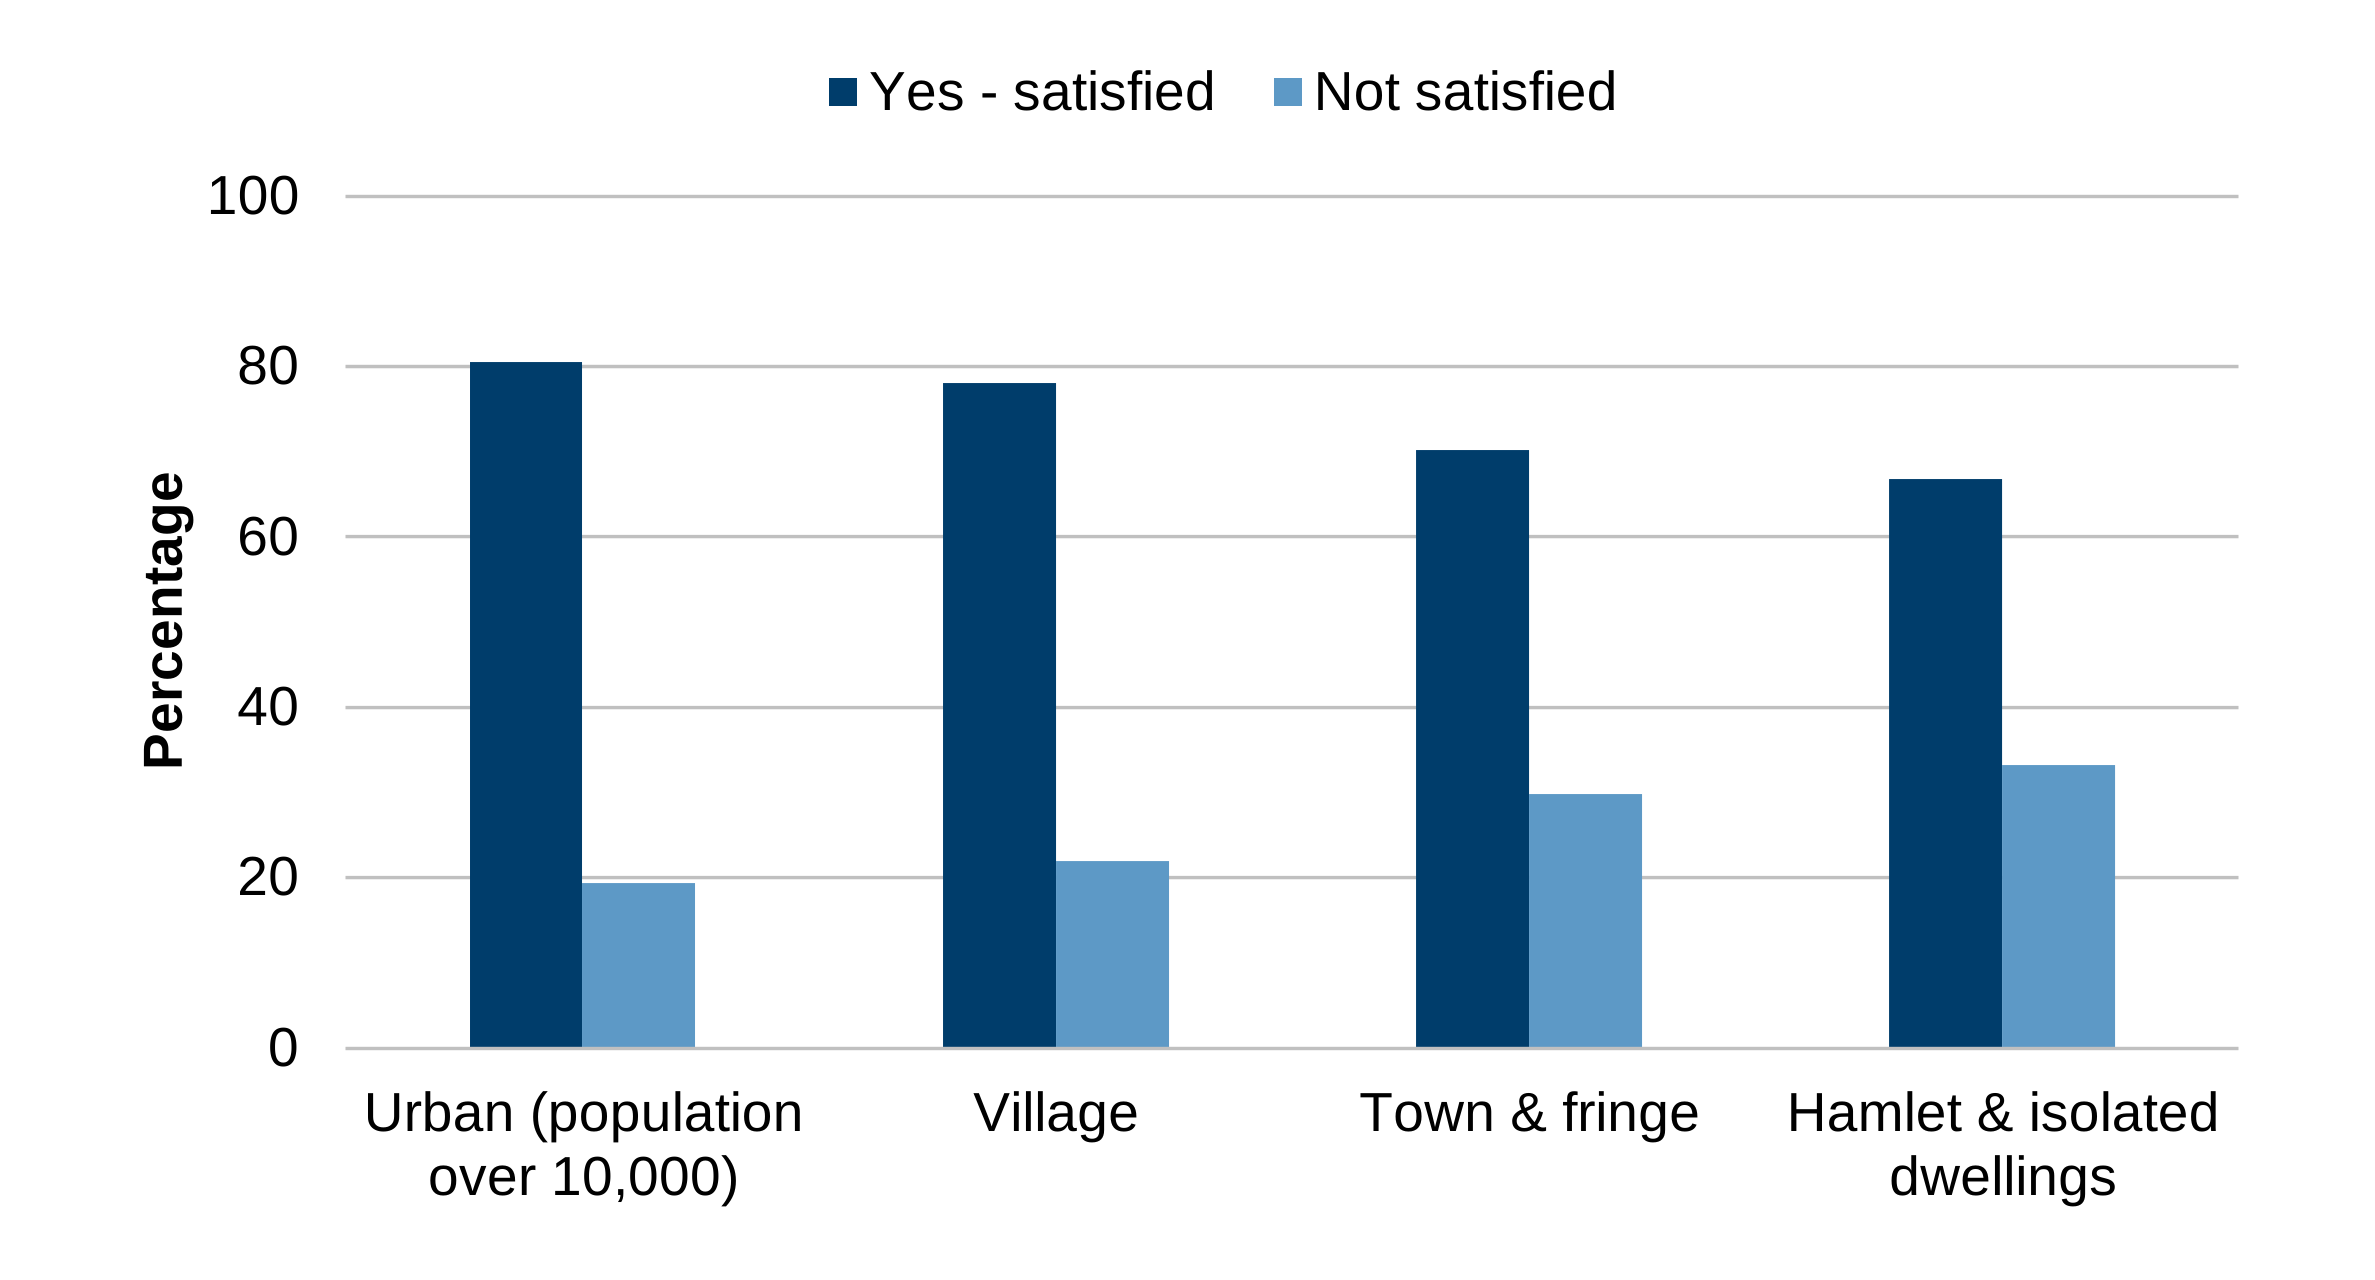
Description of figure 5.3: bar chart showing percentage of people who are satisfied with their access to good services and facilities. 81% of people in urban areas are satisfied compared with 67% of people who live in hamlets and isolated dwellings.
Source: National Survey for Wales
Influencing local decisions
In April 2024 to March 2025, 19% of people felt that they could influence decisions affecting their local area compared with 30% in 2021 to 2022, 26% in 2020 to 2021 and 19% in 2018 to 2019. Whether the higher figures observed in 2020 to 2021 and 2021 to 2022 were the consequence of the pandemic with proportions returning to pre-pandemic levels from 2024 to 2025 onwards requires monitoring in future survey years.
People who said they could influence decisions affecting their local area were more likely to be 65 or older, with this the case for 23% of people in this age range, compared with 18% of people aged 16 to 44 or 45 to 64. They were also more likely to live in a rural area (22%) relative to an urban area (18%), and to be satisfied with their ability to get to local services or facilities (21%) compared with people who were not satisfied (12%).
People who had contacted their local councillor in the last 12 months were more likely to feel that they could influence decisions affecting their local area than people who had not, or people who had contacted a councillor but were unsure of what type. 24% of people who had contacted their local councillor in the last 12 months said they could influence decisions affecting their local area, compared with 18% of people who had not.
A further factor linked with feeling able to influence decisions affecting the local area was the feeling of belonging, whereby people who strongly agreed that they belonged to the local area were most likely to feel they could influence decisions (25%). People who tended to agree that they belonged were more likely to feel they could influence decisions affecting their local area (19%) than people who neither agreed or disagreed that they belonged to their local area (11%) or who strongly disagreed that they belonged (8%).
Figure 5.4: percentage of people who feel they can influence decisions affecting local area, between financial years 2012 to 2013 and 2024 to 2025
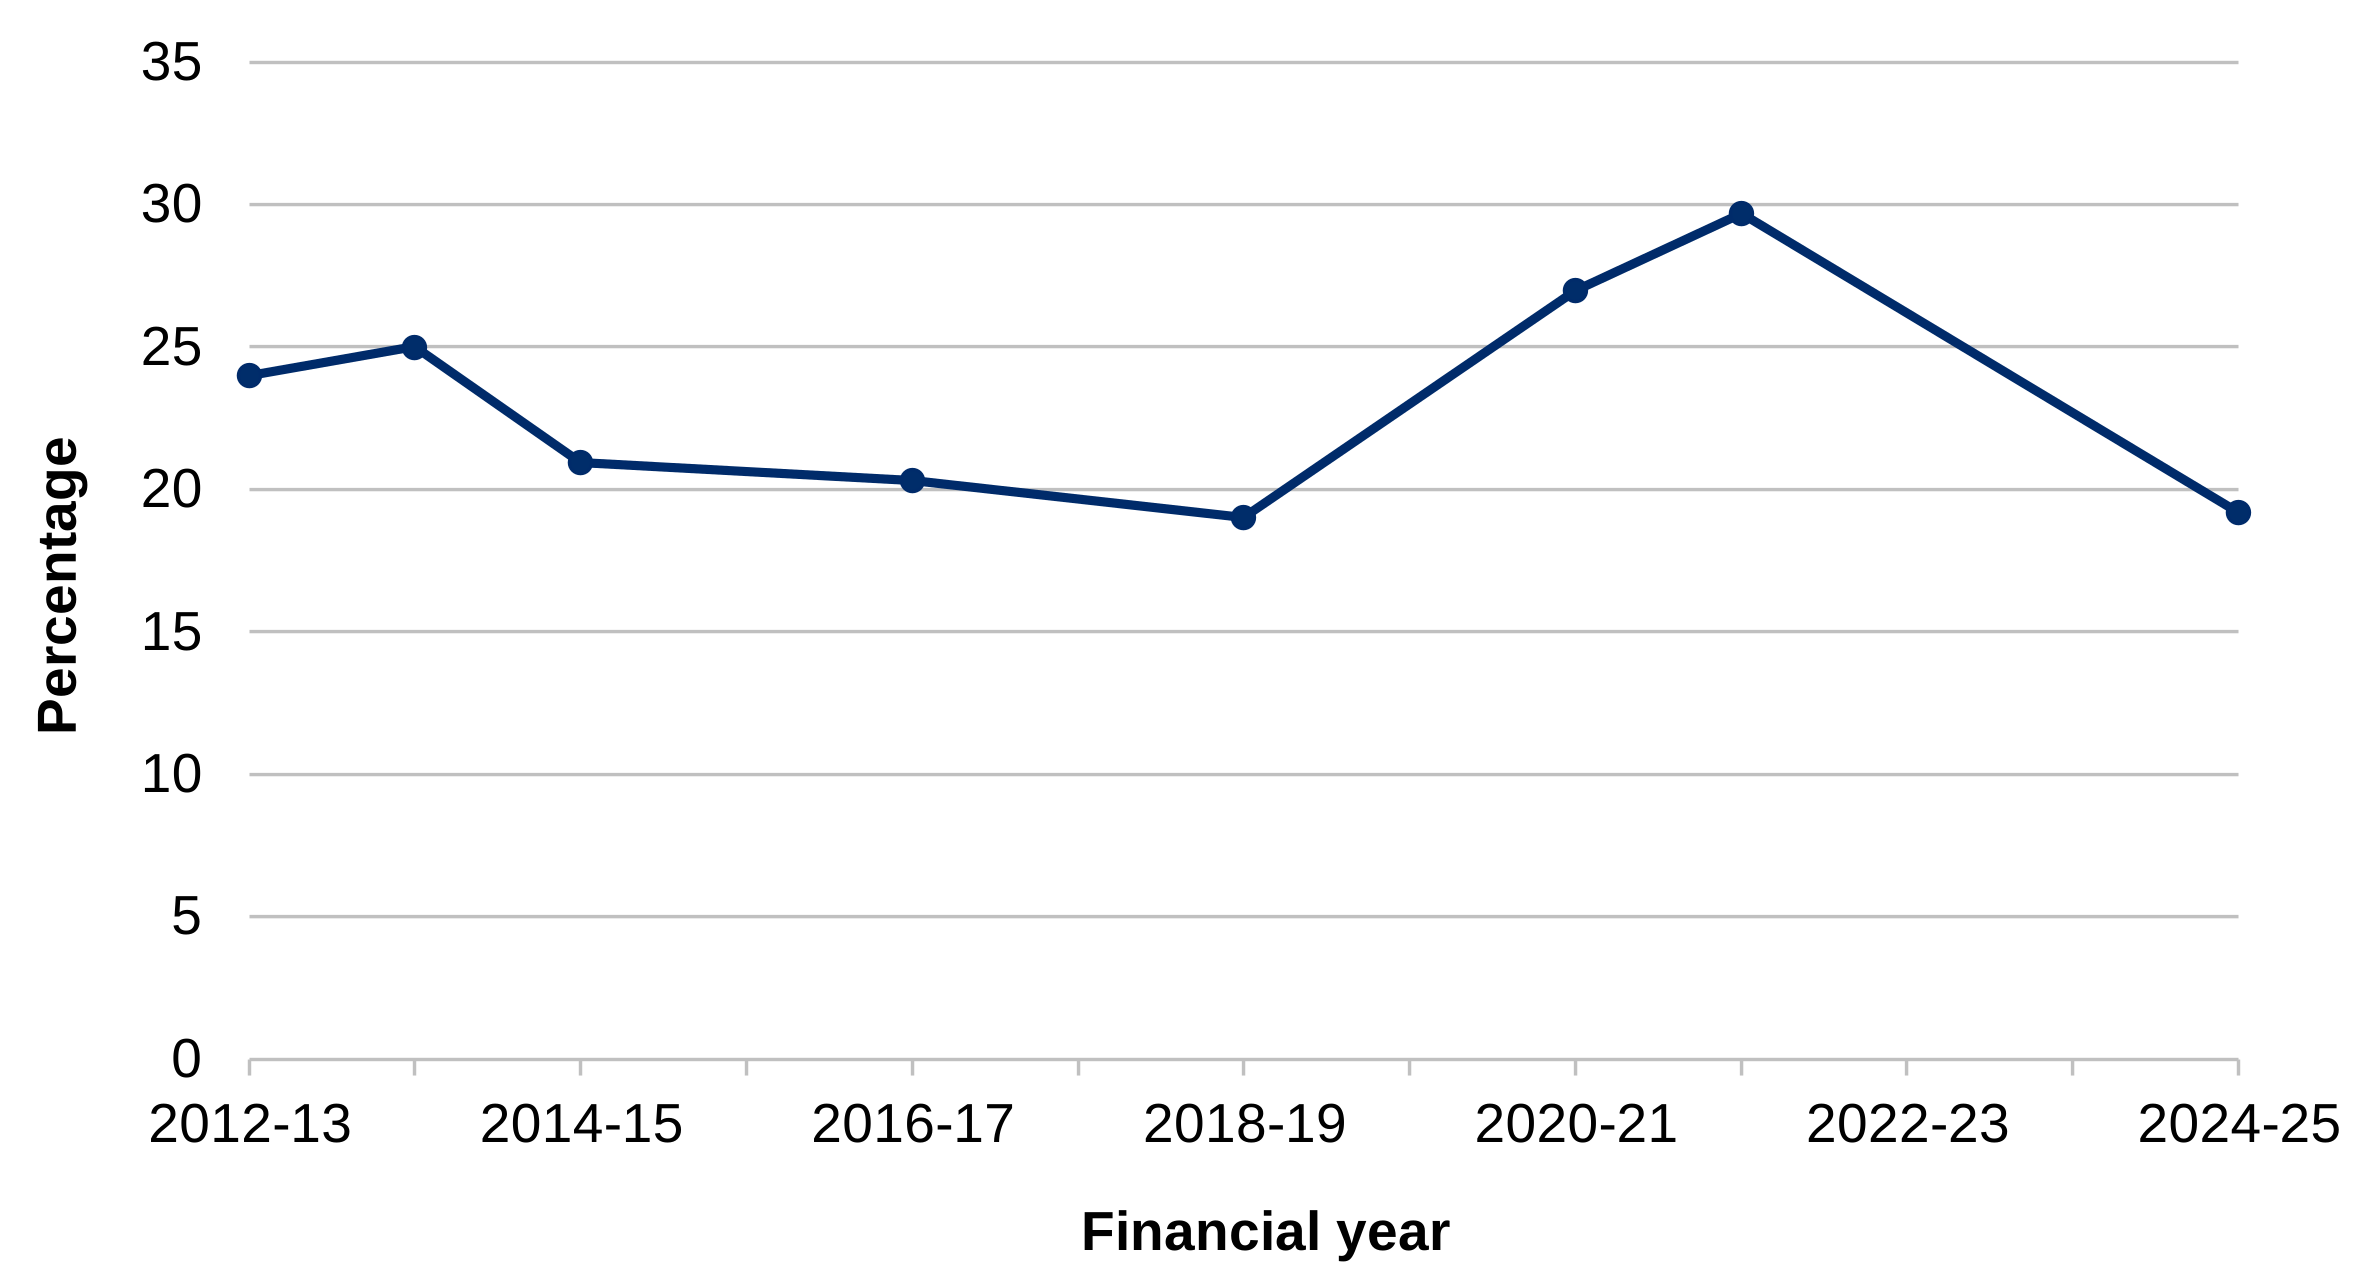
Description of figure 5.4: line chart showing the percentage of people who feel they can influence decisions affecting their local area. In financial year 2024 to 2025, 19% of people felt they could influence decisions affecting their local area, returning to the levels last seen in 2018 to 2019. This compares to proportions of 30% and 26% in 2021 to 2022 and 2020 to 2021, respectively.
Source: National Survey for Wales
Volunteering
Results from online data collected as part of the National Survey for Wales 2024 to 2025 showed that 32% of people said they volunteered for clubs or organisations. This compares with 26% in 2019 to 2020 (when the survey took place face-to-face), 29% in 2021 to 2022 (when the volunteering questions were asked as part of the online module for the first time) and 30% in 2022 to 2023 (again following a purely online data collection). In all years people most commonly volunteered for charities and sports clubs.
A breakdown by factors linked to volunteering is available in the 2025 Wellbeing of Wales report.
Figure 5.5: percentage of people volunteering by type of organisation, financial year 2024 to 2025

Description of figure 5.5: bar chart showing the percentage of people volunteering, by type of organisation, in financial year 2024 to 2025. People are most likely to volunteer for charitable organisations (12%), or sports clubs (9%).
Source: National Survey for Wales
The national milestone for the volunteering indicator is to “increase the percentage of people who volunteer by 10% by 2050, demonstrating Wales’s status as a volunteering nation”. This means reaching a figure of 30% by 2050. This milestone was met in 2022 to 2023 and continues to be met based on 2024 to 2025 results.
Loneliness
The National Survey for Wales collects data using the De Jong Gierveld loneliness scale which covers 6 measures of emotional and social loneliness.
A question on loneliness was not included in the financial year 2024 to 2025 National Survey for Wales. In 2022 to 2023, based on all 6 measures, 13% of people in Wales were found to be lonely, the same as in 2021 to 2022 and 2020 to 2021, and lower than in 2019 to 2020. However, there were some marked variations in the percentage of people who say they feel lonely across the individual measures.
A breakdown by factors linked to loneliness is available in the 2025 Wellbeing of Wales report.
Figure 5.6: percentage of people feeling lonely by reason and financial year, between 2019 to 2020 and 2022 to 2023
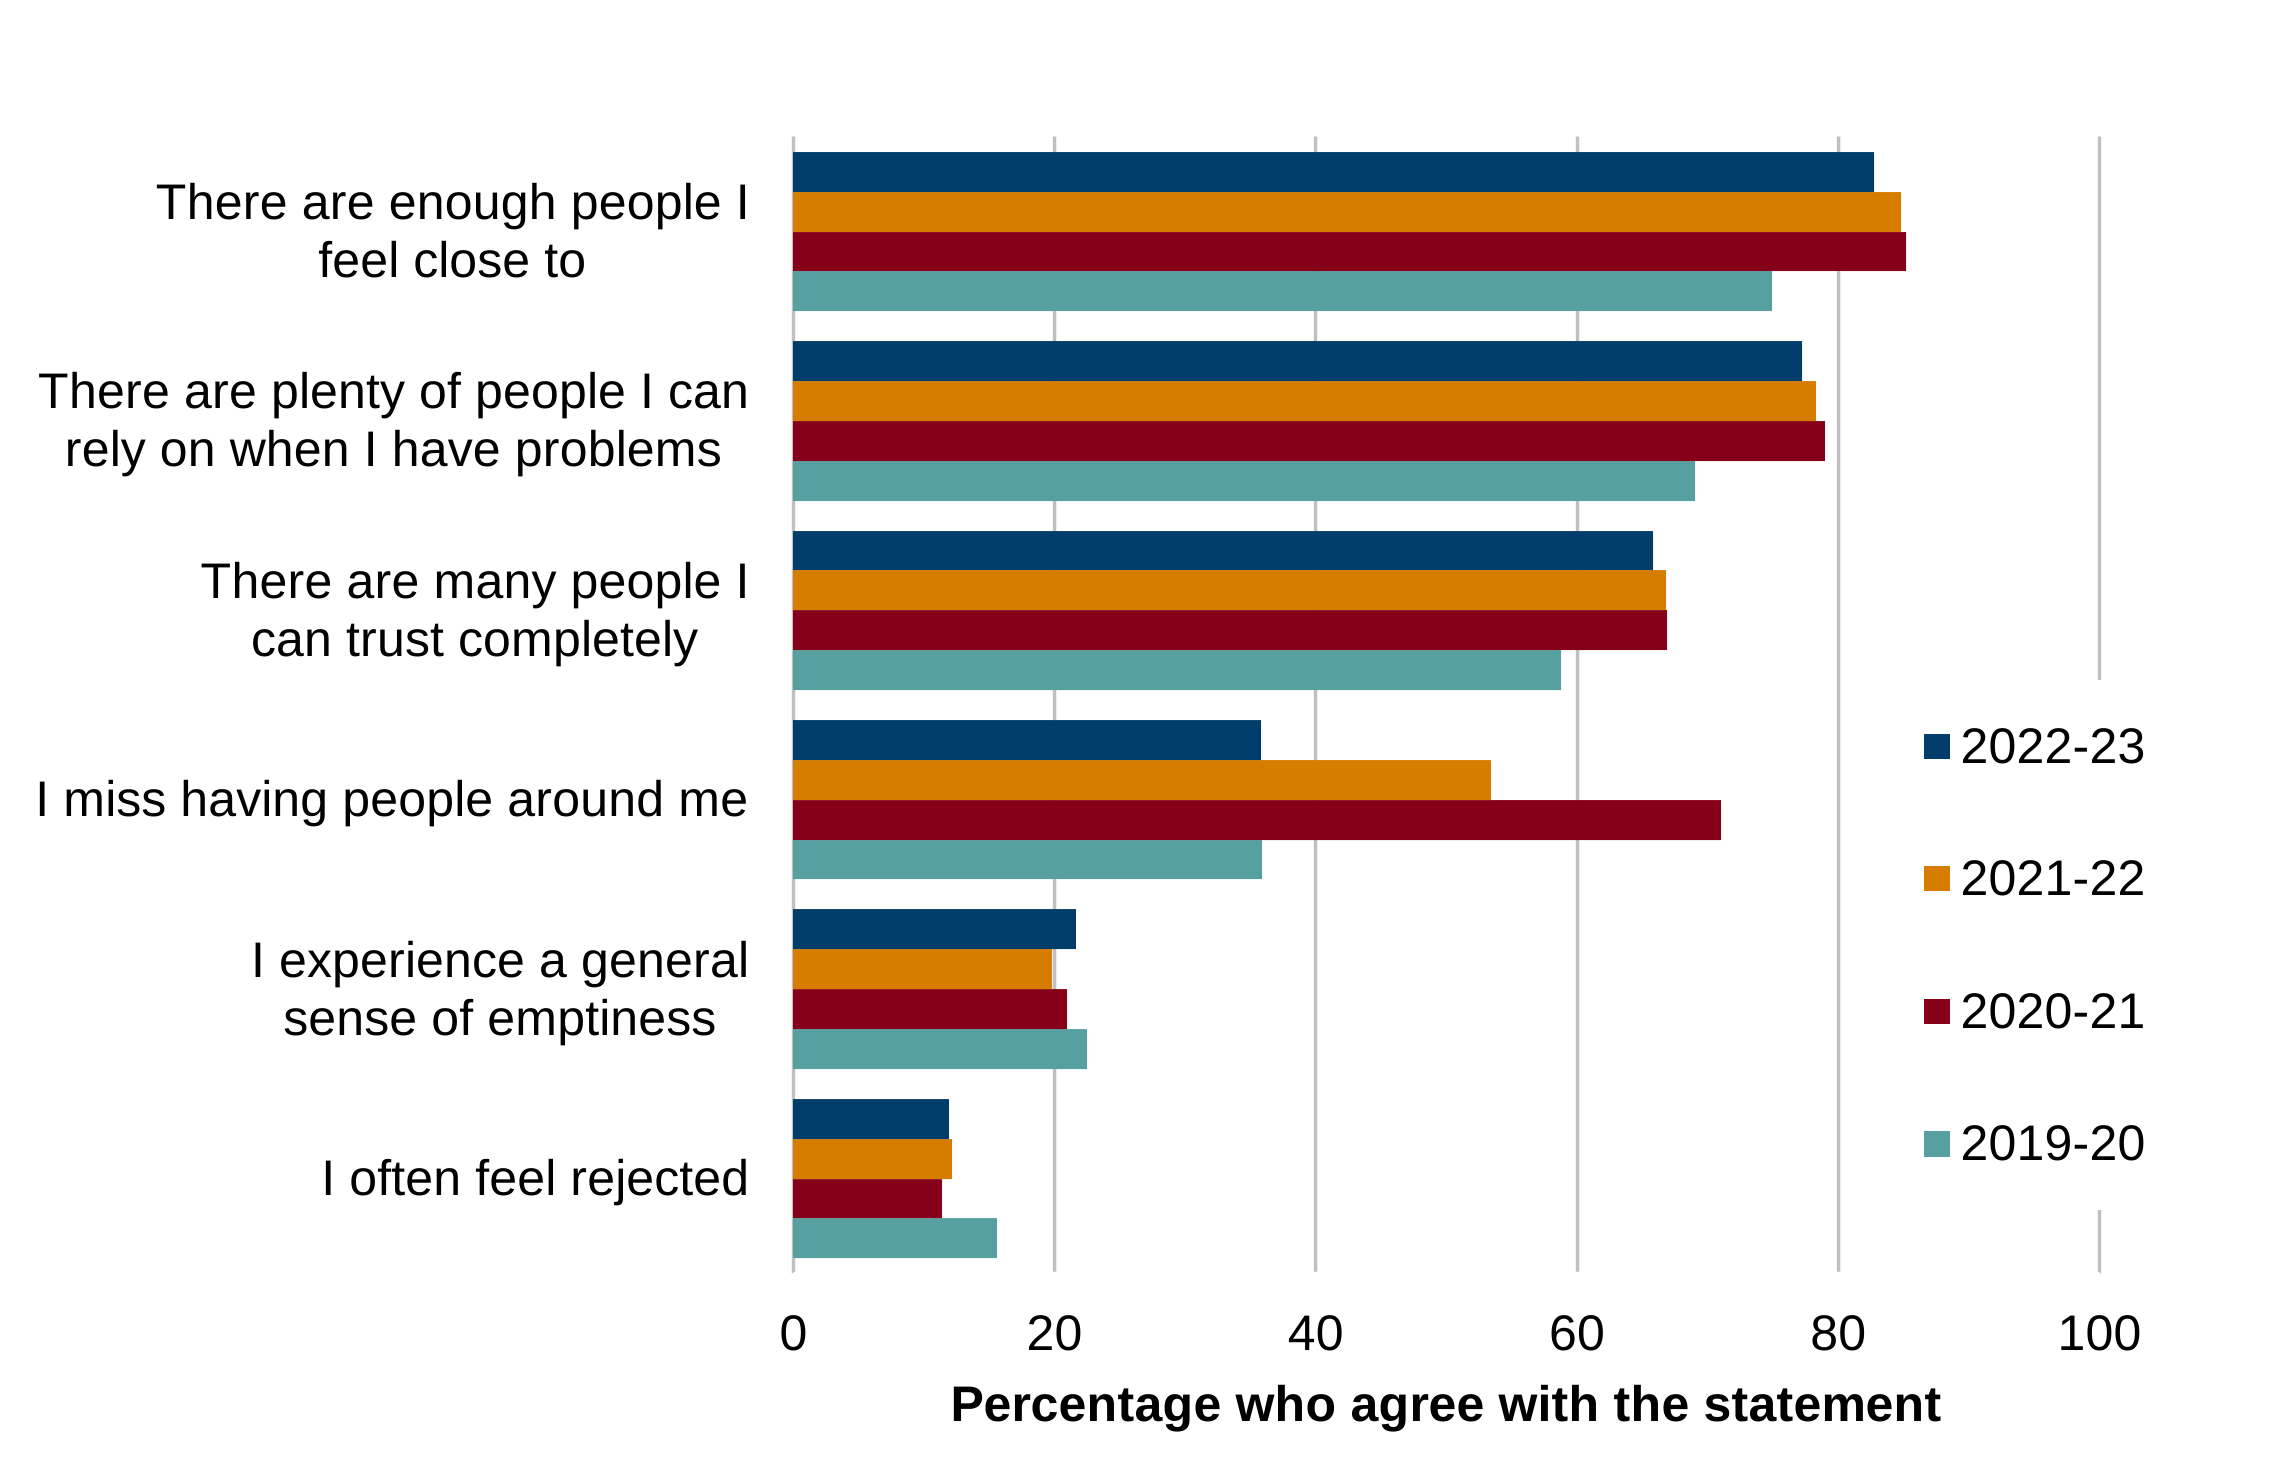
Description of figure 5.6: bar chart showing the results for financial year 2019 to 2020 to financial year 2022 to 2023 and the 6 questions asked to create the measure of loneliness. Overall, the responses to the statements show that people were less lonely in 2022 to 2023 compared with 2019 to 2020.
Source: National Survey for Wales
Digital inclusion
A new national indicator was set in 2021 which will measure the status of digital inclusion. This indicator is currently under development, alongside the development of a minimum digital living standard. Further details on the measure for this indicator will be added as the indicator is developed.
In the meantime, results from the National Survey for Wales in financial year 2024 to 2025 show that 96% of adults personally use the internet at home, work or elsewhere, an increase from 93% observed in 2020 to 2021, 2021 to 2022 and 2022 to 2023.
A breakdown by factors linked to use of the internet is available in the 2025 Wellbeing of Wales report.
Homelessness
In the past year the percentage of households successfully prevented and relieved from homelessness has slightly increased, whilst the number of individuals in temporary accommodation has decreased, as has the estimated number of individuals sleeping rough.
Prevention of homelessness
Among households in Wales threatened with homelessness between April 2025 and March 2026, homelessness was successfully prevented for at least 6 months in 61% of cases (4,671 households). This is slightly higher than in both 2024 to 2025 (59% (r)) and 2023 to 2024 (58%). However, it remains below the levels between 2017 to 2018 and 2021 to 2022, when homelessness was successfully prevented in around two thirds of cases (66%).
Relief from homelessness
Homelessness is “relieved” when a local authority helps a person secure suitable accommodation which is likely to be available for at least six months, meaning they are no longer homeless. The proportion of households successfully relieved from homelessness remained relatively stable from 2016 to 2017 to 2019 to 2020. However, it has been decreasing since then, from 41% in 2019 to 2020 to 25% in 2024 to 2025. During 2025 to 2026 this figure increased by 2 percentage points to 27% (3,351 households).
Figure 5.7: percentage of households successfully prevented and relieved from homelessness, between financial years 2015 to 2016 and 2025 to 2026
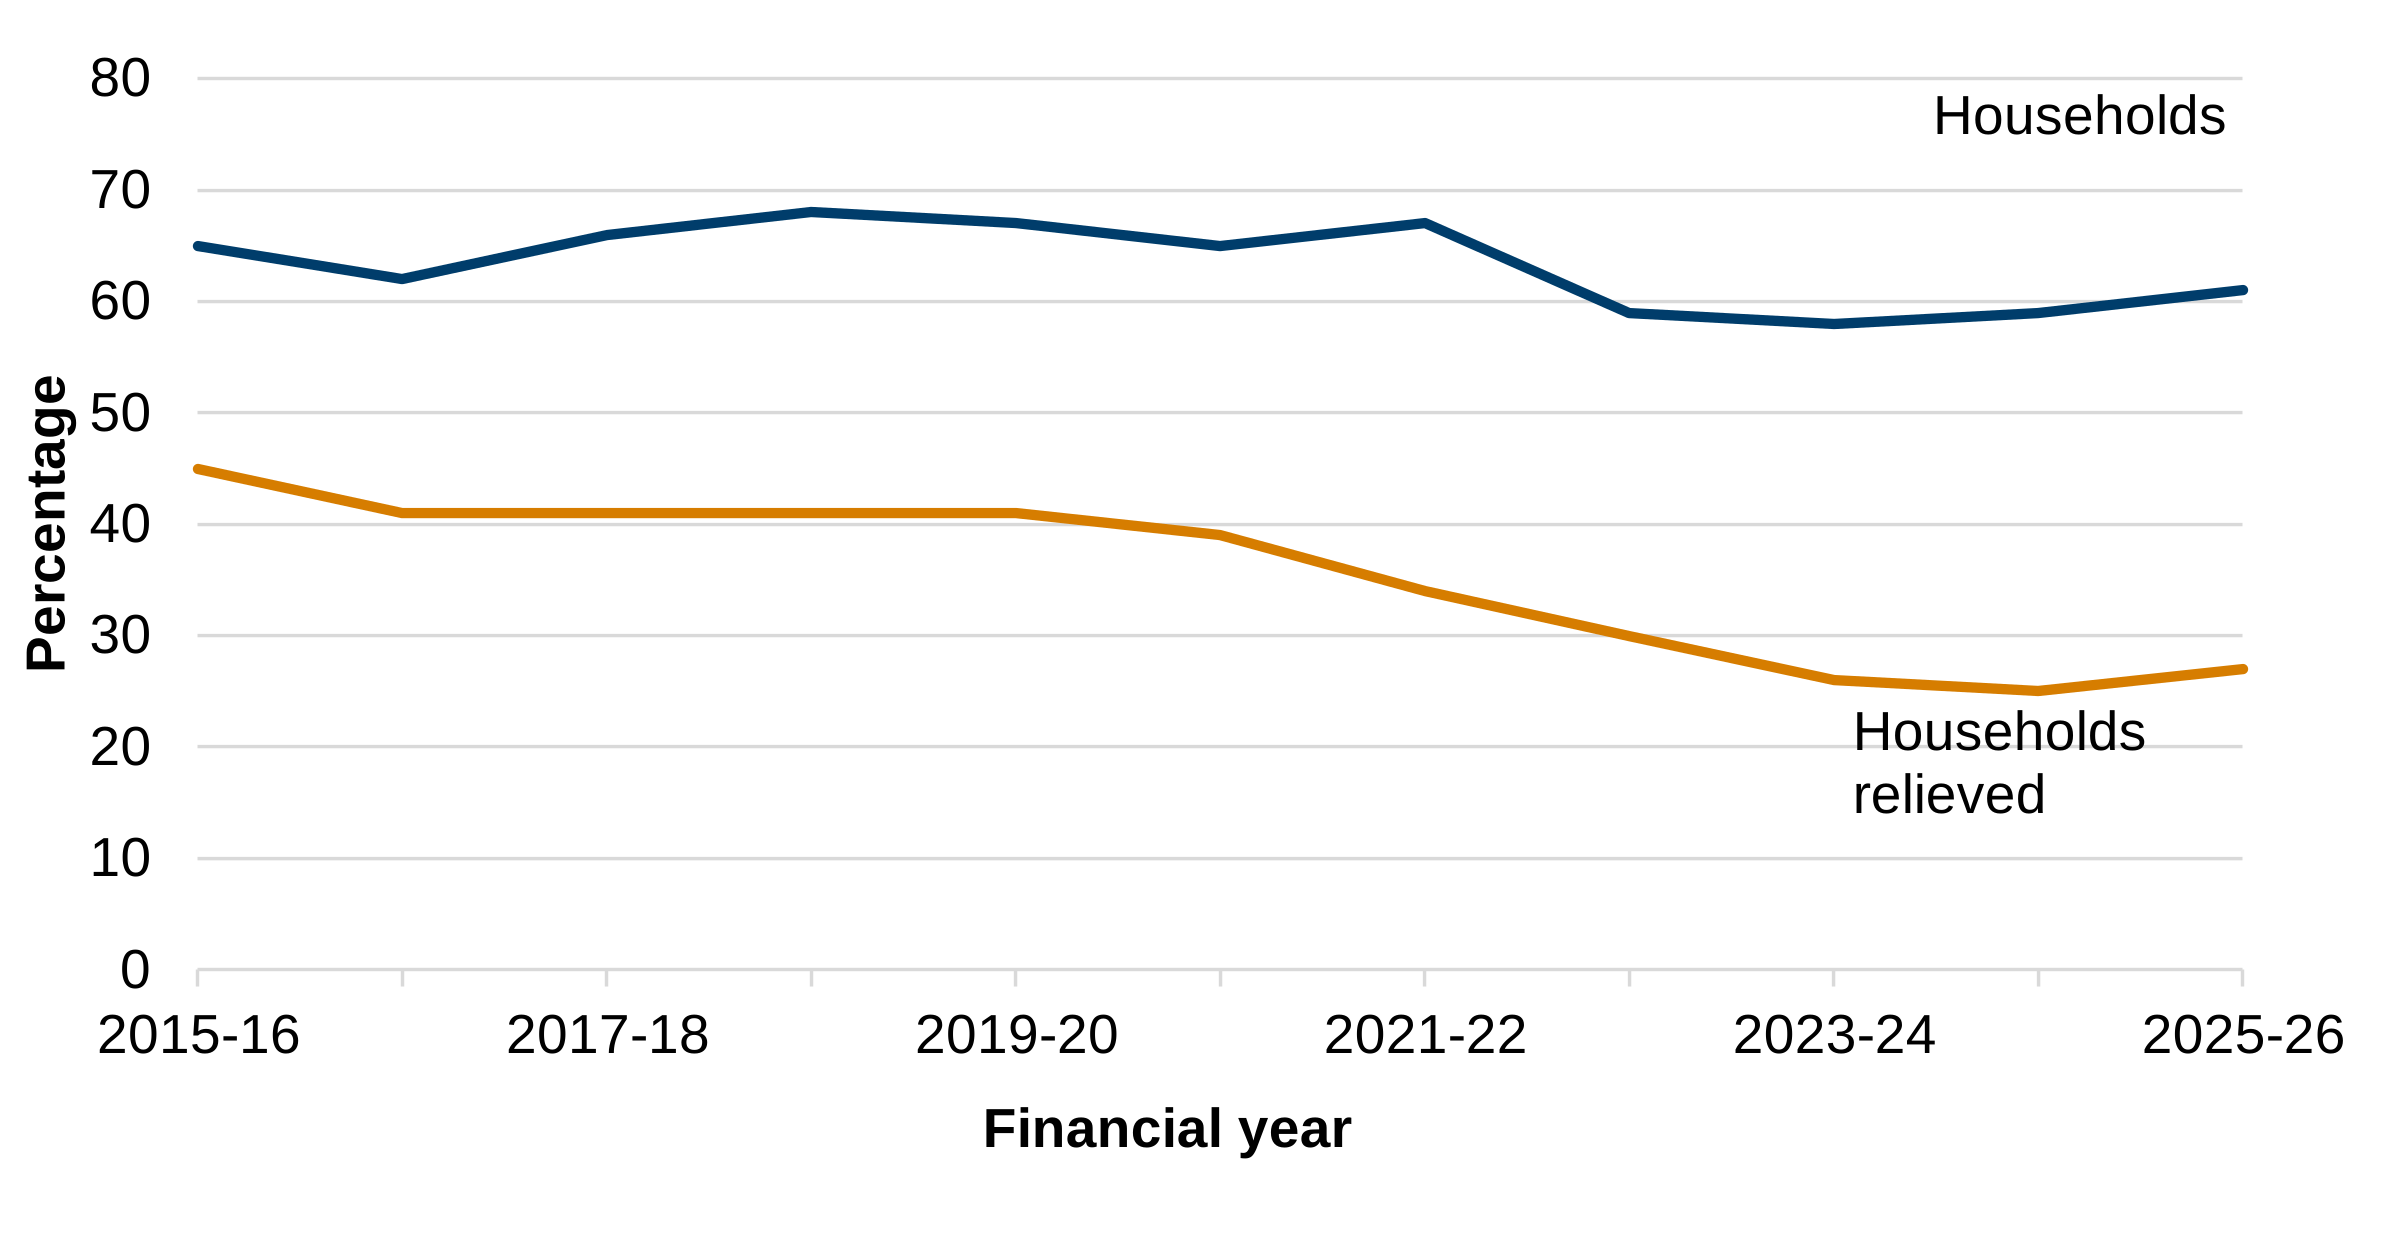
Description of figure 5.7: line chart showing that the percentage of households prevented from homelessness has remained fairly stable in recent years following a drop in financial year 2022 to 2023. The percentage of households relieved from homelessness fell between April 2020 and March 2025 but has increased slightly in the latest year.
Source: Statutory Homelessness: Key Indicators
Temporary accommodation
Monthly information shows that on 30 June 2026, 10,339 individuals were in temporary accommodation, lower than the number recorded during June in each of the last 3 years. 2,227 of these were dependent children aged under 16, which is also lower than the number recorded during June in each of the last 3 years.
The most common type of temporary accommodation was local authority stock (2,502). This is followed by bed and breakfast and hotels (2,493), private sector accommodation (1,980) and hostels (1,939). This is the first time that local authority stock has accommodated a greater number of individuals than bed and breakfast and hotel accommodation.
Rough sleeping
As of 30 June 2026, there were an estimated 158 individuals sleeping rough throughout Wales. This is lower than the number recorded on 30 June 2025 (169) and 30 June 2023 (173) but higher than that recorded on 30 June 2024 (153).
The local authorities reporting the highest numbers of individuals sleeping rough were Cardiff (39), Pembrokeshire (24), Torfaen (19), Bridgend (16) and Ceredigion (14). All other local authorities reported 8 or fewer individuals sleeping rough, with 4 local authorities reporting zero.
Crime and justice
Confidence in the justice system
The national indicator measures the percentage of people who have confidence in the justice system. The justice system is wide and complex, with criminal and non-criminal aspects that require capturing in this indicator. 3 metrics have been selected to measure this indicator: perceived effectiveness of the criminal justice system, perceived fairness of the criminal justice system, and accessibility of the non-criminal justice system.
To assess perceptions of the criminal justice system, the Crime Survey for England and Wales (CSEW) asks people aged 16 years and over whether:
- they are confident that the criminal justice system as a whole is effective
- they agree that the criminal justice system as a whole is fair
Just under half (46%) of all respondents in Wales were confident that the criminal justice system as a whole was effective in the financial year 2025 to 2026 CSEW. This has decreased compared to the 2019 to 2020 survey (54%) and the 2022-23 survey (53%).
63% of respondents in Wales agreed that the criminal justice system as a whole was fair in the 2025 to 2026 CSEW, which is broadly similar to all recent years in the survey.
To assess perceptions of the justice system beyond criminal justice, the accessibility of justice score from the Legal Needs Survey (conducted by the Law Society and the Legal Services Board) has been used. This score measures the degree to which someone thinks the justice system (excluding criminal justice) is accessible, considering issues such as ease of access, fairness and efficiency.
In the 2023 Legal Needs Survey, around 1 in 4 people in Wales (24%) had a low score, indicating that they thought justice was not accessible. This has increased since 19% in the 2019 survey. The proportion of people with high scores, indicating they thought that justice was very accessible, decreased to 17% (from 24% in 2019), while the proportion of people with medium scores was similar (59% in 2023 compared to 58% in 2019). When respondents in Wales were asked to assess their confidence that they could achieve a fair or good outcome at the beginning of their legal issue, around a third of respondents mainly or strongly disagreed (21% and 11% respectively) that they were confident. This suggests that a substantial proportion lacked confidence in securing a fair outcome, potentially reflecting perceived complexity, power imbalances, or previous experiences of legal processes.
Victims of crime and perceptions of crime
In financial year 2025 to 2026, 4% of adults in Wales were victims of crime (reduced from 6% in the previous year) and 1% were victims of personal crime (reduced from 2% in the previous year). There has been a general downward trend in the available time series from 2015 to 2016 when the percentages were 15% and 4%.
Latest data on perceptions of crime in 2025 to 2026 shows half of people in Wales (50%) believe crime has risen a lot nationally in recent years. This has increased from 41% in 2022 to 2023, and is similar to the pre-pandemic levels of 53% in 2018 to 2019 and 2019 to 2020 (there is no available data for 2020 to 2021 or 2021 to 2022).
The percentage of those believing crime in their local area has risen a lot is much smaller (15%). This figure has returned to pre-pandemic levels observed in 2018 to 2019 and 2019 to 2020 after dropping to 11% in 2022 to 2023.
Police recorded crime
Police recorded crime in Wales (excluding fraud) decreased by 3% in financial year 2025 to 2026 compared with the previous year. Violence against the person decreased by 2%, although the rate per 1,000 of the population remains considerably higher than a decade ago.
There were increases in 5 of the 9 main offence categories in 2025 to 2026 compared with the previous year, including robbery (increased by 64%) and possession of weapons offences (increased by 16%), although these categories are the 2 smallest in terms of the number and rate of offences.
Among the other main offence categories, there were increases in sexual offences (increased by 9%) and miscellaneous crimes against society (increased by 8%), whilst there was a decrease in theft (decreased by 9%).
Data on reported fraud and computer misuse offences is not available for the year ending March 2026 due to the creation of a new national fraud and cybercrime reporting system. For the year ending September 2025, the latest available data for recorded fraud and computer misuse statistics, the rate per 1,000 of the population was 5, representing a 6% increase from the previous year.
Figure 5.8: police recorded crime per 1,000 population, between financial years 2002 to 2003 and 2025 to 2026
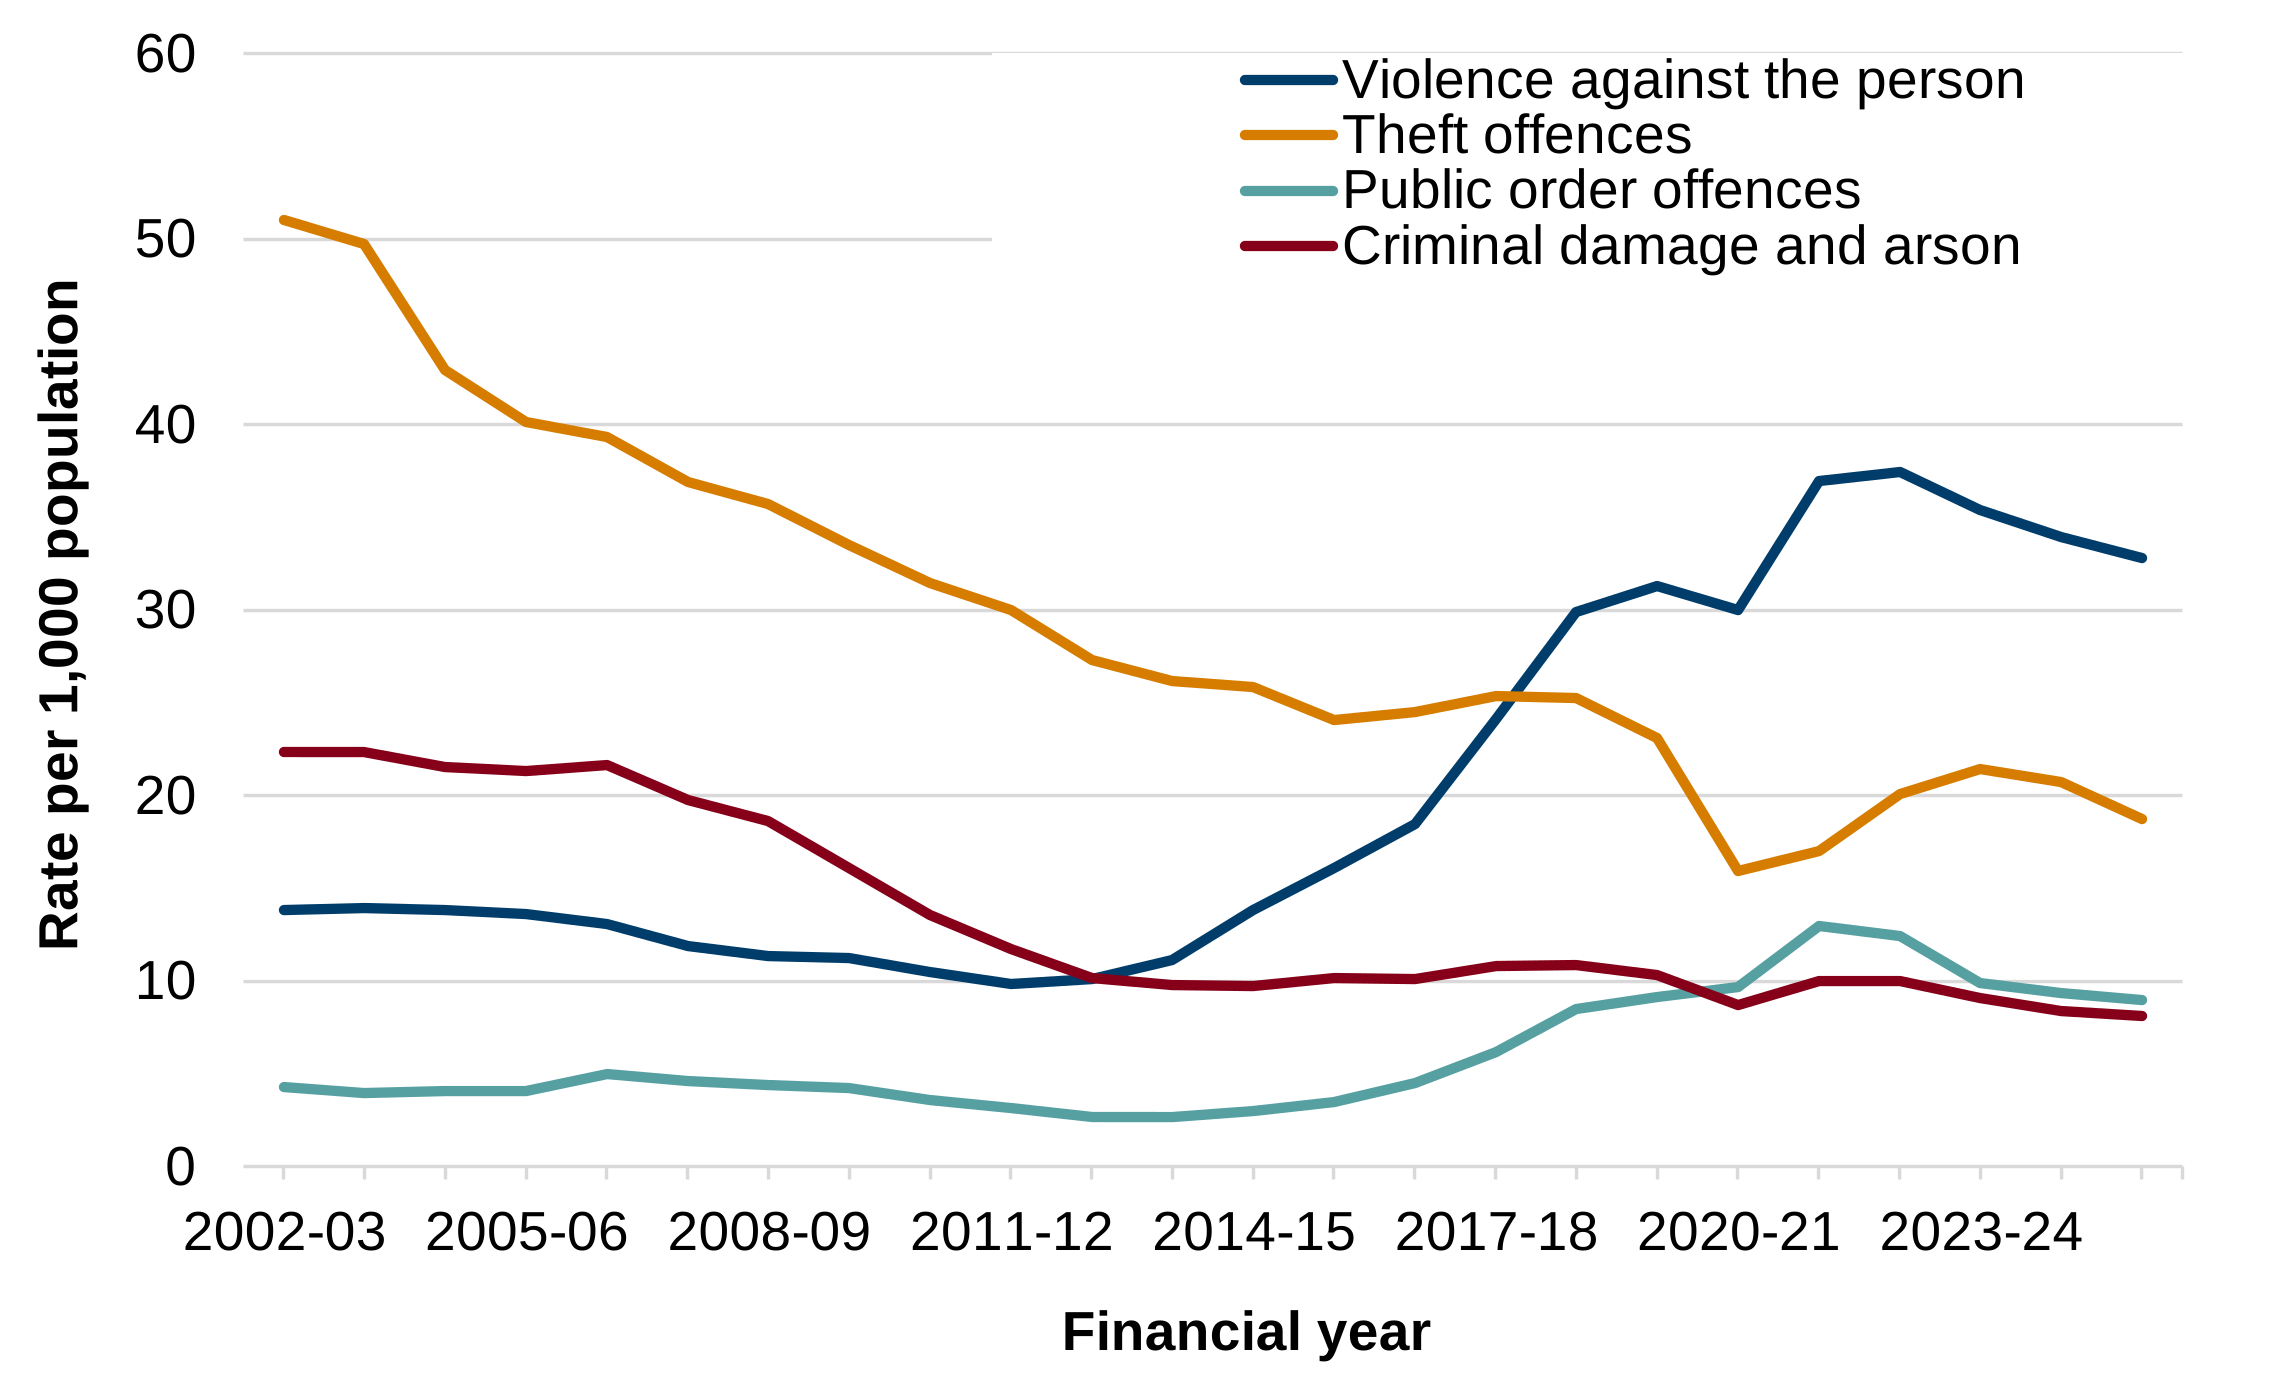
Description of figure 5.8: line chart showing the rate of police recorded crime per 1,000 population has fallen for all 4 categories during the latest period.
Theft offences have seen the biggest change, falling from more than 50 per 1,000 population in 2002 to 2003 to around 20 per 1,000 population in recent years. The rate of violence against the person offences showed a large increase between 2013 and 2023, but has reduced slightly in each of the last 3 years. Criminal damage and arson saw a fall in rates until 2012 to 2013 but since this time has remained stable. Public order offences had the lowest rate per 1,000 population until 2020 to 2021 when the rate rose above that of criminal damage and arson.
Source: Police Recorded Crime, Office for National Statistics
Hate crime
There was a 5% increase in police recorded hate crimes across Wales in financial year 2024 to 2025 compared to 2023 to 2024. This rise follows two annual decreases in recorded hate crimes and is the second highest number of recorded hate crimes in Wales since the Home Office began collecting comparable England and Wales data in the year ending March 2013.
There were 6,213 recorded hate crimes across the 4 Welsh police force areas, of which:
- 63% were race hate crimes
- 18% were sexual orientation hate crimes
- 12% were disability hate crimes
- 7% were religion hate crimes
- 5% were transgender hate crimes
Compared to 2023 to 2024, there was a 30% increase in the number of hate crimes with religion as a recorded motivating factor in Wales. While detailed religious group breakdowns are not available for Wales, at the England and Wales level (excluding the Metropolitan Police Service (MPS)) there was a 19% increase in religious hate crimes targeted at Muslims, which spiked in August 2024 coinciding with the Southport murders. The number of religious hate crimes targeted at Jewish people fell by 18%, however caution is needed with these figures as they exclude the MPS who recorded 40% of all religious hate crimes targeted at Jewish people in the last year. This fall follows a 113% increase in these offences in the year ending March 2024 (which included the MPS data), with a spike in these offences after the beginning of the Israel-Hamas conflict.
There was also an increase in recorded hate crimes in Wales with race as a motivating factor (up 8%), while hate crimes with disability, sexual orientation and transgender status as recorded motivating factors decreased (for disability and sexual orientation this is the third annual decrease in a row):
- 8% decrease (306 to 282) in transgender hate crimes
- 3% decrease (1,139 to 1,103) in sexual orientation hate crimes
- 2% decrease (752 to 739) in disability hate crimes
- 8% increase (3,632 to 3,911) in race hate crimes
- 30% increase (346 to 451) in religion hate crimes
Whilst providing a good measure of the hate crime-related demand on the police, due to police forces making significant improvements in how they record crime since 2014, as well as improvements in identifying what constitutes a hate crime, police recorded crime figures do not currently provide reliable trends in hate crime. Figures from the police should also not be seen as a measure of prevalence of hate crime.
Further reading
What factors are linked to people feeling safe in their local area?
What factors are linked to people being satisfied with the area that they live in?
What factors are linked to people feeling able to influence decisions affecting their local area?
What factors are linked to people agreeing that their local area has a sense of community?
Loneliness (National Survey for Wales): April 2022 to March 2023
Communities and local areas (National Survey for Wales): April 2024 to March 2025
Loneliness Inequalities Evidence Review (Wales Centre for Public Policy)
Towards a Welsh Minimum Digital Living Standard: citizen and stakeholder perspectives