New house building: April to June 2026
Information on new dwellings started (where building work has commenced) and new dwellings completed (where building work has finished and the dwelling is ready for occupation), for April to June 2026.
In this page
Introduction
The information is based on the reports of local authority building inspectors and the National House Building Council (NHBC). It does not include information from other private approved inspectors, likely resulting in an undercount in the total number of new dwellings started and completed (see notes). The information in this report covers quarter 1 of the 2026 to 2027 financial year (April to June 2026).
Main points
Figure 1: number of new dwelling starts and completions, between quarter 1 2017 to 2018 and quarter 1 2026 to 2027
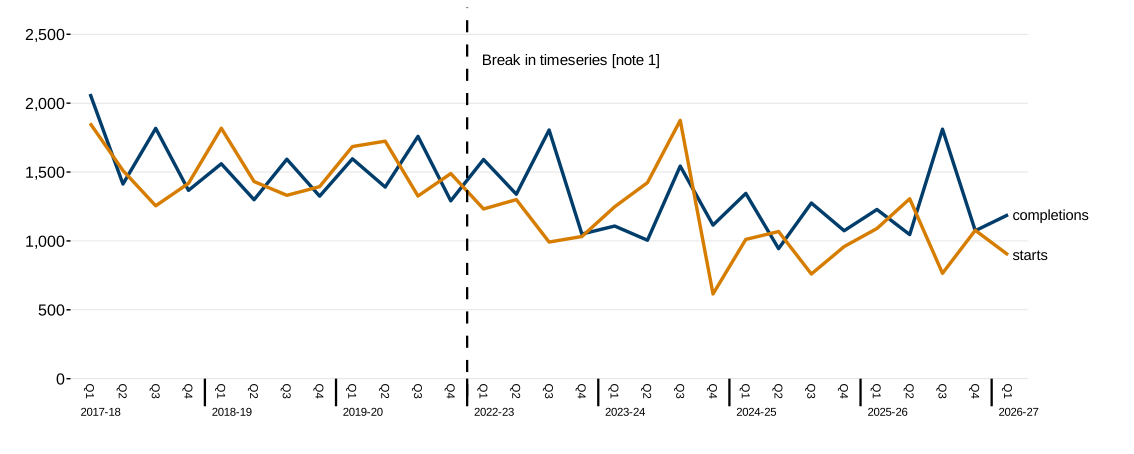
Description of figure 1: a line chart highlighting a general decline in new house building activity between quarters 1 of 2017 to 2018 and 2026 to 2027. Whilst the number of new dwelling starts has declined in the most recent year, the number of new dwelling completions has risen.
Source: local authority building inspectors and NHBC data
[Note 1] quarterly data was not collected for 2020 to 2021 or 2021 to 2022 due to the coronavirus (COVID-19) pandemic.
Between April and June 2026:
- 899 new dwellings were started, 18% fewer than the same quarter of 2025 (1,090)
- 1,190 new dwellings were completed, 3% fewer than the same quarter of 2025 (1,228)
- two-thirds (67%) of all new dwelling completions contained 3 or more bedrooms
- most new dwelling completions were accounted for by the private sector (80%), with a smaller proportion accounted for by local authorities and Registered Social Landlords (RSLs) (20%) (tenure information should be treated with caution, please see notes for details)
Notes
Due to rounding, some figures may not add up to 100%.
This data is based on the reports of local authority building inspectors and the NHBC, a private approved inspector. It does not include information from other private approved inspectors, likely resulting in an undercount in the total number of new dwellings started and completed. It is sometimes difficult for building control officers and NHBC to identify the intended final tenure of the property (the basis for the tenure information). This may lead to an under-count for the social sector and an over-count for the private sector. Within the social sector it may also lead to an under-count of local authority new house building and an overcount of RSL house building. Therefore, the tenure data should be treated with caution.
Both starts and completions will be influenced by quarterly fluctuations, including the timing of starts and completions on large sites in some authorities and seasonal factors such as holidays and weather. These statistics are not seasonally adjusted.
We also publish separate statistics on affordable housing provision. The figures cover all additional affordable housing units, whether through:
- new build
- purchase
- acquisition
- leasing
- conversion of existing dwellings
The statistical article Feasibility of using administrative data sources to measure new housing supply, published in May 2026, explores the feasibility of using Energy Performance Certificate (EPC) data, council tax billing data and Ordnance Survey (OS) data to quality assure the information presented in this statistical series. It is anticipated that an update to this work will be published in early 2027. We welcome any comments or suggestions from users on this work. Your views and feedback help us to maximise the quality and value of our statistics. Please get in touch with us at stats.housing@gov.wales.
Main points and StatsWales data are published quarterly and a report is published annually. The information published on StatsWales includes local authority level data as well as the number of new dwellings completed by dwelling type and number of bedrooms.