
Permanent and fixed-term exclusions from schools: September 2024 to August 2025
Data on all pupils in maintained primary, middle, secondary and special schools and pupil referral units for September 2024 to August 2025.
In this page
Introduction
This release reports on exclusions from schools for pupils in maintained primary, middle, secondary and special schools and those in both school and educated other than at school (EOTAS) provision, including Pupil Referral Units (PRU).
Exclusions can be split by the length and type of exclusion. The 3 categories used in our data are:
- fixed-term exclusions (5 days or less)
- fixed-term exclusions (over 5 days)
- permanent exclusions
Further detail can be found in the quality report.
The figures below show the rate of exclusions per 1,000 pupils over time; the shaded areas show years affected by the coronavirus (COVID-19) pandemic.
The most recent data was collected in Spring 2026 and includes exclusions during the 2024 to 2025 academic year.
Main points
In 2024 to 2025, fixed-term exclusions (5 days or less) have increased since 2023 to 2024 and reached the highest rate since 2011 to 2012. However, both permanent and fixed-term exclusions (over 5 days) have decreased over the same period.
- The rate of permanent exclusions has decreased to 0.8 per 1,000 pupils in 2024 to 2025, compared to 1.0 per 1,000 pupils in 2023 to 2024
- The rate of fixed-term exclusions of over 5 days has decreased to 2.4 per 1,000 pupils in 2024 to 2025, compared to 2.7 per 1,000 pupils in 2023 to 2024.
- The rate of fixed-term exclusions of 5 days or less has increased to 75.7 per 1,000 pupils in 2024 to 2025, compared to 73.2 per 1,000 pupils in 2023 to 2024.
- The rate of fixed-term exclusions is almost 3.9 times higher for those eligible for free school meals (FSM) than those not eligible for FSM in 2024 to 2025. For permanent exclusions the value is 5.2 times higher. This is an increase from 2023 to 2024 in both cases.
- The rate of fixed-term exclusions is almost 4.8 times higher for those with additional learning needs (ALN) than those without ALN in 2024 to 2025. For permanent exclusions the value is 5.3 times higher. This is an increase from 2023 to 2024 in both cases.
Figure 1: rate of fixed-term exclusions (5 days or less), 2011 to 2012 onwards

Description of figure 1: a line graph showing the rate of fixed-term exclusions of up to 5 days per 1,000 pupils. The rate increased slowly from 26.7 exclusions per 1,000 pupils in 2013 to 2014 to 41.0 exclusions per 1,000 pupils in 2018 to 2019. During the COVID-19 pandemic the rate dropped primarily due to schools being closed to most pupils for long periods. In the most recent year for which there is data, 2024 to 2025, the rate has increased to 75.7 per 1,000 pupils, the highest value recorded.
Source: Pupil Level Annual School Census (PLASC).
Figure 2: rate of fixed-term exclusions (over 5 days), 2011 to 2012 onwards

Description of figure 2: a line graph showing the rate of fixed-term exclusions of more than 5 days per 1,000 pupils from 2011 to 2012 onwards. The rate had fallen from 2.3 exclusions per 1,000 pupils in 2011 to 2012 to 1.7 per 1,000 pupils in 2018 to 2019, falling again during COVID-19. During the COVID-19 pandemic the rate dropped primarily due to schools being closed to most pupils for long periods. In the most recent year for which there is data, 2024 to 2025, the rate has fallen to 2.4 exclusions per 1,000 pupils, compared to 2.7 per 1,000 pupils in 2023 to 2024.
Source: Pupil Level Annual School Census (PLASC).
Figure 3: rate of Permanent Exclusions, 2011 to 2012 onwards
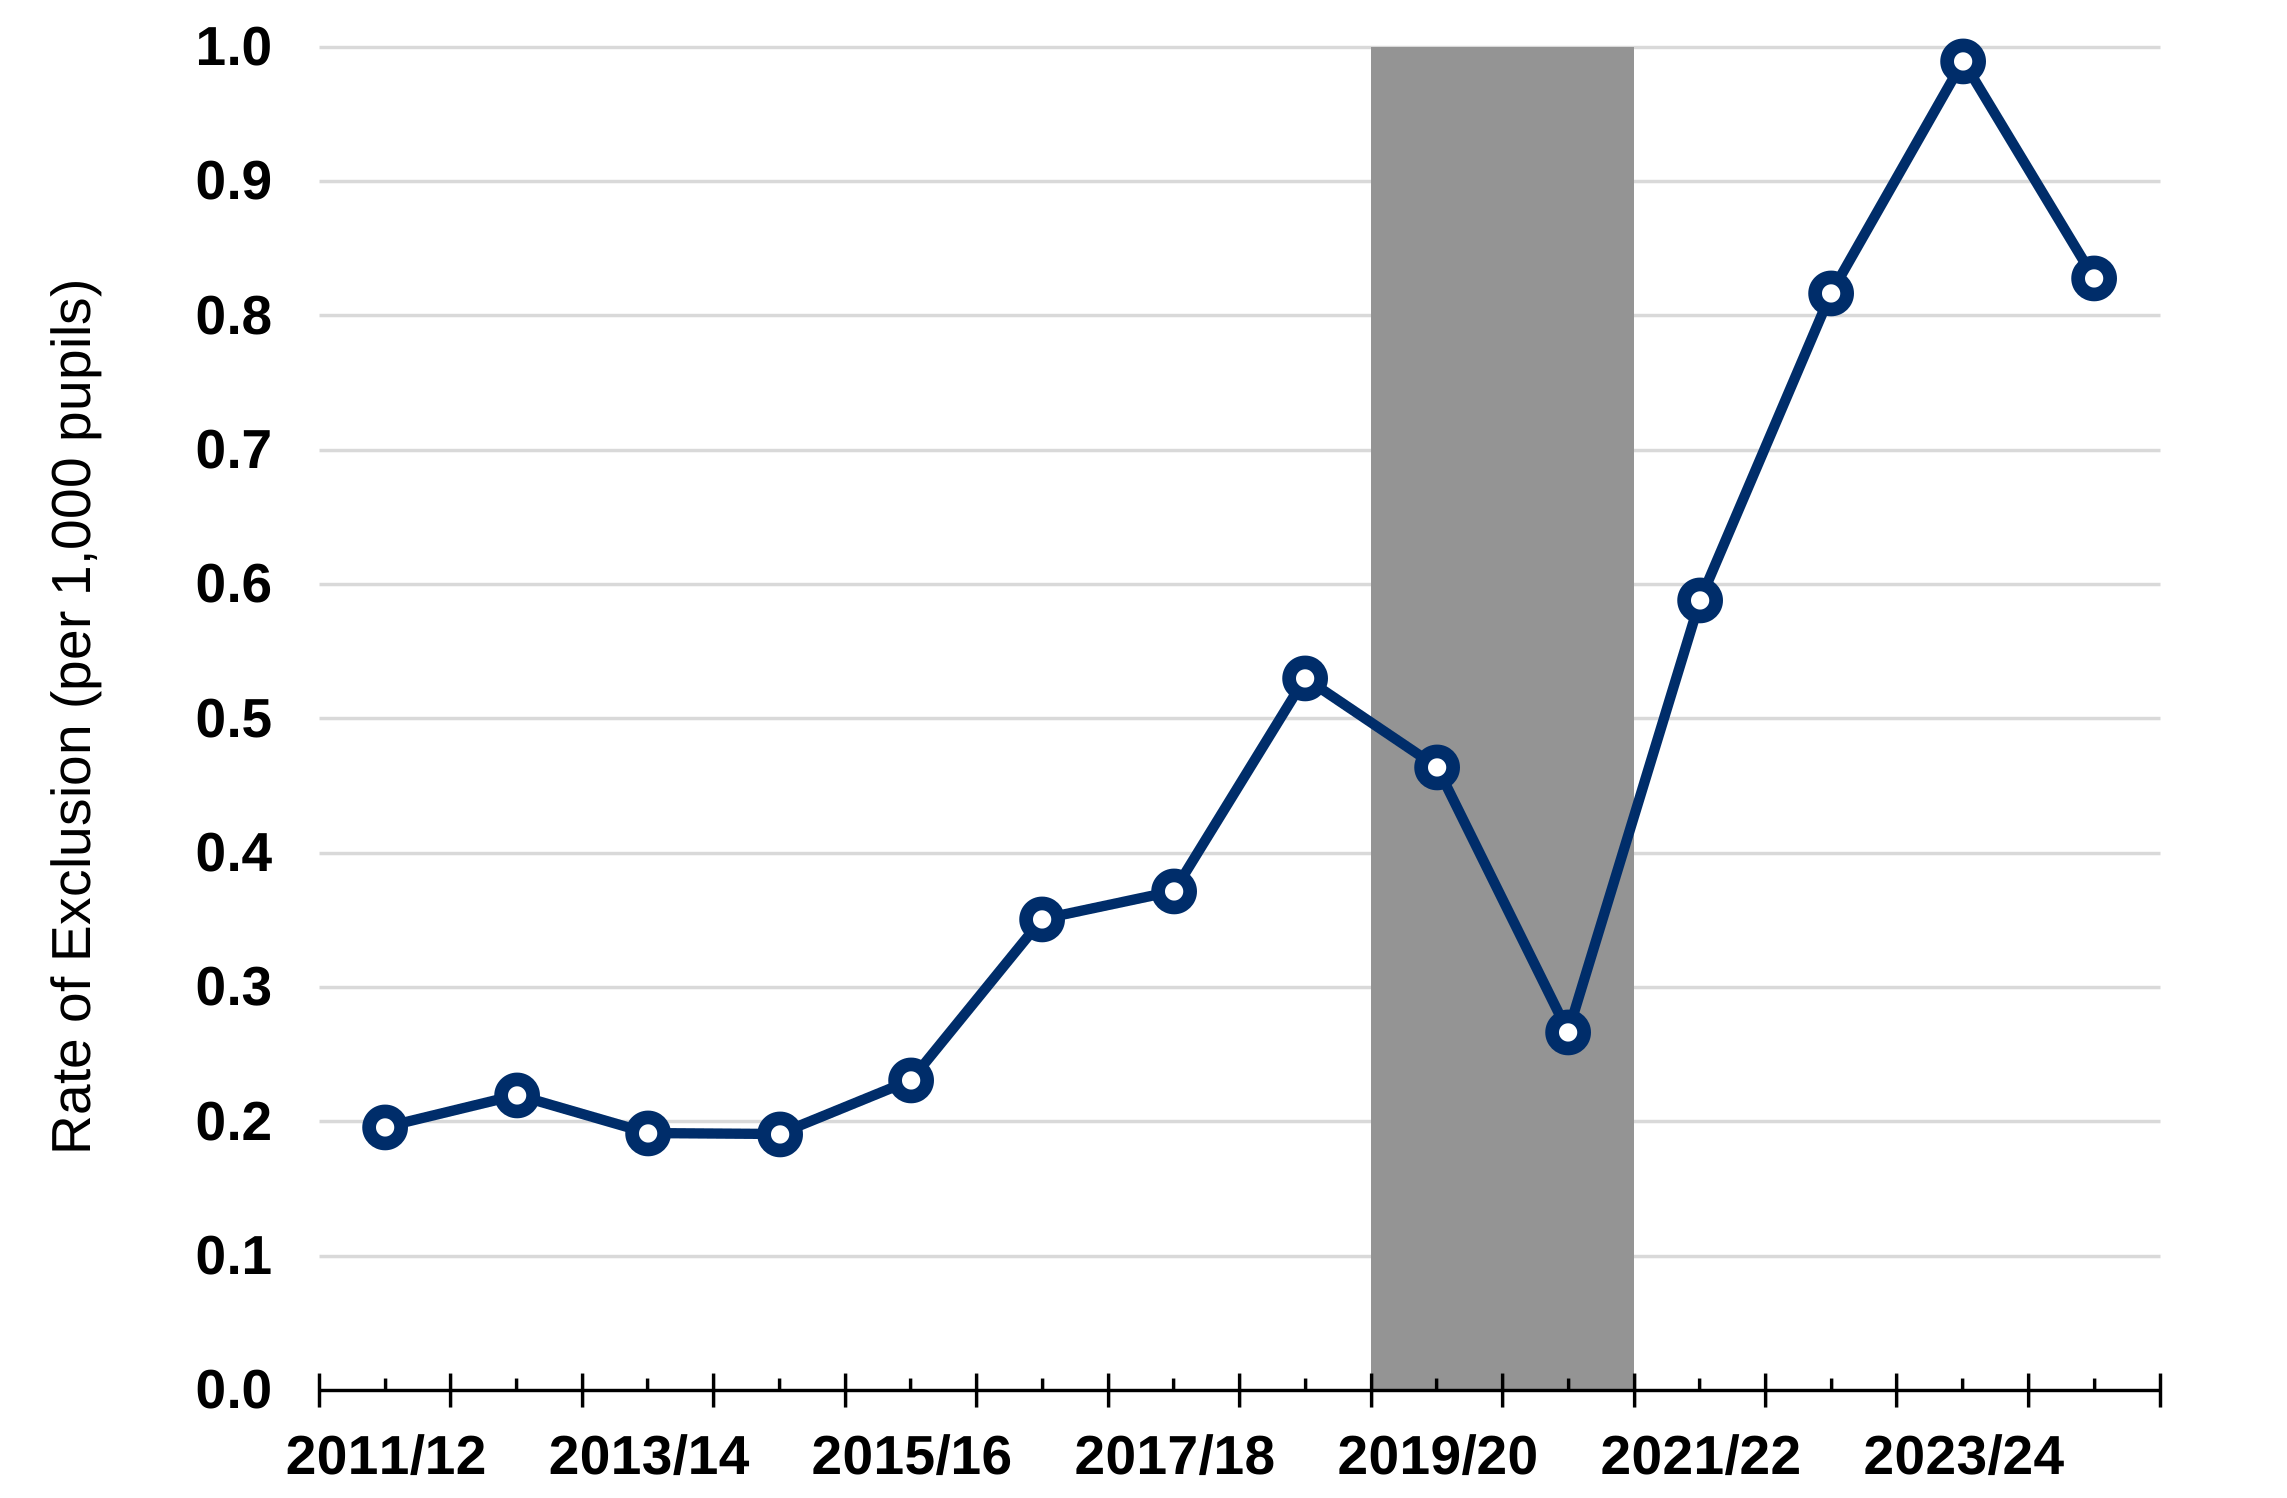
Description of figure 3: a line graph showing the rate of permanent exclusions per 1,000 pupils. The rate increased steadily from 0.2 per 1,000 pupils in 2011 to 2012 to 0.5 per 1,000 pupils in 2018 to 2019. During the COVID-19 pandemic the rate dropped primarily due to schools being closed to most pupils for long periods. In 2024 to 2025 it decreased to 0.8 per 1,000 pupils.
Source: Pupil Level Annual School Census (PLASC)