Prescriptions in Wales: April 2021 to March 2022
Data on net ingredient cost and number of items prescribed by GPs and dispensed in the community for April 2021 to March 2022.
In this page
Introduction
There are two main sections in this report:
- ‘GP prescriptions’ which are items prescribed by GPs or on behalf of GPs in Wales and dispensed within the community in Wales or elsewhere in the UK.
- ‘UK comparisons’ which use slightly different data called ‘prescriptions dispensed in the community’ which are items prescribed by any prescribing health professionals in the UK that were subsequently dispensed in the community in Wales.
GP prescriptions data are the primary focus of this report because it demonstrates which medicines and appliances are being prescribed in Welsh GP practices. Therefore, it is recommended that the majority of readers should use GP prescriptions data for their analysis.
Prescriptions dispensed in the community are secondary data but should be used when making comparisons across countries in the UK.
Items refer to each different drug or appliance listed on a prescription regardless of quantity or volume. Only items which are dispensed are counted.
Items prescribed and dispensed within hospitals are not counted in either dataset, but if a prescription was written by a hospital doctor and later dispensed at a community pharmacy (i.e. a high street pharmacy), it would be counted in the secondary source of prescriptions dispensed in the community.
A comparison between the sources is provided in Table 1 and further details are provided in the Which data should I use? section.
Main points
- 82.8 million items were prescribed by GPs in Wales and dispensed in the community in 2021-22. This is an increase of 1.7 million (2.1%) items since 2020-21.
- The long-term trend shows large increases in the number of items prescribed and dispensed over time but the increases have slowed in recent years. In the most recent five-year period, the number of items increased by 3.7% compared to an increase of 4.8% in the previous five-year period (2013-14 to 2017-18).
- The number of items prescribed per head of population registered with a GP was 25.5 in 2021-22. This is 0.5 items more than the previous year.
- The British National Formulary (BNF) chapters with the most items prescribed by GPs in Wales and dispensed in the community has been unchanged over the past four years. These were for the cardiovascular system, central nervous system and endocrine system and combined they cover 60% of all items.
- Following two year-on-year increases of greater than 5%, the total net ingredient cost increased marginally (0.3%) in 2021-22, to £626.7 million.
- There are differences between the number of items prescribed and dispensed and their cost at health board level. Fewer items per prescribing unit are prescribed by GPs in Cardiff and Vale and dispensed in the community compared to any other health board, but there are a higher proportion of more expensive items prescribed than in any other health board.
- Five more items were prescribed per prescribing unit in Cwm Taf Morgannwg compared to Cardiff and Vale; however the cost per item in Cwm Taf Morgannwg was a little lower than the Wales average.
- While the differences in the number of items prescribed by deprivation quintile were small, there were more items per head prescribed in the two quintiles with the largest percentage of their populations living in the most deprived areas of Wales (quintiles 1 and 2) than the Wales average.
- Using supplementary data for prescriptions dispensed in the community, more prescription items per head of population were dispensed in Wales than any of the other UK countries. However, a greater proportion of items dispensed in Wales were of relatively low cost, as Wales had the lowest net ingredient cost per prescription item dispensed of all four countries.
GP prescriptions

In 2021-22 there were 82.8 million items prescribed by GPs in Wales and dispensed in the community, the highest on record. This is equivalent to 25.5 items per head of the population registered with a GP in Wales.
Just over 1.7 million more items were prescribed and dispensed in the community in 2021-22 compared to 2020-21, an increase of 2.1%. This is an increase of 0.5 items per head of the population registered with a GP in Wales.
There has been an upward trend over the last five years with 2.9 million more items were prescribed and dispensed in the community in 2021-22 than in 2017-18, an increase of 3.7%. This is an increase of 0.6 items per head of the population registered with a GP in Wales.
In the 15-year period since free prescriptions were introduced, almost 21 million additional items were prescribed and dispensed in the community, an increase of 33.6%. This is an increase of 5.5 items per head of the population registered with a GP in Wales.
The increase since free prescriptions were introduced is smaller than the increase of 27.7 million items (or 80.8%) prescribed in the previous 15-year period (1993-94 to 2007-08).

Note: Figures quoted for net ingredient cost for all years are not adjusted for inflation. Standard adjustments for inflation are not considered appropriate as drug prices are subject to controls under the Pharmaceutical Price Regulation Scheme and to other central controls.
In 2021-22, the total net ingredient cost of all items prescribed by GPs in Wales and dispensed in the community was almost £627 million, equivalent to £193.12 per head of population registered with a GP in Wales.
Total net ingredient costs increased by just less than £2 million or 0.3% in 2021-22 compared with the previous year. The cost per head of population registered with a GP in Wales increased by £0.09.
There has been an upward trend over the last five years as total net ingredient costs increased by just over £48 million or 8.3% in 2021-22 compared to 2017-18. The cost per head of population registered with a GP in Wales has increased by £11.64.
The total net ingredient cost has increased by just over £42 million, or 7.2% in the 15-year period since free prescriptions were introduced in Wales. The cost per head of population registered with a GP in Wales has increased by £4.25.
The increase since free prescriptions were introduced is much smaller than the increase of for the net ingredient cost in the previous 15 year period. The cost in 2007-08 was £352.7 million (or 152.2%) larger than the cost in 1993-94.

The mean cost per item decreased every year between 2003-04 and 2014-15, but has remained relatively stable since, with some year-to-year variations.
In 2021-22 the mean net ingredient cost per item was £7.57. This is £0.14 (or 1.8%) lower than in 2020-21 and £1.86 (or 19.7%) lower than in 2007-08, when free prescriptions were introduced.
The median cost per item had been on a downward trend since March 2004, before increasing each year between March 2019 and March 2021. The decrease in March 2022 is the largest since free prescriptions were introduced.
The median cost per item in March 2022 was £1.64. This is £0.66 (or 28.7%) lower than in March 2021 and £0.99 (or 37.6%) lower than in March 2007, the last month before free prescriptions were introduced.
Note that the mean is defined as: the total net ingredient cost for all prescription items, divided by the total number of prescription items for the whole calendar year.
The median is defined as: the middle amount when all costs per item are ranked in order from cheapest to most expensive; half of all costs are less than or equal to this amount, and the other half are more than or equal to this amount.
The median is much smaller than the mean as there are a relatively low number of items with a very high net ingredient cost. These high-cost items will have a greater impact on the mean than the median. The median is more appropriate to use for the cost of more ‘common’ prescription items.
Therapeutic classes

Prescription items and cost by area and BNF chapter - time series (StatsWales)
Half of all items prescribed in Wales were for the treatment of conditions of the cardiovascular or central nervous systems.
23.7 million items were prescribed for treatment of the cardiovascular system, equal to 7.8 items per head of population registered with a GP in Wales.
17.4 million items were prescribed for the treatment of the central nervous system, equal to 5.4 items per head of population registered with a GP in Wales.

Prescription items and cost by area and BNF chapter - time series (StatsWales)
Although the number of items prescribed for treatment of the cardiovascular and central nervous systems accounted for half of the total items prescribed (Chart 4), the net ingredient cost (NIC) for the same classes only accounted for just under a third (32.0%) of the total (Chart 5).
Analysis by local health board
Chart 6 shows how the number of items prescribed and the net ingredient cost (NIC) of those items differed between health boards. To account for the different age profiles of each health board, the chart shows items and NIC per prescribing unit (PU). Prescribing units are calculated by giving a greater weight (by a factor of three) to the registered population aged 65 or over. They have been adopted to take account of elderly patients’ greater needs for medication and so to make more meaningful comparisons between health boards. The remaining differences may be related to relative need and local culture and practice.
Patients registered at GP practices in Wales (StatsWales) data for October 2021 shows that 21% of the patients in Wales were aged 65 or over. This varied between health boards, with a relatively greater percentage of older people in Powys (27%), Hywel Dda (25%), and Betsi Cadwaladr (23%); the same percentage in Swansea Bay (21%); and a relatively smaller percentage Aneurin Bevan (20%), Cwm Taf Morgannwg (20%) and Cardiff and Vale (16%).


In 2021-20, there were 18.0 items prescribed per prescribing unit in Wales, with an associated net ingredient cost of £136.11 and cost per item of £7.57.
There were large variations between health boards, with 25% fewer items prescribed per prescribing unit in Cardiff and Vale compared to Cwm Taf Morgannwg. The net ingredient cost was also £26.60 lower per prescribing unit in Cardiff and Vale compared to Cwm Taf Morgannwg; however, Cardiff and Vale had the highest cost per item, per prescribing unit of all health boards, while the cost per item in Cwm Taf Morgannwg was a little lower than the Wales figure.
These data reflect the different types of items and their volumes prescribed in different health board areas in Wales.
Prescribing by cluster deprivation
Using the Welsh Index of Multiple Deprivation (WIMD) and GP practice population data (StatsWales) it is possible to calculate an approximate measure of deprivation at general practice and GP collaborative/cluster level.
Charts 9 and 10 summarise prescriptions data by cluster deprivation, using the deprivation measure for percentage of patients registered to practices who live in the most deprived 20% of areas in WIMD 2019. The 64 clusters are ranked from most deprived to least deprived and separated into evenly sized quintiles. The most deprived quintile (quintile 1) contains the 13 clusters with the highest percentage of their population living in deprived areas. The least deprived quintile contains the 13 clusters with the lowest percentage of their population living in deprived areas.
Full details of the methodology used are available in the statistical article General practice and primary care cluster population and workforce by deprivation: at 31 December 2021.

Summary of prescription items and cost by cluster deprivation quintile (StatsWales)

Summary of prescription items and cost by cluster deprivation quintile (StatsWales)
There were small differences in the number of items prescribed and their cost when comparing cluster deprivation quintiles.
1.8 (or 7.2%) more prescription items per head of population were prescribed in the most deprived quintile than in the least deprived quintile.
The data does not show a totally linear relationship between deprivation and the number of items prescribed per head of population. However, there were more items per head prescribed in the two quintiles with the largest percentage of their populations living in the most deprived areas of Wales (quintiles 1 and 2) than the Wales average. The data also shows a slightly lower number of items prescribed per head in the two quintiles with the smallest percentage of their populations living in the least deprived areas of Wales (quintiles 4 and 5) than the Wales average.
The net ingredient cost per item only differed slightly between deprivation quintile and was £0.16 (or 2.2%) lower in the most deprived quintile compared to the least deprived quintile.
While the differences between deprivation groups are small, the net ingredient cost per item increased as the level of deprivation decreased between quintiles 1 and 4.
Most common 25 items prescribed

Atorvastatin (a lipid-regulating drug) was the most prescribed item in 2021-22, with it being prescribed more than 3.2 million times, an increase of almost 200,000 (or 6.6%) since 2020-21.
Nine of the ten most prescribed items in 2021-22 were also in the ten most commonly prescribed items in 2020-21.
Data for individual drugs or appliances prescribed is searchable through our interactive data tool.
UK comparisons
The charts below compare the number of prescription items dispensed, per head of population, the net ingredient cost (NIC) per head of population and the cost per prescription item across the four UK countries.
The prescription data for these charts is based on prescriptions dispensed in the community, rather than prescriptions issued by GPs meaning figures for Wales will differ from those presented in the other sections in the release. While prescribing policies differ across countries, prescriptions dispensed data can be used to make broad comparisons across the four countries of the United Kingdom.
For consistency between countries, the Office for National Statistics (ONS) mid-year population estimates for 2020 are used in this section, rather than the number of people registered to a GP practice. See quality and methodology information for quality note about mid-year estimates.
Note that the latest data for Wales and England refers to 2021-22, for Scotland it refers to 2020-21 and for the calendar year 2021 in Northern Ireland.
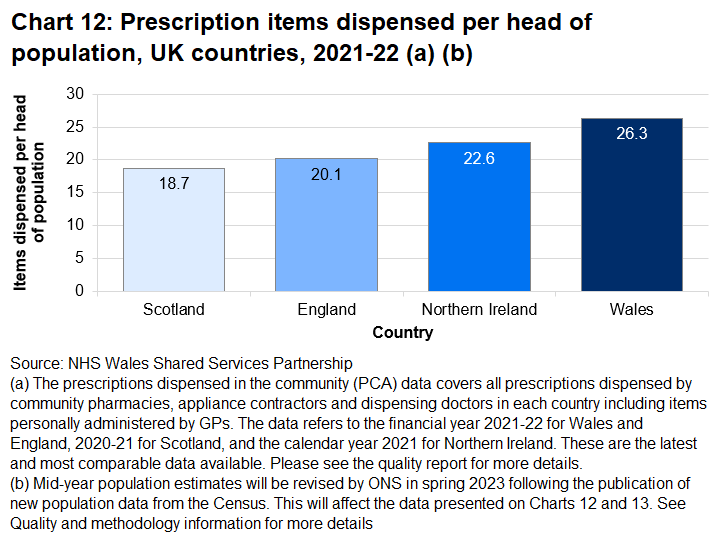


More prescription items per head of population were dispensed in Wales than any of the other UK countries. However, the net ingredient cost was the second lowest and the cost per prescription item was the lowest of all countries.
This suggests that a higher proportion of lower-cost items are dispensed in Wales than in other countries.
Quality and methodology information
Detailed quality and methodology information is published in the accompanying quality report.
Prior to 2019, prescriptions data had been published in two separate statistical releases, Prescriptions by GPs last published on 19 September 2018 and Prescriptions dispensed in the community last published on 23 May 2018.
Combining the two datasets in one release with more contextual information aims to provide users with a clear analysis of prescriptions in Wales.
NHS Shared Service Partnership also publish data on GP prescriptions every month, based on the same data which is presented in this publication.
An interactive data tool that allows users to search data on BNF chapters, sections, and sub paragraphs, based on GP prescriptions is published alongside this release. Previously this data was published in Excel files using only prescriptions dispensed in the community data.
Data for other countries:
Prescription Cost Analysis: England 2021/22 (NHS Business Services Authority)
Dispenser payments and prescription cost analysis: Financial year 2020/21 (Public Health Scotland)
Prescription Cost Analysis (Business Services Organisation, Northern Ireland)
The ONS will publish mid-2021 population estimates in November 2022, and these will be based on 2021 Census data. The ONS will rebase the mid-year estimates for the period mid-2012 to mid-2020 in spring 2023, therefore the data in this table will be revised when the rebased estimates are available. The data should therefore be treated with caution and considered provisional.
Complementary data on general practice workforce, general practice populations (StatsWales), deprivation at general practice level and community pharmacies are also published by Welsh Government.
Which data should I use?
Source: NHS Wales Shared Services Partnership
Table 1 shows a comparison between the two sources of prescriptions data. In general, when analysing prescriptions data for Wales, GP prescriptions should be used as the primary source. This is because the data shows what is being prescribed to people registered with Welsh GP practices and this activity is monitored and influenced by health boards. This data includes items that are prescribed in Wales by GPs and non-medical prescribers that have prescribed on behalf of the GP practice.
‘Prescriptions dispensed in the community’ should be used for more specific purposes where users are interested only in the items actually dispensed in Wales, and if direct comparisons are being made between different UK countries. While the number of items prescribed by GPs is close to the number of items prescribed and dispensed in Wales it does not exactly match for a number of reasons including:
- prescriptions written in Wales but dispensed elsewhere in the UK (including the Isle of Man) are counted in GP prescriptions but not ‘prescriptions dispensed in the community’. This is particularly common for specialist items such as stomas and incontinence appliances which are often dispensed by appliance contractors rather than pharmacies, many of which are not located in Wales.
- prescriptions written in another UK country (including the Isle of Man) but dispensed in Wales are not included in GP prescriptions, but are included in ‘prescriptions dispensed in the community’
- people who have had a hospital appointment and have their prescription items dispensed in their local community pharmacy rather than the hospital one will not be included in GP Prescriptions, but they would be in ‘prescriptions dispensed in the community’
Note that both ‘GP prescriptions’ and ‘prescriptions dispensed in the community’ capture prescriptions which are dispensed by dispensing doctors, appliance contractors and community (high street) pharmacies. Neither source contains data for items prescribed and dispensed in hospitals. Also note that net ingredient costs (NIC) are not adjusted for inflation.
Impact of COVID-19
The latest data for Wales covers the financial year beginning in April 2021 and ending in March 2022, which coincides in-full with the second year of the COVID-19 pandemic. However, the pandemic appears to have little impact on the way data has been collected as the administrative process of prescribing and dispensing items did not change. There may be some effect from patients interacting with GPs in different ways to before the pandemic, with more telephone and virtual consultations, but the data for the number of items prescribed by GPs and dispensed in the community in Wales, in 2021-22, is in-line with recent trends.
Mid-year population estimates
Data used for UK comparisons are calculated using mid-2020 population estimates from the Office for National Statistics (ONS). The ONS will publish mid-2021 population estimates in November 2022, and these will be based on 2021 Census data. The ONS will rebase the mid-year estimates for the period mid-2012 to mid-2020 in spring 2023, therefore the data in these charts will be affected when the rebased estimates are available. The data should therefore be treated with caution and considered provisional.
Well-being of Future Generations Act (WFG)
The Well-being of Future Generations Act 2015 is about improving the social, economic, environmental and cultural wellbeing of Wales. The Act puts in place seven wellbeing goals for Wales. These are for a more equal, prosperous, resilient, healthier and globally responsible Wales, with cohesive communities and a vibrant culture and thriving Welsh language. Under section (10)(1) of the Act, the Welsh Ministers must (a) publish indicators (“national indicators”) that must be applied for the purpose of measuring progress towards the achievement of the wellbeing goals, and (b) lay a copy of the national indicators before Senedd Cymru. Under section 10(8) of the Well-being of Future Generations Act, where the Welsh Ministers revise the national indicators, they must as soon as reasonably practicable (a) publish the indicators as revised and (b) lay a copy of them before the Senedd. These national indicators were laid before the Senedd in 2021. The indicators laid on 14 December 2021 replace the set laid on 16 March 2016.
Information on the indicators, along with narratives for each of the wellbeing goals and associated technical information is available in the Wellbeing of Wales report.
Further information on the Well-being of Future Generations (Wales) Act 2015.
The statistics included in this release could also provide supporting narrative to the national indicators and be used by public services boards in relation to their local wellbeing assessments and local wellbeing plans.