Profile of existing public body board members
A summary analysis of survey responses from existing members of Welsh public body boards.
In this page
Introduction
In Wales, there are a total of 30 Arm’s Length Bodies (ALBs) that currently receive funding from the Welsh Government. All ALBs maintain a board of independent members who’s purpose is to support and scrutinise the performance of their respective ALB.
Welsh Government has a responsibility to recruit to and appoint independent members to the boards of ALBs. All of these appointments (known as public appointments) are authorised by the relevant elected minister of the Welsh Government.
As part of the function of the Welsh Government, it is necessary to routinely review the make-up and diversity of existing board members. This report presents a summary analysis of survey responses from existing members of Welsh public body boards.
Methodology
The survey was issued to all existing ALB board members. Board members were asked to provide their details between 1 January and 28 February 2026.
A total of 138 complete responses were received.
As the survey was optional, findings should be interpreted as indicative rather than statistically representative.
As part of the analysis, the diversity of the board members was compared to the profile of board members with the Welsh national population using Census 2021 benchmarks.
1. Overview of survey respondents
The vast majority of respondents (over 90%) reported holding a single regulated public appointment, with a small minority holding 2 or more. Responses were received across a wide range of public bodies, with the highest numbers from NHS boards and national arm’s-length organisations.
The five bodies which provided the most responses were:
- Cwm Taf Morganwg University Health Board – 11 responses
- Social Care Wales – 10 responses
- Betsi Cadwaladr University Health Board – 9 responses
- Llais, Citizen Voice Body for Health and Social Car – 8 responses
- Meat Promotion Wales – 8 responses
Nearly half (47% of respondents) were living in Southeast Wales, 17% lived in Southwest Wales, 12% lived in North Wales and 7% lived in Mid Wales. Just under 17% of respondents did not live in Wales.
2. Age profile
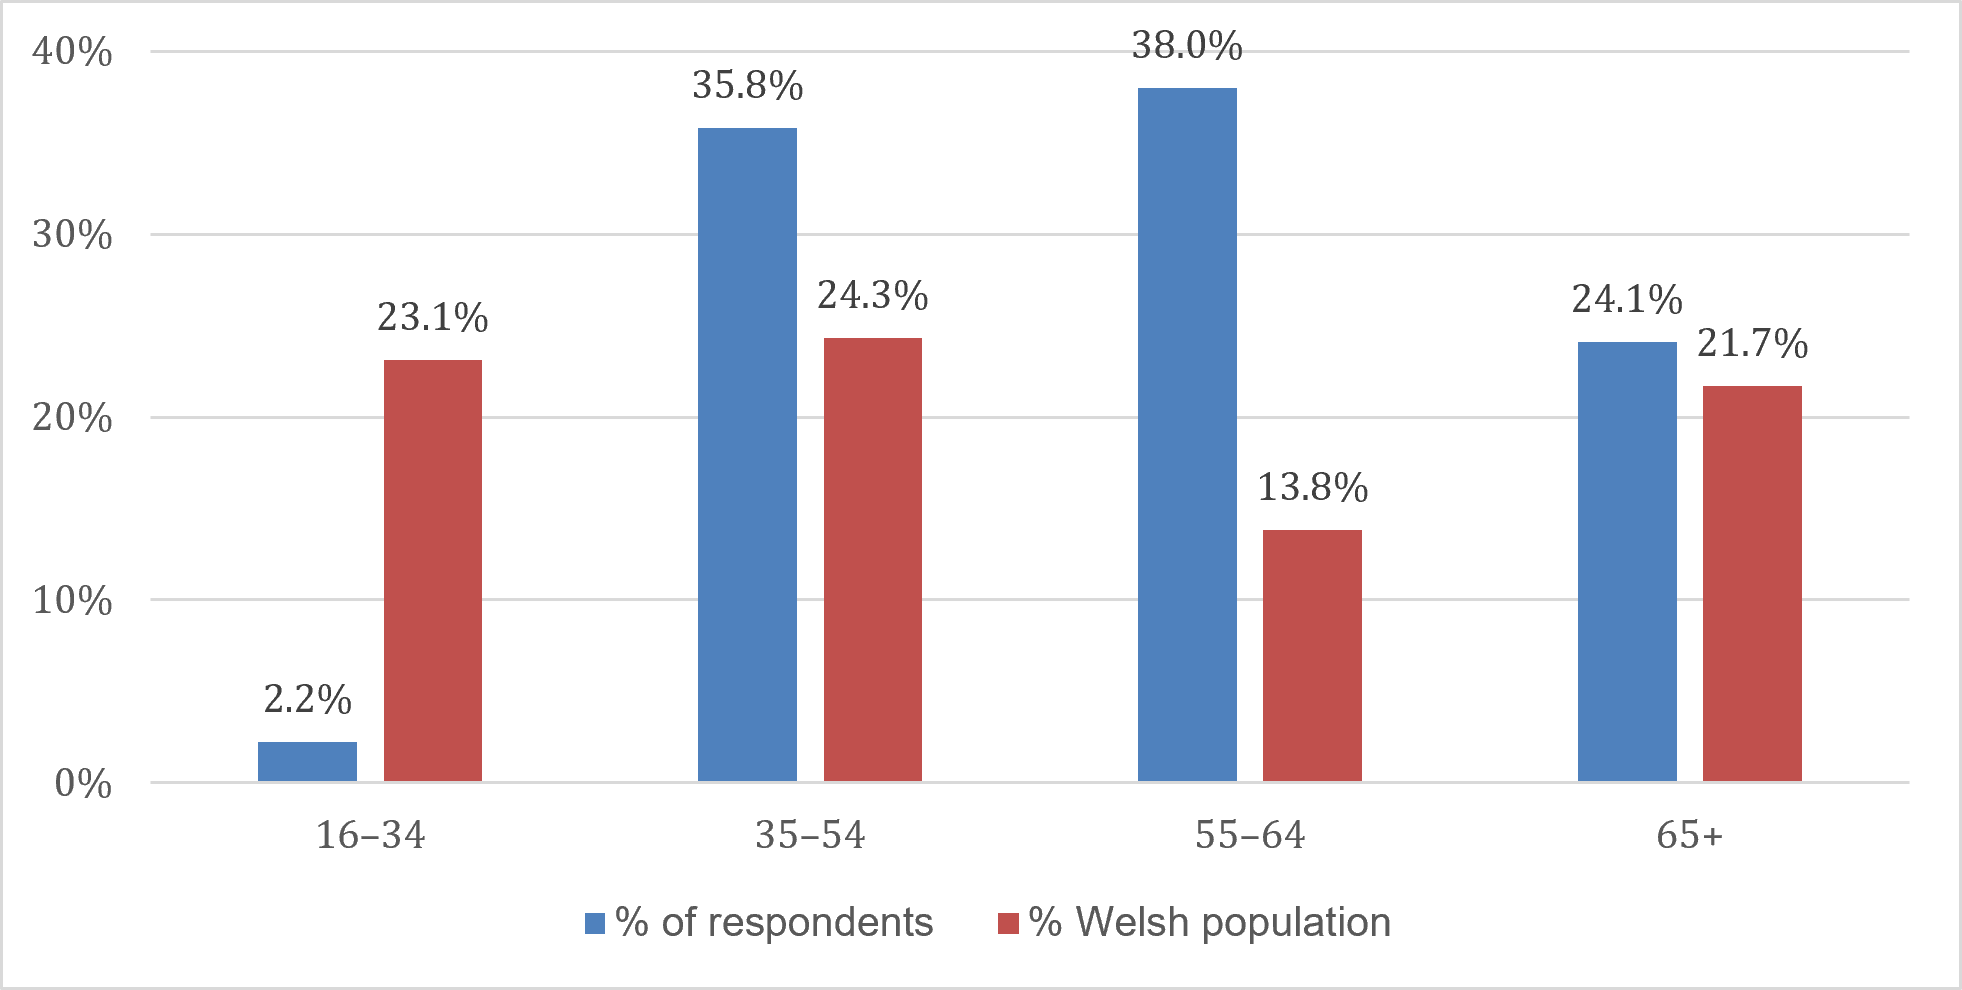
Board membership is heavily skewed towards older age groups. Figure 1 shows that nearly two-thirds of respondents were aged 55 or over, with very low numbers from those under 35 (only 2%). This contrasts with the Welsh population, where just under a quarter (23.1%) were aged 16-34.
Source: 2024-based national population projections by age, sex and year on StatsWales.
This age profile represents one of the most pronounced differences between board members and the wider population, with the 16-34 underrepresented and the 35-64 age group vastly over-represented.
3. Gender, disability and sexual orientation
Women accounted for most respondents (57.7%), which is higher than their share of the Welsh population overall, see Table 1.
| Gender | % of respondents | % Welsh population |
|---|---|---|
| Female | 57.7% | 51.1% |
| Male | 42.3% | 48.9% |
Source: 2024-based national population projections by age, sex and year on StatsWales
Around three-quarters of respondents reported no long-term physical or mental health condition. This indicates that disabled people may be somewhat under-represented on boards compared with the Welsh population, although disclosure effects should be considered.
- 76.6% of respondents report not being disabled compared to 78.9% of the population (Source: StatsWales)
- Approximately 16% of respondents report a long‑term illness or condition
- 6.6% do not feel that they are limited
- 9.5% feel that they are a little limited
- 5.1% feel that they are limited a lot
- 2.2% prefer not to say
Most respondents identified as heterosexual or straight. A small proportion identified as gay, lesbian or bisexual, but this is still above population estimates.
| Sexual orientation | % of respondents | % Welsh population |
|---|---|---|
| Heterosexual | 90.2% | 96.8% |
| Gay or Lesbian | 5.3% | 1.6% |
| Bisexual or other | 4.5% | 1.6% |
| Prefer not to say | 3.6% | 7.6% |
Source: People by sexual orientation, for Wales and local authorities, Census 2021 on StatsWales.
4. Ethnicity and religion
Approximately 9 in 10 respondents identified as White. Overall ethnic minority representation among board members is similar in scale to that of Wales as a whole, though representation varies by specific ethnic group. Most notably, there is a higher representation for people from a Black background and a lower representation for people from a White, Asian or Mixed background
| Category | % of respondents | % Welsh population |
|---|---|---|
| White | 89.8% | 93.8% |
| Black | 5.1% | 0.9% |
| Asian | 0.7% | 2.9% |
| Mixed / Other | <0.5% | 2.5% |
Source: People by ethnic group, for Wales and local authorities, Census 2021 on StatsWales.
Christians were over-represented among board members compared with Wales as a whole, while those reporting no religion were under-represented. Of those that provided a religion (answered the question and did not select “Prefer not to say”).
| Religion | % of respondents | % Welsh population |
|---|---|---|
| Christian | 60.6% | 46.5% |
| No religion | 35.6% | 49.7% |
| Other religion | 3.8% | 3.8% |
| Prefer not to say | 4.3% | 6.3% |
Source: People by religion, for Wales and local authorities, Census 2021 on StatsWales.
5. National identity and Welsh language ability
Just under three-fifths of respondents identified as Welsh in terms of national identity, closely aligning with Annual Population Survey estimates for the Welsh population.
- Welsh: 57.7% (57.6% Welsh‑only identity in the population - source: StatsWales)
- British: 31.4%
- English: 7.3%
- Irish: 1.5%
Welsh language ability among board members is substantially higher than in the Welsh population overall. Of those respondents that provided their Welsh language ability, approximately one third of respondents reported being fluent in Welsh (34.3%), with nearly a third reporting partial ability (32.1%). This compares with fewer than 1 in 5 Welsh residents (23.2%) reporting the ability to speak Welsh in the Annual Population Survey (source: Annual Population Survey - Ability to speak Welsh by age, sex and year on StatsWales).