Public service vehicles (buses and taxis): April 2020 to March 2021
Data on bus services, bus passes, frequency of buses and taxis for April 2020 to March 2021.
In this page
Main points
Data for Public Service Vehicles in 2020-21 (1 April 2020 to 31 March 2021) was significantly affected by the coronavirus (COVID-19) pandemic. In Wales, the number of journeys undertaken on local bus services dropped by 71.4%, and the total distance travelled in 2020-21 decreased by 36.0% compared to the previous year. This is the largest decrease in the number of journeys undertaken on local bus services and the total distance travelled since records began. In Great Britain, the number of journeys undertaken on local bus services fell by 61.8% over the same period.
There were 26.0 million passenger journeys undertaken on local buses in Wales in 2020-21 compared to 91.0 million passenger journeys in the previous year. The journeys in 2020-21 covered a total of 64.2 million vehicle kilometres (chart 2).
In 2020-21, the number of drivers employed on buses and coaches fell by 12.4% to 3,258 compared to 2019-20, (chart 5).
Over the same period, the number of local bus and coach vehicles in operation decreased by 7.8% to 2,217 (chart 3).
Bus fares in Wales during 2021 were similar to those recorded in 2020. In Great Britain, bus fares rose by 1.5%, lower than the consumer price inflation rate over the same period of 2.3% (chart 6).
As of March 2021, the number of Taxi registrations fell by 7.2% whilst private hire vehicle registrations dropped by 13.3% compared to March 2020. A total of 4,569 taxis and 4,594 private hire vehicles were licensed as of March 2021 in Wales.
The local bus industry in Wales
Local bus services are defined as those services where passengers are carried ‘at separate fares over short distances’[footnote 1]. Bus services are a vital part of Welsh economic and social life. The 2011 Census showed that 23% of the population of Wales had no access to a car or van, and many people rely on bus services for travel to work, for hospital appointments, visiting friends, shopping and accessing leisure services.
During 2020-21, there were 26.0 million passenger journeys on local buses in Wales, with the services covering 64.2 million vehicle kilometres. 72.9% of the total distance travelled was accounted for by commercial routes (chart 2).

The total distance travelled in 2020-21 saw a decrease of 36.0% compared to the previous year. The distance travelled by subsidised services fell by 32.5% in 2020-21 whilst commercial services distance fell by 37.3%. The reductions in distance travelled over the latest year likely reflect the impact of the COVID-19 pandemic.
The total distance travelled in 2019-20 (the last mostly pre-pandemic period) was 19.0% lower than the distance travelled in 2009-10, a fall driven by a large decrease in the distance travelled on subsidised services (down 40.0%). Distances travelled on commercial services fell by 7.8% over the same period.

Vehicle kilometres and passenger journeys on buses and coaches by year on StatsWales
Broadly, the long term trend in distance travelled has tracked the trend in numbers of buses in operation (chart 3). Continuing the long term decline in buses and distance covered, as well as reflecting the impact of the COVID-19 pandemic, the number of buses and coaches decreased in the latest year.
There were 2,217 locally operated buses and coaches in Wales in 2020-21, a decrease of 187 compared with the previous year. Since 2010-11 local bus and coach numbers have fallen by 756 (25.4%). These vehicles were operated on 1,539 registered bus routes (as of 31 March 2018).

Number of bus and coach vehicles by year on StatsWales
The number of individual passenger journeys has followed a similar trend to that of distance travelled since 2007-08. Journey numbers had been relatively stable since 2014-15 to 2020-21 but saw a large decrease in the latest year. Compared to 2019-20, local bus journeys fell by 71.4% in 2020-21, the largest decrease since records began. (chart 4).

Vehicle kilometres on local bus services by UK country and year on StatsWales
In 2020-21 the local bus industry in Wales had 4,159 staff, 78.3% (3,258) of which were drivers. There was a decrease of 11.8% of all staff in the latest year (chart 5) with the number of drivers decreasing by 12.4%. Over the long term, there has been a slight downward trend in driver numbers and all staff numbers. Broadly, trends in drivers and all staff numbers are similar to the trend in buses in operation.

Number of staff employed on buses and coaches by year on StatsWales
Local bus services: fares
Chart 6 shows how bus fares in Wales and Great Britain have changed since 1995. Figures used are in current prices (actual prices paid). Bus fares in Wales have increased at a very similar rate to Great Britain, though in recent years fares have increased slightly more in Great Britain than in Wales. Bus fares have increased at a rate greater than inflation (as measured by CPIH[footnote 2]). This is shown by the steeper trajectories of the fare increases compared with the shallower slope of the dotted line for CPIH. Since 1995, fares in Wales increased by 174%, fares in Great Britain increased by 185% and CPIH increased by 64%. In the latest year there was no change in fares in Wales and a 1.5% increase in Great Britain, lower than the inflation rate of 2.3%.

Fare Indices for local bus services in Wales and Great Britain by year on StatsWales
Local bus services: journeys
Wales accounts for a small proportion of the local bus market in Great Britain, with just 1.5% of total passenger journeys in 2020-21. This proportion shows that bus travel is less prevalent in Wales than across GB in general, with Wales accounting for 4.9% of the GB population. In 2020-21 all GB nations saw a decrease in local bus journeys, likely reflecting the impact COVID-19 had on public service vehicles across GB. Compared to previous year, Wales saw the highest percentage decrease in local bus journeys (-71.4%) followed by Scotland (-65.0%) and England (-61.3%) (Chart 7).
Chart 7 shows trends in bus travel in the countries of Great Britain since 2000-01. The trend in Wales was broadly similar to that seen in Scotland until 2018-19. The overall trend for England is different because of the distortive effect of London, where there were significant increases in bus journeys up to 2008-09.

Local bus journeys index by UK country and London and by year on StatsWales
The number of passenger journeys per person has been decreasing across Great Britain since 2008-09. All countries saw a decrease over the latest year with Wales seeing a 72.4% decrease. In Wales, the number of journeys per person is less than half of the rate in Scotland and England (chart 8). This rate has remained stable in Wales since 2014-15, whereas the rate per person has decreased in both England and Scotland over the same period.

Local bus services: distance covered
The total distance travelled in Wales by bus represents only 3.4% of all vehicle kilometres travelled in Great Britain for 2020-21 (chart 9).
In 2020-21, the total distance travelled in Wales was 36.0% lower than in 2019-20, whilst England and Scotland saw a 16.0% and 24.0% decrease respectively. Over the long term, there have been decreases in the distance travelled in all three countries. Since 2005-06, the percentage decrease has been greatest in Wales (down 49.6%) compared with 27.2% in England and 31.7% in Scotland (chart 9).

Vehicle kilometres on local bus services by UK country and year on StatsWales
Licensed taxis and private hire vehicles in Wales
Individuals can apply for a taxi licence, a private hire vehicle (PHV) licence or a dual licence.
- A taxi licence enables the holder to pick up passengers on the streets or from designated taxi ranks.
- A private hire vehicle licence enables the holder to pick up passengers who have made a booking with a licensed private hire operator.
- A dual licence enables the holder to drive either a taxi or a private hire vehicle.
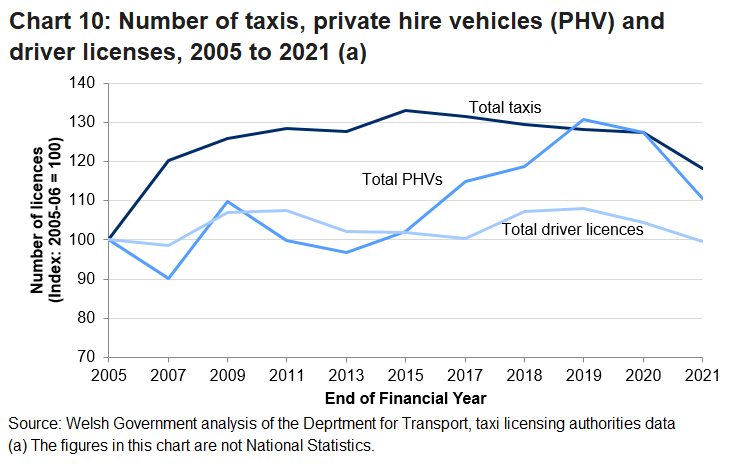
As of March 2021, there were 4,569 licensed taxis in Wales and 4,594 PHVs. There was a total of 9,432 driver licences issued with ‘Dual taxi/PHV driver licences’ representing 82.7% of the total licenses, and ‘Taxi only licensed drivers’ representing only 2.4%. Taxi licences have been stable for some time while PHVs have increased in recent years. The total number of driver licences held in Wales as of March 2021 saw a decrease of 4.6% when compared to the previous year. (chart 10).
Licenced taxis and private hire vehicles by local authority and survey year on StatsWales
- There were 4,594 private hire fleet licensed vehicles in operation as of March 2021, with 1,693 drivers licensed and 779 operators licensed.
- There were 9,432 drivers licensed for both a taxi and private hire vehicle in Wales as of March 2021; 35.5% of these from the Cardiff and Swansea local authorities.
The number of taxis and private hire vehicles licensed, by local authority, in Wales can be accessed from StatsWales. Two local authorities in Wales (Wrexham and Merthyr Tydfil) issued no dual licences as at 31 March 2021 and instead licensed taxi drivers and private hire vehicle drivers separately.
Quality information
Data source
Most of the information presented here is derived from annual returns made to the Department for Transport (DfT) by a sample of 700 holders of Public Service Vehicle operators’ licences (‘the PSV survey’). This survey provides information on passenger journeys, vehicle miles, passenger receipts and operating costs. Separate, smaller surveys managed by DfT collect information about fare changes, service reliability and quarterly patronage from the larger bus operators.
Full details of the data sources and methods used can be found in the guidance (Department for Transport).
Coverage
The survey covers only those operators operating local bus services registered with the Traffic Commissioner.
Definitions
Local bus service
Local services are scheduled stopping services registered with the Traffic Commissioner. A local service is defined as a bus service using Public Service Vehicles to carry passengers at separate fares over short distances. The route can be of any total length, as long as throughout its length passengers can get off within 24.15 kilometres (15 miles) (measured in a straight line) of the place where they were picked up. Each passenger must make a separate payment to the driver, conductor or agent in order to use the service. Excursions and tours need only be registered if separate fares are paid, the whole journey is within a 24.15 km (15 mile) radius of the starting point and they run one or more times a week for at least 6 weeks in a row. Schools and works services may be local bus services if the users pay a separate fare but do not need to be registered if someone other than the bus operator is responsible for arranging the journey, and the journey is not advertised beforehand to the general public, and all passengers travel to or from the same place, and passengers pay the same fare no matter how far they travel.
Passenger journeys
A count of the total number of boardings of each vehicle, so a trip which requires a change from one bus to another would be counted as two journeys in these figures. Figures do not include children under 5 years of age.
Vehicle kilometres
Distance (kilometres) run by local buses in service. This includes only ‘live’ (i.e. service) miles and not ‘dead’ running e.g. from depots to the start of a route.
Relevance
DfT bus statistics represent the most comprehensive single source of official data on the bus industry in Great Britain, and provide data which is used in monitoring trends, developing policy and providing accountability for the subsidy provided to the industry at a high level.
Accuracy
The PSV survey uses imputation techniques to derive key figures for operators who were either not selected in the sample for that year, or who did not respond. On occasion, imputations for earlier years can be improved using directly-reported data for later years. Minor revisions to back-data can occur as a result, although trends are rarely affected substantively.
For the key indicators (passenger journeys and vehicle miles operated) the data provided by operator’s cover around, or above, 90% of the total figure, with the remainder imputed. Comparison with other sources suggests that, at aggregate (Great Britain) level, the statistics are likely to provide a reasonably robust measure of levels and broad trends.
However, figures representing smaller groups of operators and single year on year changes should be treated with caution as these are more susceptible to measurement errors (for example, an inaccurate return by an operator, or a change in an operator’s method of producing the figures required) which are more likely to even out at the national level. For this reason, regional, and particularly local authority, level figures should be interpreted with caution.
Timeliness and punctuality
DfT collected data from operators during the summer 2021 for publication in November 2021.
Accessibility and clarity
This Statistical Bulletin is pre-announced and then published on the Statistics and Research website and is accompanied by StatsWales reports.
Comparability and coherence
Many of these statistics have been collected on a broadly comparable basis from operators for many years. However, following revisions to the methodology used to compile the published figures, 2004-05 is the earliest year for which figures are comparable on exactly the same basis.
Related publications
The Department for Transport (DfT) produces statistics on the local bus sector in Great Britain presenting information on passenger journeys, vehicle miles, levels of revenue, costs and government support, the vehicle fleet, staff employed and other indicators including punctuality:
Transport Scotland produces an annual publication titled 'Bus and Coach Travel' which brings together a range of bus and coach data to provide a more comprehensive and complete understanding of travel trends and behaviours across these modes. Data presented include DfT Scottish bus operator data, Transport Scotland concessionary bus fare data and further analysis of bus-related information collected by the Scottish Household Survey (SHS).
The annual statistical publication 'Northern Ireland Transport Statistics 2018-2019' produced by the Department for Infrastructure in Northern Ireland contains a chapter on public transport.
National Statistics status
The United Kingdom Statistics Authority has designated these statistics as National Statistics, in accordance with the Statistics and Registration Service Act 2007 and signifying compliance with the Code of Practice for Statistics.
National Statistics status means that official statistics meet the highest standards of trustworthiness, quality and public value.
All official statistics should comply with all aspects of the Code of Practice for Statistics. They are awarded National Statistics status following an assessment by the UK Statistics Authority’s regulatory arm. The Authority considers whether the statistics meet the highest standards of Code compliance, including the value they add to public decisions and debate. The designation of these statistics as National Statistics was confirmed in February 2013 following a full assessment against the Code of Practice.
Since the latest review by the Office for Statistics Regulation, we have continued to comply with the Code of Practice for Official Statistics, and have made the following improvements:
- Eliminated un-necessary tables from bulletin as they are freely available on StatsWales
- Improved visuals and commentary of long terms trends for all public service vehicles
It is Welsh Government’s responsibility to maintain compliance with the standards expected of National Statistics. If we become concerned about whether these statistics are still meeting the appropriate standards, we will discuss any concerns with the Authority promptly. National Statistics.
Well-being of Future Generations Act
The Well-being of Future Generations Act 2015 is about improving the social, economic, environmental and cultural well-being of Wales. The Act puts in place seven wellbeing goals for Wales. These are for a more equal, prosperous, resilient, healthier and globally responsible Wales, with cohesive communities and a vibrant culture and thriving Welsh language. Under section (10)(1) of the Act, the Welsh Ministers must (a) publish indicators ('national indicators') that must be applied for the purpose of measuring progress towards the achievement of the wellbeing goals, and (b) lay a copy of the national indicators before Senedd Cymru. The 46 national indicators were laid in March 2016 and this release does not include any of the 46 national indicators.
Information on the indicators, along with narratives for each of the well-being goals and associated technical information is available in the Wellbeing of Wales report.
Further information on the Well-being of Future Generations (Wales) Act 2015.
The statistics included in this release could also provide supporting narrative to the national indicators and be used by public services boards in relation to their local wellbeing assessments and local wellbeing plans.
Footnotes
[1] Separate fares are where each passenger makes a separate payment to use the service. Though journeys are defined as ‘short distances’ they may be of any overall length, as long as passengers can get off within 15 miles of the place at which they were picked up.
[2] Consumer prices index including owner occupiers’ housing costs.
Contact details
Statistician: James Khonje
Telephone: 0300 021 0250
Email: stats.transport@gov.wales
Media: 0300 025 8099
![]()
SB 9/2022