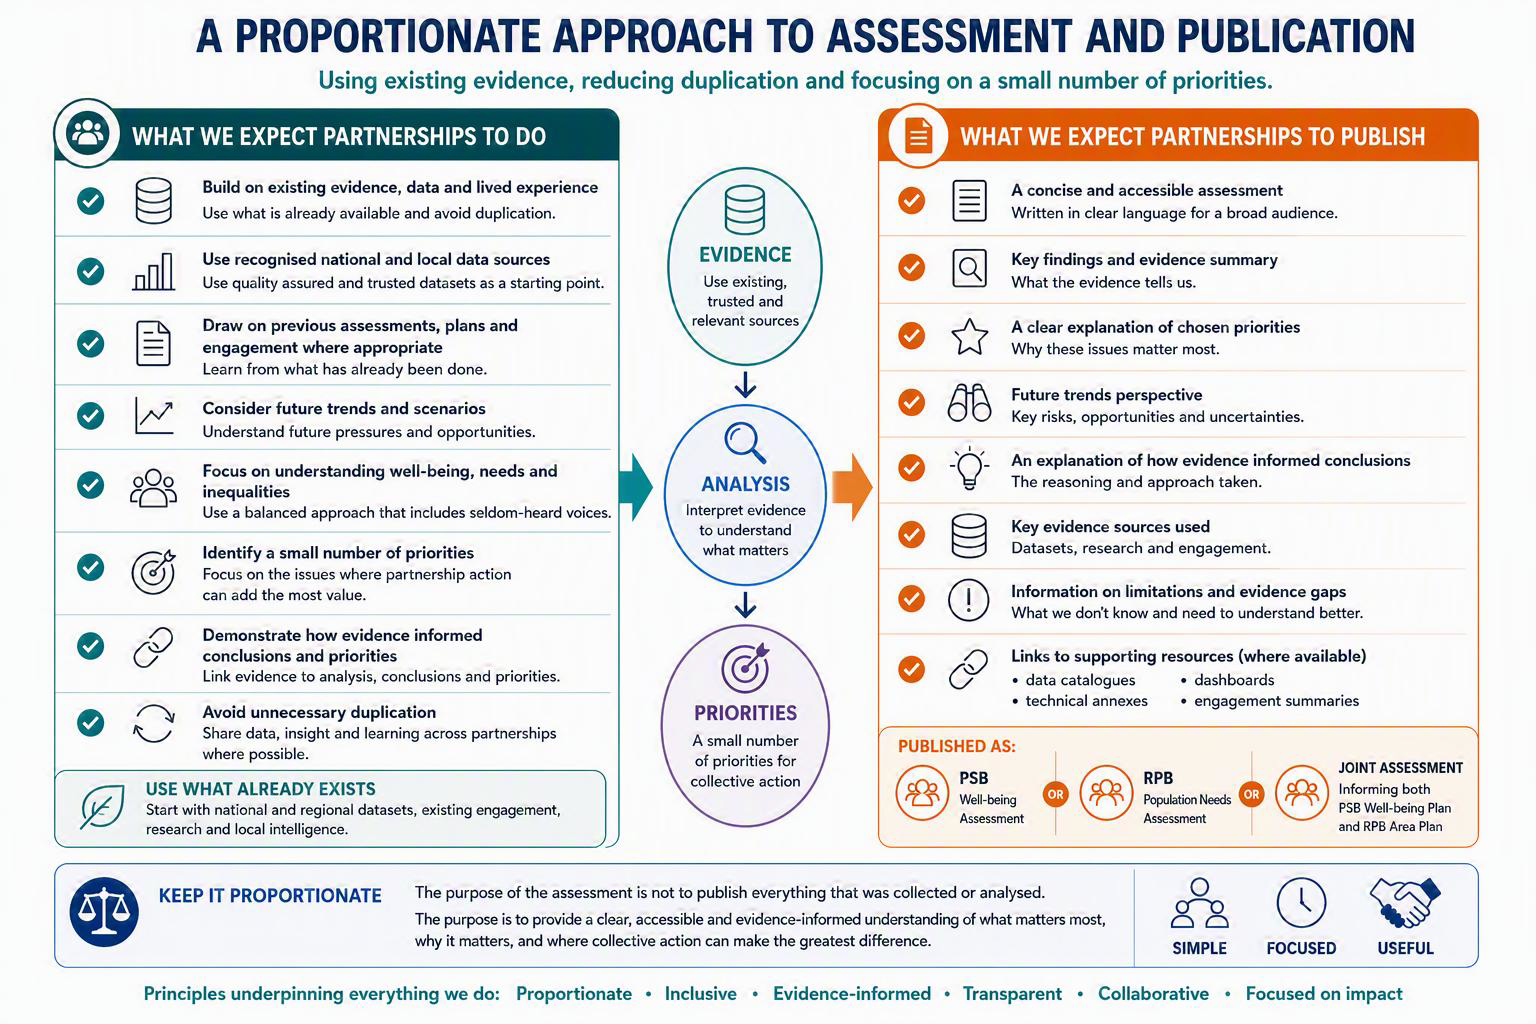
This annex sets out a high level approach to using data, evidence and insight in a way that is proportionate, purposeful and aligned across PSBs and RPBs. It is not intended to add burden or prescribe detailed technical requirements. Instead, it offers practical permissions and expectations to support a more streamlined assessment process, focused on the collective priorities that partnerships can meaningfully influence.
A proportionate and purposeful assessment
We encourage partnerships to take a proportionate approach to evidence and analysis. The purpose of the assessment is not to produce an encyclopaedic report. Instead, it should provide a clear narrative that:
- describes what the evidence shows
- sets out key assumptions, limitations and evidence gaps, including where data is dated, incomplete or unavailable, and what this means for interpretation.
- highlights what matters most
- explains why certain issues emerge as priorities
- demonstrates why partnership‑wide action is needed
Partnerships should set out what evidence they have drawn on, for example, a list of key datasets, sources, research and community insights. Readers should be able to identify the evidence underpinning key claims, conclusions and priorities and that any limitations or gaps are clearly acknowledged. This may be incorporated within the assessment, published as a data catalogue, technical annex or maintained through an accessible digital resource. The key expectation is that the assessment tells a clear story about how the evidence has informed the findings and that the relevant evidence is clearly accessible.
Practical permissions for working with evidence
Partnerships may wish to make use of the following permissions to make the assessment process more manageable:
- Flexible formats: Partnerships may use any format or technology, such as online platforms, interactive dashboards, videos, infographics or traditional written reports, as long as outputs are accessible, transparent and easy for the public to understand. Where interactive dashboards or live data tools are used, partnerships should ensure that interpretation rather than volume of data remains central. Dashboards should support transparency and understanding, not replace analytical judgement or narrative explanation.
- Gaps are acceptable: Where data is limited, unclear or evolving, you may simply note this rather than attempt to fill every gap.
- Shared evidence products: You may choose to develop regional data catalogues, thematic profiles or shared dashboards to support both PSB and RPB assessments.
Identifying and collecting data and evidence for your assessment
A clear understanding of what the assessment is intended to achieve will help focus your evidence‑gathering on the issues that matter most for your area. Being explicit about your purpose from the outset helps shape the structure of the assessment, identifies where deeper exploration is needed, and provides a clear line of sight to the priorities that will follow in your Well‑being assessments or Population Needs Plans.
Much of the data you need is likely to already exist. A key early task is to identify relevant sources and understand what each can contribute. Useful sources may include:
- Official statistics: such as data produced by ONS, Welsh Government or Public Health Wales. These provide robust, comparable data over time and across areas, though often with limited granularity at community level.
- Administrative data: information collected through service delivery. This can offer insight into real‑time service use and demand but may vary in quality or completeness.
- Local and community intelligence: insight generated through consultations, partner reports or local engagement, which can reveal issues not visible in national datasets.
- Grey literature: evaluations, research summaries and stakeholder reports that provide contextual or thematic insight. These may vary in quality and should be interpreted with care.
- Qualitative insight and community evidence: such as interviews, workshops or co‑production activities, which provide depth and explanation but may not represent all groups equally.
- Environmental evidence sources: including the State of Natural Resources Report (SoNaRR) and Natural Resources Wales’s Area Statements, which provide regional insight into environmental risks, pressures and opportunities.
No single source provides a complete picture. Using multiple types of evidence together can help corroborate findings, highlight contradictions and build a more rounded understanding of well‑being and need.
In considering the above forms of evidence partnerships should begin by considering recognised and trusted sources of evidence, including official statistics, national indicator frameworks, administrative datasets and established research. Use of these sources promotes comparability, consistency and confidence in findings across Wales. Other sources can then be used to gather additional information and data that can complement this data through more localised insight.
In considering the use of existing data, including qualitative insights from citizens collected through existing or ongoing engagement channels, partnerships should critically consider the robustness and representativeness of the evidence and its implications for findings. In particular you should consider whether:
- a range of demographic groups are represented
- geographic variation across the region is reflected
- evidence covers the key themes likely to influence well‑being and/or care and support needs
- perspectives from people with lived experience have been meaningfully included
Collecting new data
Where evidence gaps are identified, partnerships may wish to undertake targeted, proportionate data collection to strengthen the assessment. The expectation is not for extensive new activity to address every evidence gap, but for a balanced evidence base that credibly informs your findings.
Identifying gaps early allows partnerships to plan their approach and make best use of available resources. A simple data‑mapping exercise can help clarify what information already exists, where the gaps lie and which gaps are most important to address.
Capacity for primary data collection varies across Wales. Some areas may have sufficient in‑house analytical capacity, while others may need to draw on external researchers or academic partners. Decisions about how to collect new evidence should take account of local skills, resources and the relative importance of your evidence need.
Where new data collection is needed, partnerships should consider who to involve, what methods are appropriate and whether steps are required to ensure that seldom‑heard groups are meaningfully included. Where possible, integrating additional data collection into existing planned engagement activities rather than creating entirely new exercises may be appropriate.
Analysing and interpreting your data
Once you have gathered your data and evidence the next step is to analyse and interpret what they collectively show about people’s needs, the factors shaping them, and the implications for the future. The aim of this stage is to explain what the evidence means and why it matters, not to present all analysis in full or reproduce every dataset. Your assessment should outline the approach to analysis and how your conclusions were reached, guided by the core questions set at the outset of the assessment. These should guide your interpretation and help identify the most important messages.
As part of this interpretation, partnerships may find it helpful to reflect on their boundary judgements – the choices made about what has been included in the analysis, what has been left out, and why. Being explicit about these boundaries helps avoid blind spots. Partnerships may wish to ask:
- Which groups, places, data sources or themes have we included – and what sits outside the boundary?
- Are any important perspectives, experiences or influencing factors missing from our evidence?
- If we widened or narrowed the boundary slightly, would the issue look different?
- How might our boundary choices affect our understanding of inequalities or local variation?
Situation analysis and response analysis
Your analysis will likely include both:
- Situation analysis – understanding the economic, social, environmental and cultural conditions in your area, or the needs of specific population groups.
- Response analysis – considering what the evidence suggests about which issues should be prioritised, the types of interventions that may help, and what is known about what is or is not working.
Identifying patterns, inequalities and trends
Analysis should examine the main patterns and trends in your area, how they differ between groups or places, and how they compare with other areas or national benchmarks. This includes identifying inequalities, considering whether they are widening or narrowing, and reflecting on how conditions have changed since the last assessment.
Applying systems thinking to interpretation
When analysing evidence, partnerships may wish to consider how issues are interconnected, how actions or pressures in one part of the system affect others, and how shared drivers influence both PSB and RPB responsibilities. Taking a systems thinking approach can help identify underlying dynamics that may not be visible when looking at individual data sources. Partnerships may find it useful to ask:
- What is causing or reinforcing the pattern we are seeing?
- Are services, behaviours, environments or policies interacting in unexpected ways?
- What unintended consequences might arise from current pressures or decisions?
- Where might preventative action have the greatest impact?
This approach supports more holistic and preventative interpretation and helps avoid narrow or linear assumptions.
Understanding drivers and causes
Interpretation should go beyond describing patterns to explore the underlying drivers and possible causes. These may reflect local service changes, wider policy developments, demographic shifts or external events. Understanding why trends are occurring can help inform the type of action that may be required and where early, preventative intervention could have the most impact.
Drawing on multiple sources
Using multiple sources together allows partnerships to strengthen their analysis. Evidence sources may corroborate one another, highlight contradictions or reveal different perspectives. Where sources diverge - for example between public perception and administrative data - exploring the reasons for these differences can offer valuable insight.
Linking evidence to conclusions
Partnerships should be able to demonstrate how evidence has informed key findings, conclusions and priorities. Analysis should clearly distinguish between evidence, interpretation and judgement. Where professional judgement or stakeholder views influence conclusions, this should be made explicit alongside the supporting evidence.
Being transparent about assumptions and limitations
It is normal for evidence gaps, uncertainties and limitations to remain. Acknowledging these clearly strengthens your analysis and helps guide areas for future work. It is also good practice to be transparent about any assumptions made during the analysis, and why these assumptions were necessary. This supports understanding of the findings and builds confidence in the interpretation.
What needs to be included (minimum narrative elements)
In addition to these points about the approach to analysis and evidence, partnerships should be mindful of the end product of their assessments. Each assessment should include a concise narrative that covers:
- What the evidence shows: headline findings from data, research and lived experience, including clear references to the principal evidence sources used
- What the assessment does and does not cover: a brief explanation of any key limitations, uncertainties or boundaries in the evidence, including where conclusions should be treated with caution.
- Why this matters: the implications for well-being or for care and support needs
- What is changing: key trends, pressures and strengths emerging across the region
- Why this is a priority for Well-being and Area Plans: why this is a priority for action.
- Where the partnership adds value: issues where collective action is necessary, and individual organisations cannot deliver change alone
This narrative should directly inform the identification of a smaller number of priorities, reflecting your intention for assessments to be more selective and strategic.
Community‑area analysis within the (Wellbeing) Assessment
For PSBs, the Well‑being of Future Generations Act requires assessments to “set out the communities that comprise the area” and to analyse the state of well‑being in each community and the whole area. Partnerships have flexibility in how this is presented. It is not a requirement to produce standalone chapters or annexes for every community area, unless this is locally preferred.
Community‑area analysis may be integrated within the main narrative, provided that the assessment clearly highlights where well‑being differs between communities and identifies any notable inequalities, variations or distinct local patterns. Where a standalone annex or supplementary material is more practical, this is also acceptable. What matters is that the assessment demonstrates a clear understanding of community‑level variation and reflects this insight in the overall analysis.
Futures and scenario planning
To support better decision‑making, partnerships may wish to include a brief, proportionate look ahead. This does not require complex modelling. Instead, simple and practical approaches can be used, such as:
- “What if” discussions with partners
- Short scenario sketches (e.g., optimistic, baseline, challenging)
- Trend lines drawn from national indicators, demographic forecasts or local intelligence
- Considering what changes are most likely to shape the next 5-10 years
The purpose is not to predict the future, but to help partnerships consider how priorities may evolve and where collective action will be most needed. This futures insight will support the prioritisation process described in Section 5.