Road traffic: 2018
A report presenting information on volume of traffic by type of vehicle and class of road for 2018.
In this page
1. Main points
- Road traffic volume in Wales increased by 1.0% in 2018.
- In 2018 the total volume of motorised traffic was 29.4 billion vehicle kilometers (bvk), the highest figure on record. This is equivalent to 9,363 vehicles kilometers (5,818 miles) per person.
- Most of the traffic (66.2%) was on major roads (motorways or A roads). The remaining 33.8% of traffic was on minor roads i.e. B, C and unclassified roads.
2. How we measure traffic volume
Traffic volume is estimated using traffic counts data collected by the Department for Transport (DfT). Data from manual traffic counts are combined with data from automatic traffic counters to calculate annual average daily flows (AADF). These daily flows are combined with road lengths to calculate the number of vehicle miles travelled each year by vehicle type, road category and region. In this release estimates are presented as billion vehicle kilometres.
More detailed information is provided in the DfT’s road traffic estimates methodology note.
3. Trends in road traffic
Chart 1 shows the long term trend in traffic volume from 1993 to 2018. Over this period traffic volume increased by 33.0%, reaching a peak of 29.4 bvk in 2018. Traffic volume gradually increased up to 2007, and then fell during the economic downturn. Since 2012 traffic volume has turned upwards once again.
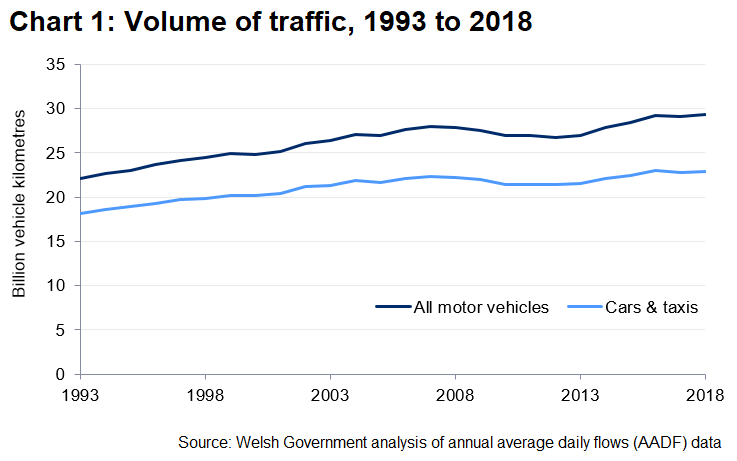
There are a variety of factors that have the potential to influence traffic volume. For example, falls in employment levels can reduce commuting traffic; increases in fuel prices might cause motorists to consider shifting to other modes of travel or cutting non-essential trips; increases or decreases in people holidaying within the British Isles, related to the strength or weakness of the pound, can have corresponding impacts on traffic.
Volume of road traffic by road classification and year on StatsWales
4. Traffic by road class
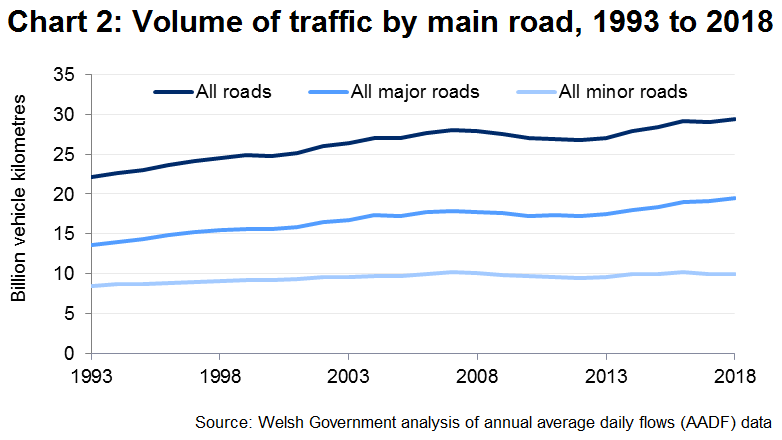
Chart 2 shows that major roads accounted for 66% of total traffic volume in 2018, and minor roads accounted for 34%. This has broadly been the case for the last 25 years, though there has been a larger increase in volume on major roads (up 43.1% since 1993) compared with minor roads (up 16.9%).

Major roads are comprised of motorways and A roads (roads intended to provide large-scale transport links within or between areas). ‘A’ roads are further sub-categorised as ‘A trunk’ roads (part of the strategic road network owned by and operated on behalf of government) and ‘A county’ roads (all other A roads). Chart 3 shows trends in traffic volume for the three categories of major roads. A county roads account for more traffic volume than A trunk roads and motorways, though traffic on trunk roads has increased more in recent years. Traffic volume in 2018 increased by 2.4% on A trunk roads, decreased by 0.1% on A county roads and increased by 0.2% on motorways.

To help provide context for these figures:
- the length of the motorway in Wales is 135 km
- the length of the trunk road network is 1,576 km
- county roads are 2,773 km in length
- B, C and minor roads total 30,370 km.
Chart 4 highlights that traffic per km of road is far higher on motorways when compared with the other classes of roads.

Volume of road traffic by road classification and year on StatsWales
5. Traffic by vehicle type and road class
Proportions of traffic flow by type of vehicle are shown in Chart 5a and Chart 5b. 94% of all motor vehicle traffic volume in 2018 was accounted for by cars and taxis (22.9 bvk) and vans (4.9 bvk). This proportion has been stable for at least the last 20 years.

Trends in traffic volume since 1993 by vehicle type are shown in Chart 5b. Overall, traffic volume has increased for cars and taxis, vans, motorcycles and pedal cycles, though at different rates. Bus and HGV traffic has fallen over the last decade. Volume of traffic for cars & taxis, light vans, all slightly increased in 2018 whilst there was a large percentage increase in motorcycle traffic. There was a slight decrease for buses.

Table 1 shows the volume of traffic by the class of road and type of vehicle for 2018. Cars and taxis are the dominant category on all classes of road, accounting for 22.9 bvk (77.9.% of motor vehicle traffic), followed by light vans at 4.9bvk (16.6%) and HGVs at 1.1bvk (3.8%).
![]()
Volume of road traffic by road classification and type of vehicle on StatsWales
6. Traffic by economic region and local authorities
South East Wales accounts for the highest proportion of the total traffic volume in Wales (46%), with North Wales accounting for the lowest (24%) (Chart 6). This distribution is consistent over time and broadly reflects where the population of Wales lives and works.

Chart 7 shows estimated traffic volume for the 22 local authorities in 2018. Cardiff, Rhondda Cynon Taf, Carmarthenshire and Newport had the highest volumes of motor vehicle traffic. Their combined volume represented 31.1% of total traffic in Wales. The Isle of Anglesey, Torfaen, Merthyr Tydfil and Blaenau Gwent had the lowest volumes of motor vehicle traffic and their combined volume represented just 7.2% of total traffic in Wales. In general, these figures reflect where people live and work in Wales.

Volume of road traffic by local authority and year on StatsWales
Volume of road traffic by local authority and road classification on StatsWales
7. New registrations and licensed vehicles
Chart 8a shows new vehicle registrations in Wales since 2001. Registrations peaked in 2004 and a subsequent a downward trend lasted until 2011. The trend then turned upwards, reaching over 115,000 in 2016 before falling once again. In 2018 the number of new vehicle registrations fell by 1.2% to 101,515.

For vehicles excluding cars the long term picture is varied (Chart 8b). Between 2007 and 2009 there was a sharp fall in the number of new registrations for vans. Despite turning back upwards since then, figures remain well below the peak. There was an increase in registrations in 2018 for motorcycles (10.8%) and vans (11.4%). There were decreases in registrations of buses (-17.0%), cars (-3.6%) and HGVs (-1.5%).

Chart 8c shows the number of cars and all vehicles licensed in Wales since 2009. The trend for cars and all vehicles is similar over time. In 2018 the number of licensed cars rose by 1.1% to 1.6 million while all vehicles increased by 1.5% to 1.9 million.

The change in licensed vehicles is not consistent for different types of vehicle (Chart 8d). For example, the index for buses (including coaches) has fallen consecutively each year since 2010. In contrast, cars and light vans have increased every year and motorcycles and HGVs have increased since 2012.

New motor vehicle registration by type of vehicle and year on StatsWales
8. Notes
Context
Related publications
The Department for Transport (DfT) produces traffic statistics which provide estimates of the vehicle miles travelled each year in Great Britain, by vehicle type, road category and region:
Transport Scotland produces an annual publication titled ‘Transport and Travel in Scotland’ which includes information on motor vehicles, traffic and driving.
Data source
Road traffic estimates for Wales are compiled by the DfT on behalf of the Welsh Government. These estimates are based on the annual roadside manual road traffic counts carried out across Wales during the year and the automatic traffic count (ATC) data, which are combined with road lengths figures to produce overall traffic estimates.
Definitions
Coverage
Traffic estimates for major roads are based on a census of all such roads whereas traffic estimates for minor roads are estimated by calculating growth rates from a fixed sample of count points on the minor road network. Further details of the methodology are available from DfT.
Traffic volume
Traffic volume is estimated using traffic counts data collected by the DfT. Data from manual traffic counts are combined with data from automatic traffic counters to calculate annual average daily flows (AADF). These daily flows are combined with road lengths to calculate the number of vehicle miles travelled each year by vehicle type, road category and region. In this release estimates are presented as billion vehicle kilometres.
Vehicle type
- Pedal cycles: includes all non-motorised cycles.
- Motorcycles: two-wheeled motor vehicles, including mopeds, motor scooters and motorcycle combinations.
- Cars and taxis: includes estate cars, all light vans with windows to the rear of the driver's seat, passenger vehicles with 9 seats or fewer, three-wheeled cars, motorised-invalid carriages, Land Rovers, Range Rovers and Jeeps. Cars towing caravans or trailers are counted as one vehicle
- Buses and coaches: includes all public service vehicles and works buses other than vehicles with less than 10 seats.
- Light vans: all goods vehicles up to 3,500kg gross vehicle weight. This includes all car- based vans and those of the next larger carrying-capacity, such as transit vans. Also included are ambulances, pick-ups, milk floats and pedestrian-controlled motor vehicles. Most of this group are delivery vans of one type or another.
- Goods vehicles (HGVs): all goods vehicles over 3,500kg gross vehicle weight. Includes tractors (without trailers), road-rollers, box vans and similar large vans. A two-axle motor tractor unit without trailer is also included.
- All motor vehicles: all vehicles except pedal cycles.
Road class
All surfaced roads are included in the estimates.
Major roads
- Motorways: dual carriageways designed for fast traffic with access limited to motor vehicles, and with relatively few places for joining or leaving. The only motorway in Wales is the M4.
- A trunk roads: part of the strategic road network owned by and operated on behalf of Government
- A county roads: all other A roads.
Estimates for A roads are also available with sub-categories for urban and rural roads on StatsWales. Urban roads are those within the boundaries of settlements with a population of 10,000 or more, and rural roads are all other non-motorway major roads.
Minor roads
- B roads: roads intended to connect different areas, and to feed traffic between A roads and smaller roads on the network.
- Classified unnumbered: smaller roads intended to connect together unclassified roads with A and B roads, and often linking a housing estate or a village to the rest of the network. Similar to ‘minor roads’ on an Ordnance Survey map and sometimes known unofficially as C roads.
- Unclassified: local roads intended for local traffic. The vast majority of roads fall within this category.
9. Key quality information
Provides a summary of information on this output against five dimensions of quality.
10. Contact details
Statistician: Ian Shipley
Telephone: 0300 025 9528
Email: stats.transport@gov.wales
Media: 0300 025 8099
![]()
SB 32/2019