Staff directly employed by the NHS: as at 30 September 2022
Data on medical, dental, nursing and midwifery staff, as at 30 September 2022.
In this page
Introduction
This release provides summary statistics on staff directly employed by NHS Wales. The release includes analyses by staff group and staff characteristics. More granular data broken down by NHS organisations are published on StatsWales.
The statistics are produced on data sourced from the NHS Electronic Staff Record, provided by Health Education and Improvement Wales. Staffing levels are best measured by using full-time equivalent (FTE) data. One FTE is the equivalent of a person working the standard hours for their grade. Overall headcount numbers are also provided and used for analysis of characteristics.
This release focusses on the most recent year and provides a ten-year time series for certain analyses. Data on staff employed by the NHS is available from 1979 on StatsWales; however due to changes to the NHS occupation manual only the total number of staff are strictly comparable over the whole time series. Further details can be found in the quality report. Workforce data for primary care services such as General Medical Practitioners and NHS Dental Practitioners are not included in this release and are published separately as they are independent NHS contractors.
Main points
Between 30 September 2021 and 30 September 2022, the total staff headcount increased by 2,913 (2.8%) to 105,968.
Between 30 September 2021 and 30 September 2022 (in terms of full-time equivalent numbers):
- the total number of staff increased by 2,765 (3.1%) to 91,404
- medical and dental staff increased by 331 (4.4%) to 7,836
- nursing, midwifery and health visiting staff increased by 425 (1.2%) to 36,113
- scientific, therapeutic and technical staff increased by 908 (6.0%) to 15,971
- administration and estates staff increased by 1,148 (5.3%) to 22,731
- ambulance staff decreased by 36 (1.3%) to 2,749
- healthcare assistants and other support staff decreased by 28 (0.5%) to 5,878
- other staff (including general payments and other non-medical staff) increased by 17 (15.4%) to 126
New data on the characteristics of all NHS staff, where characteristic data was known on 30 September 2022, shows that:
- 77% of the workforce was female; 23% was male
- 79% were 55 years old or younger; 19% were 56 to 65 years old; and 2% were 66 years or older
- 95% had no recorded disability; 5% had a disability recorded
- 92% had UK nationality; 5% had non-EU nationalities and 2% had EU nationalities
- 92% were from any white ethnic group; 5% were from any Asian ethnic group; 1% were from any black ethnic group; 1% were from mixed ethnic groups; and 1% were from other ethnic groups
Summary of staff employed
Figure 1: Number of staff (full-time equivalent) directly employed by NHS Wales on 30 September, 2013 to 2022

Description of Figure 1: time series chart showing that the number of FTE staff has increased over the last 10 years, with a sharper increase since 2019.
NHS staff summary by staff group and year on StatsWales
The total number of staff directly employed by the NHS (FTE) has increased over the long-term with more than a quarter (26.3%) more staff in September 2022 than there were in September 2013.
The annual increase in staff between September 2021 and September 2022 was 3.1%. This is higher than in years prior to the pandemic, but lower than the increases over the previous two years where there was a higher number of temporary staff recruited in response to the pandemic.
A time series of this dataset from 1979 to 2008 is also published on StatsWales.
The number of staff (FTE) in the individual staff groups is shown in Figure 2.
Figure 2: Number of staff (full-time equivalent) directly employed by NHS Wales on 30 September, by staff group, 2013 to 2022

Description of Figure 2: Time series charts showing an increase in the number of staff (FTE) for medical and dental; nursing; scientific, technical and therapeutic; administration and estates; and ambulance staff. Other staff have remained at a broadly similar level.
NHS staff summary by staff group and year on StatsWales
[Note 1] includes midwifery and health visiting staff
[Note 2] healthcare assistants (HCAs) and other support staff
9% of all staff (FTE) on 30 September 2022 were medical and dental staff. There has been an upward trend and increase of 28.8% since 2013 with the number of staff in this group increasing each year since 2014. The upward trend is more prominent in recent years, with an increase of 17.1% between September 2019 and September 2022.
40% of all staff (FTE) on 30 September 2022 were nursing, midwifery and health visiting staff, which was the largest staff group. There has been a steady long-term upward trend with staff increasing by 15.1% since 2013. The trend continued in September 2022 where there was an annual increase in staff of 1.2%.
17% of staff (FTE) on 30 September 2022 were scientific, therapeutic and technical staff. Staff in this group have increased by 37.5% since 2013, and by 6.0% since 30 September 2021. There has been a year-on-year increase in the number of staff in this group since 2013.
25% of staff (FTE) on 30 September 2022 were in the administration and estates group. Administration and estates staff have increased by 50.3% since 2013, and by 5.3% since 30 September 2021. Numbers have increased each year since 2013 with a notable increase of 9.4% between 2020 and 2021.
3% of staff (FTE) on 30 September 2022 were ambulance staff. Ambulance staff have increased by 43.3% since 2013 but decreased by 1.3% since 30 September 2021. There was a marked increase of 16.0% from 2018 to 2019 (mainly due to significant changes to the ambulance section of the NHS occupation codes manual, see the quality report for more information).
6% of staff (FTE) on 30 September 2022 were healthcare assistants (HCAs) and other support staff. HCAs and other support staff decreased by 4.7% since 2013, and by 0.5% since 30 September 2021. The number of staff in this group have fluctuated since 2013 and is partly affected by the re-coding of some HCAs to nursing assistants/auxiliaries, see the quality report for more information.
There were 126 other non-medical staff (FTE) on 30 September 2022. Numbers of staff in this group have fluctuated but remained fairly constant since 2013.
Health professional students and recently retired staff recruited to help during the COVID-19 pandemic are included in staff numbers from 2020, however few remained in post by 30 September 2022.
Medical and dental staff
Figure 3: Hospital medical staff (full-time equivalent) from 2013 to 2022
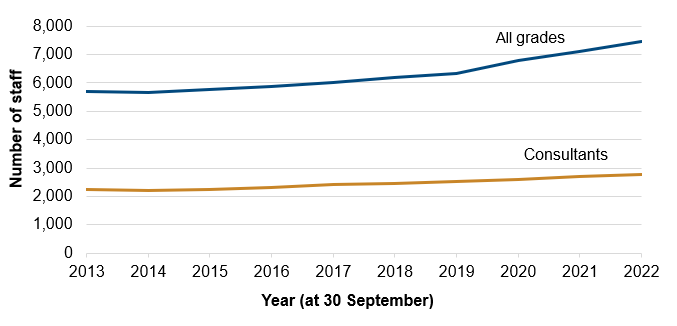
Description of Figure 3: Time series line chart showing the number (FTE) of hospital medical staff of all grades has increased over the last 10 year, with marked increases since 2019. The number (FTE) of consultants has also increased since 2013.
NHS medical and dental staff by grade and year on StatsWales
Hospital medical staff (FTE), which is a subset of medical and dental staff, have increased by 30.4% since 2013, and by 5.0% since 30 September 2021, to 7,450 on 30 September 2022.
Hospital medical consultants (FTE) have increased by 23.8% since 2013, and by 2.2% since 30 September 2021, to 2,759 on 30 September 2022.
Total hospital dental staff (FTE) have remained close to 160 since 2013. There were 49 hospital dental consultants (FTE) on 30 September 2022 which has also remained broadly consistent over the decade.
Nursing, midwifery and health visiting staff
Figure 4: Nursing, midwifery and health visiting staff (full-time equivalent) from 2013 to 2022

Description of Figure 4: Time series line chart showing an increase in the number (FTE) of all nursing staff, over the last 10 years, with marked increases from 2019. The number of registered nurses has remained broadly double the number of support staff, with both groups increasing on a similar long-term trend.
Nursing, midwifery and health visiting staff, by grade and area of work on StatsWales
Registered nursing and midwifery staff (FTE) have increased by 2,289 (10.4%) since 2013 and by 324 (1.4%) since 30 September 2021, to 24,294 on 30 September 2022.
Nursing support staff (FTE) have increased by 2,458 (26.3%) since 2013 and by 101 (0.9%) since 30 September 2021, to 11,819 on 30 September 2022.
District nurses
Staff registered with the Nursing & Midwifery Council (NMC) can undertake further studies in a range of specialist practitioner and other roles. Figure 5 shows the staff with the Specialist Practitioner: District Nurse (SP:DN) qualification. With the link between the NMC and ESR it is possible to see how many district nurses (and other staff) have the SP:DN qualification.
Figure 5: District nurses (headcount) with the District Nurse Specialist Practitioner (SP:DN) qualification on 30 September 2022, by local health board

Description of Figure 5: Bar chart showing the percentage of staff coded as district nurses who have the additional SP:DN qualification varies between health boards from 14% in Cardiff and Vale to 85% in Powys.
Across Wales, there were 693 staff coded as district nurses and 306 (or 44%) of these had the additional SP:DN qualification on 30 September 2022. However, this varied widely between local health board areas with only 1 in 7 staff coded as district nurses in Cardiff and Vale also being recorded with the qualification, compared to 6 out of 7 in Powys.
Welsh Government will further investigate how consistently district nurses are being recorded within health boards.
Figure 6: Nursing staff (headcount) with the District Nurse Specialist Practitioner (SP:DN) qualification on 30 September 2022, by occupation

Description of Figure 6: Pie chart showing half of nursing staff with the SP:DN qualification are recorded as ‘other first level nurses’, while just over a third are recorded as district nurses and 8% are managers.
[Note 1] registered nurses who are not coded to specific nursing categories such as district nurses, health visitors, community mental health or learning disability nurses.
[Note 2] includes health visitors, midwives, and other nursing staff not coded as district nurses.
Across Wales, 810 nursing, midwifery and health visiting staff had the additional SP:DN qualification on 30 September 2022. However, the majority of staff with this qualification were not recorded as district nurses. 50% were recorded as ‘other 1st level nurses’, while 8% were managers and 4% were other nurses. A further 11 non-nursing staff had the SP:DN qualification.
While it would not be unusual for a member of staff to have the SP:DN qualification and be working in a non-district nurse role, the data suggests that there may be an inconsistent approach to how district nurses are recorded across all health boards.
Staff characteristics
For the first time, this release includes analyses on NHS Wales staff characteristics. Data for all staff, and by selected staff groups, are presented on gender, age band, disability, nationality and ethnicity. Data for individual organisations is available on StatsWales.
Staff characteristics statistics are based on records where a known status was recorded, and therefore provide an indication of the characteristic breakdown of NHS staff in Wales. The percentage of not stated and missing records is included with each section indicating the level of uncertainty with these statistics. If the staff with missing data have a systemically different characteristic profile than those with a known status, these statistics would change.
Data for Figures 7 to 14 are rounded to the nearest percentage.
Figure 7: Staff directly employed by NHS Wales on 30 September 2022, by gender and staff group [note 1]

Description of Figure 7: Stacked bar chart showing the majority of staff are female in most staff groups (including nursing, midwifery and health visiting; scientific, therapeutic and technical; administration and estates; and other staff). Ambulance staff and medical and dental staff have a larger percentage of male staff.
Percent of NHS staff by organisation, staff group and gender on StatsWales
[Note 1] There were no records with missing gender data.
[Note 2] Includes some healthcare assistants, plus other support staff and other non-medical staff.
On 30 September 2022, 77% of all NHS staff in Wales were female, and 23% were male. This is in large-part due to the nursing group staff, where nearly 9 out of 10 staff were female, and nurses make up 40% of all staff.
The only staff groups where there were more males than females were ambulance staff (61%) and medical and dental (54%).
Three quarters or more of the staff in both the scientific, therapeutic and technical, and administration and estates groups were female (77% and 75% respectively).
Figure 8: Staff directly employed by NHS Wales on 30 September 2022, by age band [note 1]

Description of Figure 8: Column chart showing the percentage of staff directly employed by NHS Wales is fairly evenly spread by five-year age band. There were fewer staff in the youngest and oldest age bands.
Percentage of NHS staff by organisation, staff group and age band on StatsWales
[Note 1] There were no records with missing age band data.
There was a fairly even distribution of staff by most working age bands on 30 September 2022. Nearly 8 out of 10 staff were aged between 21 and 55, and fewer than 2% were 66 or older.
Figure 9: Medical and dental staff on 30 September 2022, by age band [note 1]

Description of Figure 9: Column chart showing that there was a high proportion of medical and dental staff in younger age groups, with 26 to 30 and 31 to 35 being the most common age bands. The percentage of staff broadly decreased as the age band increased.
Percentage of NHS staff by organisation, staff group and age band on StatsWales
[Note 1] There were no records with missing age band data.
There was a higher proportion of medical and dental staff in the younger age bands when compared to all NHS staff 30 September 2022. Almost half of medical and dental staff were aged between 26 and 40, and fewer than 1 in 20 staff were over 60 years of age.
Figure 10: Nursing, midwifery and health visiting staff on 30 September 2022, by age band [note 1]

Description of Figure 10: Column chart showing a fairly even spread of the percentage of nursing, midwifery and health visiting staff in across each five-year age band. There were fewer staff in the youngest and oldest age bands.
Percentage of NHS staff by organisation, staff group and age band on StatsWales
[Note 1] There were no records with missing age band data.
The distribution of nursing, midwifery and health visiting staff by age was similar to that for all NHS staff on 30 September 2022. 8 out of 10 staff aged between 21 and 55 and fewer than 1.5% staff were aged 66 or older.
Figure 11: Staff directly employed by NHS Wales on 30 September 2022, by disability [note 1]

Description of Figure 11: Stacked bar charts showing that the percentage of staff with a disability recorded is similar for each staff group.
Percent of NHS staff by organisation, staff group and disability on StatsWales
[Note 1] 25% of records have unknown disability status.
[Note 2] Includes some healthcare assistants, plus other support staff and other non-medical staff.
Of all staff with a known disability status, 95% had no disability while 5% had a disability on 30 September 2022. There was little variation across staff groups with the proportion with a disability ranging from 2% for medical and dental to 6% for ambulance; scientific, therapeutic and technical; and administration and estates staff.
Figure 12: Staff directly employed by NHS Wales on 30 September 2022, by nationality [note 1]
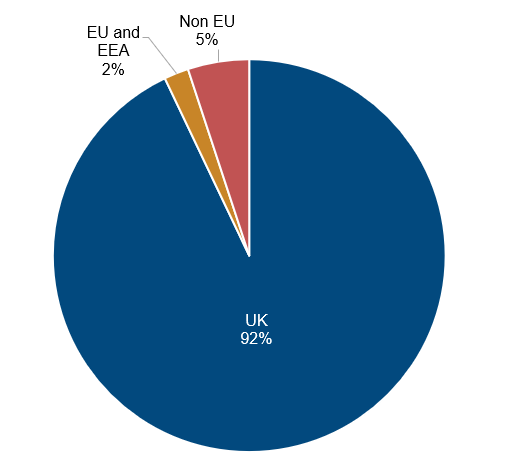
Description of Figure 12: Pie chart showing the large majority of staff have UK recorded as their nationality. Of the staff who were not recorded as UK nationals, there were more non-EU staff than EU and EEA (European Union and European Economic Area) staff.
Percentage of NHS staff by organisation, staff group and nationality on StatsWales
[Note 1] 15% of records had missing or undisclosed nationality data.
Of all staff with known data, 92% had UK nationality, 5% had non-EU nationalities, and 2% had EU and EEA nationalities on 30 September 2022.
Data by staff group is available on StatsWales and shows that the medical and dental staff group had more variation than the other staff groups. Two thirds of medical and dental staff with known data had UK nationality, over a quarter had non-EU nationalities while 7% had EU and EEA nationalities.
Of the other staff groups, 99% of ambulance staff were recorded as UK nationals (the highest of any group), while 92% of nursing staff were UK nationals (the lowest of the non-medical and dental staff groups).
Figure 13: Staff directly employed by NHS Wales on 30 September 2022, by ethnicity [note 1]

Description for Figure 13: Bar chart showing the large majority of staff were recorded in white ethnic groups. The next highest ethnic group was Asian/Asian British, while there were 1% of staff in each of remaining ethnic groups (any black ethnic group; mixed; and other ethnic groups).
Percentage of NHS staff by organisation, staff group and ethnicity on StatsWales
[Note 1] 12% of records had missing or undisclosed ethnicity data.
Of all staff with a known ethnic group, more than 9 out of 10 were in white ethnic groups. 1 in 20 were in the Asian/Asian British ethnic group, while 1 in a 100 were from each of the ethnic groups: any black; mixed; and other ethnic groups.
Figure 14: Medical and dental staff on 30 September 2022, by ethnicity

Description for Figure 14: Bar chart showing the spread of ethnic groups for medical and dental staff in Wales is different than the spread of all NHS staff. While the large majority of staff are recorded in white ethnic groups, there is a higher percentage of staff in all other ethnic groups.
[Note 1] 35% of medical and dental staff had missing ethnicity data.
Medical and dental staff had greater ethnic group variation than the other staff groups on 30 September 2022. 6 out of 10 staff were any white ethnic group, while close to 3 out of 10 staff were of any Asian ethnic group.
The proportion of any black ethnic group, mixed ethnic group and other ethnic groups were all higher than in any other staff group.
The percentage of staff recorded in each ethnic group for all other staff groups are broadly similar to each other and are available on StatsWales.
Quality and methodology information
The data is sourced from the NHS Electronic Staff Record provided by Health Education and Improvement Wales. Further information is available in the quality report.
The percentages in this release are rounded to the nearest 0.1. Percentage point changes are calculated based on the unrounded numbers.
Data on Sickness absence in the NHS is published on a quarterly basis. Note that there are minor differences in how staff groups are defined between the two releases. These are detailed in the quality report.
Workforce data General Medical Practitioners (StatsWales) and NHS Dental Practitioners (StatsWales) are not included in this release and are published separately as they are independent NHS contractors.
Well-being of Future Generations Act (WFG)
The Well-being of Future Generations Act 2015 is about improving the social, economic, environmental and cultural wellbeing of Wales. The Act puts in place seven wellbeing goals for Wales. These are for a more equal, prosperous, resilient, healthier and globally responsible Wales, with cohesive communities and a vibrant culture and thriving Welsh language. Under section (10)(1) of the Act, the Welsh Ministers must (a) publish indicators (“national indicators”) that must be applied for the purpose of measuring progress towards the achievement of the wellbeing goals, and (b) lay a copy of the national indicators before Senedd Cymru. Under section 10(8) of the Well-being of Future Generations Act, where the Welsh Ministers revise the national indicators, they must as soon as reasonably practicable (a) publish the indicators as revised and (b) lay a copy of them before the Senedd. These national indicators were laid before the Senedd in 2021. The indicators laid on 14 December 2021 replace the set laid on 16 March 2016.
Information on the indicators, along with narratives for each of the wellbeing goals and associated technical information is available in the Well-being of Wales report.
Further information on the Well-being of Future Generations (Wales) Act 2015.
The statistics included in this release could also provide supporting narrative to the national indicators and be used by public services boards in relation to their local wellbeing assessments and local wellbeing plans.