Trade Survey for Wales: 2019
Statistics on trade in goods and services from businesses in Wales for 2019.
In this page
Main results
These are experimental statistics which are still in development. Data limitations are explained in the data considerations section.
2019 sales
- The total value of sales from businesses in Wales was estimated to be £105.3bn.
- 69% (£72.5bn) of sales from businesses in Wales were goods and 31% (£32.8bn) were services.
- 51% of sales went to customers in Wales, 25% to other parts of the UK, 15% to the rest of the EU and 3% to the rest of the world. 6% of sales were unallocated by destination.
2019 purchases
- The total value of purchases by businesses in Wales was estimated to be £66.9bn.
- 74% (£49.6bn) of purchases by businesses in Wales were goods and 26% (£17.3bn) services.
- 30% of purchases came from customers in Wales, 41% from other parts of the UK, 8% from the rest of the EU and 6% from the rest of the world. 16% of purchases were unallocated by origin.
Background information
The Trade Survey for Wales is an online survey, which captures information directly from businesses with operations in Wales to measure trade flows (in terms of sales and purchases of goods and services) to and from Wales.
Fieldwork for the first year of the survey was carried out between November 2019 and February 2020 collecting data for 2017 and 2018. Fieldwork for the second year of the survey was conducted between October 2020 and January 2021 collecting 2019 data.
This release provides statistics on trade in goods and services from businesses in Wales. This includes both sales and purchases. Findings are analysed by location, business size and sector. Locations include Wales, rest of UK, rest of EU and rest of world. Direct-to-consumer purchases are not covered. Throughout this release, analysis of business size has been based on the size of each business according UK employment values (captured within the IDBR). More information about this can be found in the technical report and associated quality report.
The results presented in this output focuses on data provided by businesses in Wales for the calendar year 2019. A detailed list of industry sectors and sector groupings included in the survey are outlined in the technical report (Appendix A). An overall response rate of 16% was achieved for the TSW 2019 (1,287 responses from a sample of 8,000 businesses). Please see the technical report and quality information for more detail.
Glossary of terms
Exports
Sales to destinations outside of the UK.
Imports
Purchases originating from countries outside of the UK.
Large businesses
Businesses with 250 or more employees in the UK.
Medium businesses
Businesses with 50 to 249 employees in the UK.
Purchases
The purchase of any goods or services by a business, including, purchases of goods or services from other parts of respondent’s business and purchases from suppliers.
Rest of EU (REU)
European Union member states (not including the United Kingdom).
Rest of UK (RUK)
All of the United Kingdom except Wales.
Rest of world (ROW)
Countries which are not in the European Union.
Sales
The sales of any goods or services by a business to a customer, including sub-contracting of services, provision of goods or services to other parts of respondent’s business and sales to customers.
Small businesses
Businesses with 3 to 49 employees.
Total trade
The value of sales + purchases.
Unallocated
The value of any sales or purchases that was not possible to allocate to a location or break down further.
Data considerations
The results of the survey are ‘Experimental Statistics’ as the method employed is still in development and there are some issues with data quality. Experimental statistics are published with a view to improving their quality over time through feedback from users and stakeholders. However, the data and analysis are still of value provided that users view them in the context of the data quality information provided.
The following data considerations should be taken into account when reviewing the results:
- Data relates to a pre-pandemic period, but the fieldwork was carried out during the coronavirus (COVID-19) pandemic between October 2020 and January 2021. As a result, business closures over this period and varying burdens for respondents may have affected responses.
- Data relates to the period prior to EU Exit, however the impact of EU Exit may have affected responses and the robustness of the data collected during this time period.
- Data are based on a voluntary online survey and the respondent bases for some detailed statistics are relatively small.
- Variability in the achieved sample across both years of fieldwork affects the ability to make robust comparisons across years. Therefore, only very broad high level comparisons are made in the commentary of this report, and direct comparisons should be avoided. Specific comparisons are discussed in the comparability and coherence section.
It should also be noted that the value of unallocated trade in TSW 2019 has increased substantially from the previous year. Unallocated values exist where businesses made sales or purchases but were not able to allocate it. More information about unallocated values can be found in the comparability and coherence section. Please see the quality report for more detail on the strengths and limitations of TSW.
Sales
Businesses responding to the Trade Survey for Wales were asked to indicate whether they had made sales of goods and/or services in the calendar year 2019, and provide the total value of these sales. They were then asked to break down their sales of goods and/or services by broad destination:
- Sales within Wales
- Sales to the rest of the UK
- Sales to the EU
- Sales to the rest of the world
If any sales of goods or services were made to the rest of the UK, businesses were asked to identify which UK countries (England, Scotland and Northern Ireland) they sold to, and the value of sales to each country.
Businesses exporting goods or services outside of the UK were asked to identify the top five origin countries for their exports of goods or services, followed by the approximate value of sales to each.
Sales overview
In 2019, the total value of sales from businesses in Wales was estimated to be £105.3bn. In the previous survey, total sales for 2018 were estimated to be £101.3bn (please see data considerations on comparing to earlier years). Goods accounted for 69% (£72.5bn) of sales from businesses in Wales in 2019, and services accounted for 31% (£32.8bn).
Sales by destination
Approximately 51% (£53.9bn) of sales were to customers within Wales, a similar proportion to the previous year. 25% (£26.0bn) went to the rest of the UK, 15% (£15.6bn) went to the rest of the EU and 3% (£3.6bn) went to the rest of the world. Unallocated sales accounted for 6% (£6.1bn).
Unallocated sales values exist where businesses made sales but were not able to allocate it to a destination. More information about unallocated sales can be found in the comparability and coherence section.

Sales by destination, by goods and services
Services sales were mostly within the UK, with 56% (£18.3bn) within Wales and 34% (£11.3bn) to other parts of the UK. Goods sales showed a greater split across destinations; 49% (£35.6bn) were made within Wales, 20% (£14.7bn) to the rest of the UK, 20% (£14.2bn) to the rest of the EU and 5% (£3.3bn) went to the rest of the world.

Sales by destination, proportion of businesses
Most businesses in Wales (91%) made sales within Wales, with just 42% making sales to the rest of the UK. A much lower proportion of businesses exported products internationally, with 14% exporting to the rest of the EU and 11% exporting beyond the EU.

Sales of (goods and services) by business size
Large, medium and small businesses accounted for 47% (£49.0bn), 29% (£30.1bn) and 25% (£26.2bn) of all sales from businesses in Wales respectively. Most sales from large businesses were goods, at 85% (£41.5bn) of sales value. Sales of goods accounted for 57% (£17.1bn) and 53% (£13.9bn) of medium and small business’ sales values respectively.

Sales by business size and destination
Around 76% (£80.0bn) of sales across all business size bands were made within the UK. Small businesses made 61% (£16.0bn) of their sales within Wales, 29% (£7.6bn) to the rest of the UK and 6% (£1.6bn) internationally. International sales accounted for 24% (£11.6bn) and 20% (£5.9bn) of large and medium business sales respectively. Large businesses had the highest amount of unallocated sales accounting for 9% (£4.2bn) of their total sales value.

Sales by sector
The ‘Trade, accommodation and transport’ sector had the highest value of overall sales accounting for 35% (£36.5bn) of all sales from businesses in Wales. ‘Manufacturing’ was the second highest with 30% (£31.4bn), followed by ‘Business and other services’ with 14% (£15.2bn), ‘Construction’ with 12% (£12.3bn) and ‘Primary sector and utilities’ with 9% (£9.9bn).

Sales by sector and destination
Around 77% (£27.9bn) of sales value within the trade accommodation sector was within Wales, 18% (£6.4bn) to the rest of the UK and 3% (£1.2bn) to the rest of EU. The manufacturing sector had 44% (£13.8bn) of its sales value to the rest of EU and 8% (£2.7bn) to the rest of world. Sales within other sectors were mostly within the UK.
| Business Sector (a) | Wales | Rest of the UK | Rest of EU | Rest of World | Unallocated | Total |
|---|---|---|---|---|---|---|
| Trade, accommodation and transport | 27,890 | 6,381 | 1,233 | 187 | 760 | 36,451 |
| Manufacturing | 1,553 | 10,012 | 13,810 | 2,660 | 3,354 | 31,389 |
| Business and other services | 9,970 | 3,827 | 373 | 607 | 392 | 15,169 |
| Construction | 9,808 | 1,788 | * | * | 572 | 12,324 |
| Primary sector and utilities | 4,719 | 4,018 | * | * | 1,036 | 9,926 |
| Total | 53,940 | 26,026 | 15,569 | 3,611 | 6,113 | 105,259 |
Source: Trade survey for Wales
(a) Businesses making sales in 2019 (1,163). Trade, accommodation and transport (450), Manufacturing (203), Business and other services (338), Construction (124) and Primary sector and utilities (48).
* indicates that figures have been suppressed where only a small response rate was acquired.
Sales within the rest of the UK by country
Sales to the rest of the UK accounted for a quarter (£26.0bn) of all sales from businesses in Wales. Of these, most of the sales were to England (79% and £20.7bn), followed by Northern Ireland and Scotland with 3% (£0.8bn) and 3% (£0.7bn) respectively. A further 15% (£3.8bn) were unallocated. A small number of businesses commented that they found it difficult to break down UK sales by individual country, as this information was not recorded on their accounting systems.

Of the £26.0bn of sales value to the rest of UK, the manufacturing sector had the largest proportion (38%, £10.0bn) of this sales value. This is followed by the trade, accommodation and transport sector with 25% (£6.4bn) and Primary sector and utilities with 15% (£4.0bn).

Sales to England made up the majority of rest of UK sales. The manufacturing sector had the largest value of sales to the rest of the UK, with England accounting for 87% (£8.7bn) of sales, Northern Ireland 6% (£0.6bn) and Scotland 3% (£0.3bn).
| Business Sector (a) | England | Scotland | Northern Ireland | UK Unallocated | Rest of UK Total |
|---|---|---|---|---|---|
| Manufacturing | 8,686 | 291 | 557 | 478 | 10,012 |
| Trade, accommodation and transport | 4,263 | 352 | 119 | 1,647 | 6,381 |
| Primary sector and utilities | 3,961 | * | * | 35 | 4,018 |
| Business and other services | 2,019 | 71 | 107 | 1,630 | 3,827 |
| Construction | 1,747 | * | * | 27 | 1,788 |
| Total | 20,676 | 748 | 784 | 3,818 | 26,026 |
Source: Trade survey for Wales
(a) Businesses making sales in 2019 (1,163). Trade, accommodation and transport (450), Manufacturing (203), Business and other services (338), Construction (124) and Primary sector and utilities (48).
* indicates that figures have been suppressed where only a small response rate was acquired.
Products sold in UK
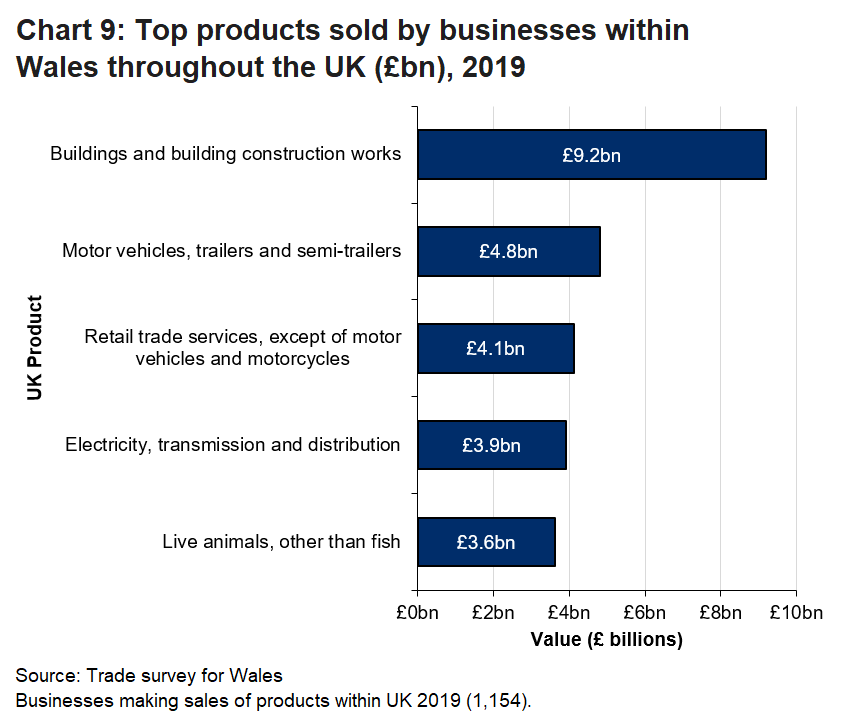
Products sold by businesses in Wales in the UK
Businesses in Wales were asked to select, from a list, the top 5 products they sold within the UK as a whole and their value. From a weighted estimate based on 1,213 responses, 12% (£9.2bn) of sales value was in ‘buildings and building construction works’ products. This was followed by 6% (£4.8bn) of sales value in ‘Motor vehicles, trailers and semi-trailers’ products and 5% (£4.1bn) of sales value in ‘Retail trade services, except of motor vehicles and motorcycles’ products.
International exports
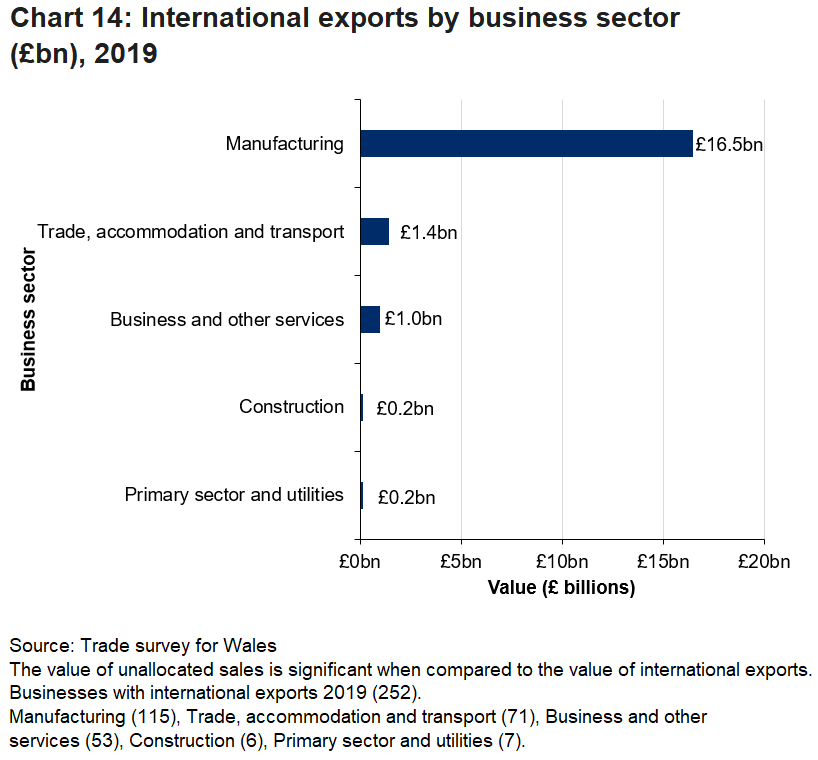
In 2019, the value of international exports from Wales was estimated to be £19.2bn, this is broadly similar to the 2018 estimate of £19.6bn. It should be noted that the value of unallocated sales is significant when compared to the total value of international exports, and has increased significantly from the 2018 estimates. This is discussed further in the comparability and coherence section.

The majority of international exports went to the rest of EU, accounting for 81% (£15.6bn) with 19% (£3.6bn) of international exports going to the rest of the world. Goods accounted for 91% (£17.5bn) of all allocated international exports.

Large businesses accounted for 61% (£11.6bn) of international exports. Goods made up the majority of international exports across all size bands.

Most export sales from large and medium businesses were made to customers in the rest of EU, 90% (£10.5bn) for large businesses and 74% (£4.4bn) for medium businesses. Small businesses export sales were more evenly split between rest of EU (44%, £0.7bn) and the rest of the World (56%, £0.9bn).

The manufacturing sector accounted for the majority (86%, £16.5bn) of international exports.
Businesses were asked to identify the top five countries they exported to, and were asked for the value of sales to each of those countries. However, 20% of international export sales could not be allocated to a region and therefore the findings are incomplete. More information about international sales destinations can be found in the comparability and coherence section. Only sales to the top five countries were requested from businesses, therefore these figures do not account for all export sales. Sales figures were combined into broad global regions. A breakdown by goods and services for countries is not available.
Any international sales made by a business to countries outside of their top five were not broken down, and thus cannot be included in the international country or global region figures. In addition, some businesses may not have been able to allocate their total international exports to specific countries. Please see data tables for the results.
Purchases
Businesses responding to the Trade Survey for Wales were asked to indicate whether they had purchased goods and/or services in the calendar year 2019, and provide the total value of these purchases. They were then asked to break down their purchases of goods and/or services by broad origin:
- Purchases within Wales
- Purchases from the rest of the UK
- Purchases from the EU
- Purchases from the rest of the world
If any purchases of goods or services were from the rest of the UK, businesses were asked to identify which UK countries (England, Scotland and Northern Ireland) they purchased from, and the value of purchases from each country.
Businesses importing goods or services outside of the UK were asked to identify the top five origin countries for their imports of goods or services.
Purchases overview
In 2019, the total value of purchases from businesses in Wales was estimated to be £66.9bn. This is broadly similar to the estimate for the previous year (£67.2bn) (please see data considerations on comparing to earlier years). Goods accounted for three quarters (74% and £49.6bn) of purchases by businesses in Wales and services accounted for a quarter (26% and £17.3bn).
Purchases by origin
Approximately 30% (£20.3bn) of purchases were from within Wales, 41% (£27.1bn) were purchases from the rest of the UK, 8% (£5.2bn) from the rest of the EU and 6% (£3.8bn) from the rest of the world. Unallocated purchases accounted for 16% (£10.5bn).
Unallocated purchase value exists where businesses made purchases but were not able to allocate it from an origin. More information about unallocated purchases can be found in the comparability and coherence section.

Purchases by origin, by goods and services
Both goods and services purchases were mostly within the UK. For purchases of goods 28% (£13.7bn) were within Wales and 44% (£22.0bn) from other parts of the UK. Purchases of goods from the rest of EU and the rest of the world were 7% (£3.4bn) and 7% (£3.7bn) respectively.

Purchases by origin, proportion of businesses
Most businesses in Wales (88%) made purchases within Wales and from the rest of the UK (67%). A much lower proportion of businesses imported products internationally, with 18% importing from the rest of the EU and 10% importing beyond the EU.

Purchases (goods and services) by business size
Large, medium and small businesses accounted for 50% (£33.4bn), 28% (£18.7bn) and 22% (£14.8bn) of purchases from businesses in Wales respectively. Most purchases from large businesses were goods purchases accounting for 78% (£26.0bn) of their purchase value. Purchases of goods accounted for 65% (£12.1bn) and 77% (£11.5bn) of medium and small businesses respectively.

Purchases by business size and origin
Around 71% (£47.4bn) of purchases across all business size bands were made within the UK. 43% (£6.3bn) of purchases from small businesses were within Wales, 38% (£5.6bn) from the rest of the UK and 12% (£1.8bn) internationally. International purchases accounted for 11% (£3.6bn) and 19% (£3.6bn) of large and medium business purchases respectively. Large businesses had the highest amount of unallocated purchases accounting for 19% (£6.5bn) of their purchase value.

Purchases by sector
The ‘Trade accommodation and transport’ sector had the highest value of overall purchases accounting for 35% (£23.2bn) of all purchases from businesses in Wales. ‘Manufacturing’ was the second highest with 33% (£22.3bn), followed by ‘Construction’ with 12% (£7.9bn), ‘Business and other services’ with 10% (£6.9bn) and primary sector and utilities with 10% (£6.6bn).

Purchases by sector and origin
Almost three quarters (73% and £17.0bn) of purchases in the trade accommodation sector were made within the UK, 10% (£2.2bn) within the rest of EU and 6% (£1.4bn) from the rest of the world. The manufacturing sector had 67% (£15.0bn) of its purchase value within the UK and 12% (£2.6bn) from the rest of EU and 9% (£2.1bn) from the rest of the world. Purchases within other sectors were mostly within the UK.
| Business Sector (a) | Wales | Rest of the UK | Rest of EU | Rest of World | Unallocated | Total |
|---|---|---|---|---|---|---|
| Trade, accommodation and transport | 7,038 | 9,945 | 2,225 | 1,393 | 2,584 | 23,185 |
| Manufacturing | 3,545 | 11,486 | 2,622 | 2,090 | 2,530 | 22,273 |
| Construction | 5,041 | 2,734 | * | * | 102 | 7,896 |
| Business and other services | 3,060 | 1,436 | 211 | 316 | 1,906 | 6,929 |
| Primary sector and utilities | 1,611 | 1,522 | * | * | 3,328 | 6,572 |
| Total | 20,295 | 27,123 | 5,181 | 3,806 | 10,450 | 66,855 |
Source: Trade survey for Wales
a) Businesses making purchases in 2019 (1,076). Trade, accommodation and transport (422), Construction (120), Manufacturing (198), Business and other services (289) and Primary sector and utilities (47).
* indicates that figures have been suppressed where only a small response rate was acquired.
Purchases from the rest of the UK by country
Purchases within the rest of the UK accounted for 41% (£27.1bn) of all purchases by businesses in Wales. Of these, most of the purchases were from England (67% and £18.3bn), followed by Northern Ireland and Scotland with 2% (£0.6bn) and 1% (£0.3bn) respectively. A further 29% (£7.9bn) of UK purchases were unable to be allocated, a small number of businesses commented that they found it difficult to break down UK purchases by individual country, as this information was not recorded on their accounting systems.

Of the £27.1bn of purchase value within the rest of UK, ‘Manufacturing’ had the highest proportion of purchases within the rest of the UK with 42% (£11.5bn) of Welsh business purchases.37% (£9.9bn) was within the ‘Trade, accommodation and transport’ sector.

Businesses in Wales mostly made UK purchases within England. The ‘Manufacturing’ sector had the largest value of purchases from the rest of the UK, with England accounting for 38% (£4.4bn) of purchase value in this sector. However, 55% (£6.3bn) of UK purchases by the ‘Manufacturing’ sector was unable to be allocated to UK nations. Unallocated purchase value exist where businesses made purchases but were not able to allocate it to an origin. More information about unallocated purchases can be found in the comparability and coherence section.
| Business Sector (a) | England | Scotland | Northern Ireland | UK Unallocated | Rest of UK Total |
|---|---|---|---|---|---|
| Manufacturing | 4,376 | 168 | 595 | 6,347 | 11,486 |
| Trade, accommodation and transport | 8,884 | 54 | 29 | 978 | 9,945 |
| Primary sector and utilities | 1,432 | * | * | 29 | 1,522 |
| Business and other services | 1,046 | * | * | 373 | 1,436 |
| Construction | 2,532 | * | * | 199 | 2,734 |
| Total | 18,270 | 283 | 643 | 7,927 | 27,123 |
Source: Trade survey for Wales
(a) Businesses making purchases from the rest of UK in 2019 (807). Manufacturing (185), Trade, accommodation and transport (321), Primary sector and utilities (33), Business and other services (195), Construction (73).
* indicates that figures have been suppressed where only a small response rate was acquired.
International imports
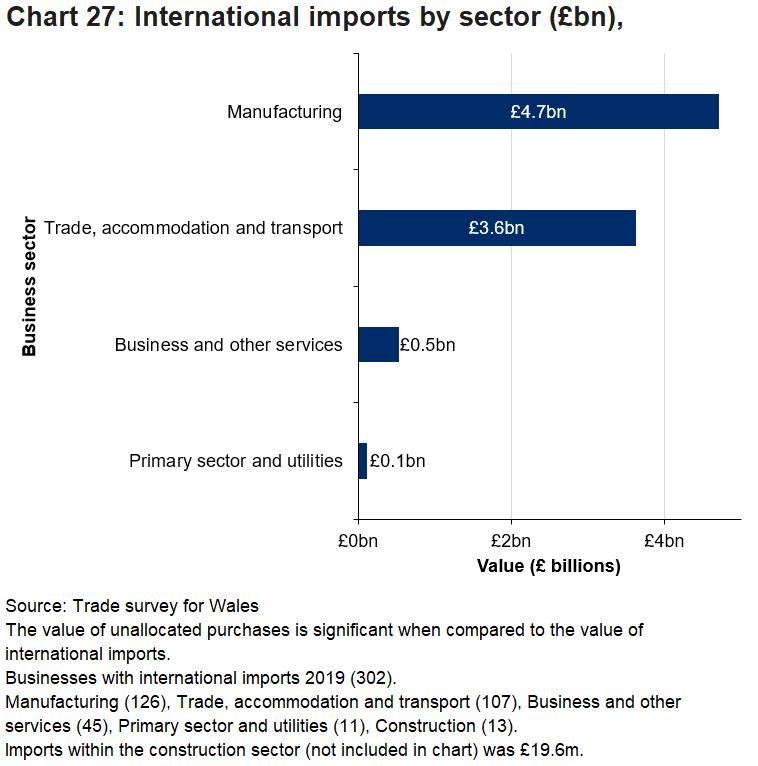
The value of international imports to businesses in Wales was estimated to be £9.0bn. Goods accounted for 78% (£7.0bn) of all international business imports.
It should be noted that the value of unallocated purchases is significant when compared to the total value of international imports, and has increased from the 2018 estimates. This is discussed further in the comparability and coherence section.

The majority of services imports came from the rest of EU (92%, £1.8bn). Goods imports were more evenly split between the rest of EU (48%, £3.4bn) and the rest of the world (52%, £3.7bn).

Goods made up 78% (£7.1bn) of international imports. Across all size bands, the majority of international business imports were goods.

International imports were almost evenly split between the rest of EU and rest of the world for small and large businesses. Medium size businesses had a majority of international imports from the rest of EU.

International imports were mostly made by the manufacturing sector (52%, £4.7bn). The Trade, accommodation and transport sector accounted for 40% (£3.6bn) of international imports.
Total trade
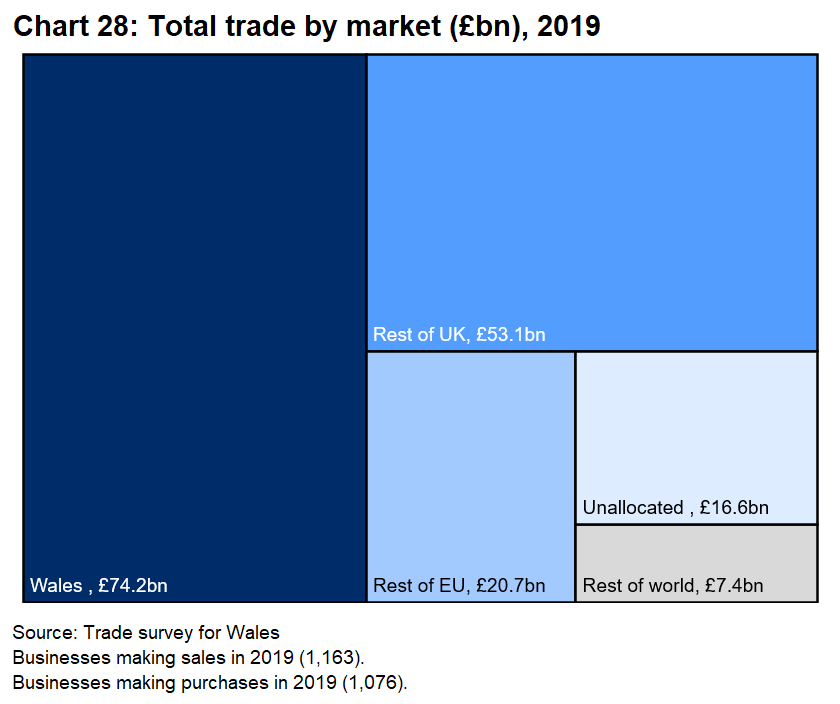
Total trade estimates are presented to give an overview of the relative overall importance of broad markets. Estimates presented for total trade have been produced by aggregating results for the separate sales and purchases sections. It should be noted that the estimates have limited coverage, as outlined in the ‘Trade Survey for Wales, 2019: quality report’, and should not be used to calculate a trade balance.
The value of total trade (sales + purchases) from businesses in Wales in 2019 was £172.1bn. This is slightly higher than the estimate for 2018 (£168.4bn). Approximately 43% (£74.2bn) of total trade was within Wales, 31% (£53.1bn) was with the rest of the UK. 16% of trade value was with international markets, 12% (£20.8bn) with the rest of the EU and 4% (£7.4bn) with the rest of the world. 10% (£16.6bn) of trade value was unallocated.
Comparability and coherence
TSW comparison across years
Broad comparisons between TSW 2019 and previous years are presented for illustrative purposes only. Variability in the achieved sample across both years of fieldwork may affect the ability to make robust comparisons across the years, as well as other external factors see the quality report for more detail. Breakdowns by destination, business size and sector have shown greater variability year-on-year (YoY), specific comparisons are discussed below.
It should also be noted that the value of unallocated trade in TSW 2019 has increased substantially from the previous year. Unallocated trade is a result of businesses providing the total value of their sales and/or purchases but unable to provide a geographical breakdowns of this trade. Unallocated sales increased from £1.0bn in 2018 to £6.1bn in 2019 and unallocated purchases increased from £7.8bn to £10.5bn in 2019. It is important to consider these changes when looking at results across years. A proportion of the value changes seen across years is likely to be a result of an increase in unallocated trade value.
In 2019 sales from businesses in Wales to the rest of the world was £3.6bn compared to £7.8bn in the previous year. This volatility is likely driven by the increase in unallocated sales which would have formed some of the sales to the rest of world, and does not necessarily reflect on-the-ground changes.

In 2019 purchases from businesses in Wales from the rest of UK were £27.1bn compared to £34.3bn in the previous year. This may have been driven by decreases in purchases in the manufacturing sector (as shown in chart A6), sample variations and/or respondent profiles across the years.

In 2019 sales value from large businesses in Wales was £49.0bn compared to £55.3bn in the previous year and sales value by medium businesses was £30.1bn compared to £19.2bn in the previous year. Sample variation and/or respondent profiles may have contributed to the cause of these changes.

In 2019, purchase value among large businesses in Wales was £33.4bn compared to £40.0bn in the previous year and purchase value among medium businesses was £18.7bn compared to £12.1bn in the previous year. This may be due to sample variation and/or respondent profiles across the two years leading to uncertainty with year-on-year comparisons.

In 2019, sales from businesses in Wales within the ‘Business and other services’ sector was £15.2bn compared with £7.2bn in the previous year. ‘Construction’ also showed a big change from £7.1bn to £12.3bn. These changes may be due to the difference in sample variation and/or respondent profiles.

In 2019 purchases from businesses in Wales within the ‘Manufacturing’ sector decreased by approximately a fifth. This is likely due to the decrease seen in rest of the UK purchases.

Comparison to existing statistics in international trade
Despite the difficulties in making a direct comparison between TSW trade estimates and those published by HMRC and ONS, high level TSW findings are presented alongside the equivalent existing estimates of international trade for transparency. 2018 data has been used for the services comparison as this is the most recent services data for Wales available from ONS at the time of writing.
Further analysis conducted on 2019 goods trade data is also a useful point of comparison: Patterns of Welsh trade by destination, product and business characteristics: 2019 - Office for National Statistics (ons.gov.uk)
It should be noted that the unallocated values have increased significantly from the 2018 estimates. Unallocated values exist where businesses traded but were not able to allocate it to a destination or origin. This may in turn impact the international trade values produced using the TSW methodology.
The existing sources estimate Welsh international goods and services exports to be around £23.7bn in 2019. This is compared to the TSW estimate of £19.2bn. The following comparisons of the estimates should be treated with caution with appropriate consideration of the differences in methodologies, as well as the increased unallocated trade figure in the TSW findings in 2019. Furthermore as noted in the quality report, the TSW sample excluded some sectors, most notably within the financial services sector. For a more realistic comparison ‘financial and insurance activities’ should be excluded from the International trade in services figures, however this is not possible since the data are suppressed.
| Welsh international exports (£ millions) | TSW estimate | Alternative estimate (a) | Difference |
|---|---|---|---|
| Total international exports | 19,180 | 25,215 | -6,035 |
| Total international exports: Rest of EU | 15,569 | 13,641 | 1,928 |
| Total international exports: Rest of the world | 3,611 | 11,574 | -7,963 |
| Goods: Rest of EU | 14,183 | 10,760 | 3,423 |
| Goods: Rest of the world | 3,316 | 7,012 | -3,696 |
| Services: Rest of EU | 1,386 | 2,881 | -1,495 |
| Services: Rest of the world | 295 | 4,562 | -4,267 |
Source: Trade survey for Wales 2019, HMRC, ONS
(a) Services are based on the year 2018 and includes a small value within financial and insurance activities.
The existing sources estimate Welsh international imports to be around £22.9bn in 2019. This is compared to the TSW estimate of £9.0bn. The following comparisons of the estimates should be treated with caution and appropriate consideration of the differences in methodology. As noted in the quality report, the TSW only collects business purchases and imports, and excludes direct-to-consumer purchases, which may have a bearing on these differences.
| Welsh international imports (£ millions) | TSW estimate | Alternative estimate (a) | Difference |
|---|---|---|---|
| Total international imports | 8,987 | 23,369 | -14,382 |
| Total international imports: Rest of EU | 5,181 | 9,550 | -4,369 |
| Total international imports: Rest of the world | 3,806 | 13,819 | -10,013 |
| Goods: Rest of EU | 3,400 | 6,905 | -3,505 |
| Goods: Rest of the world | 3,654 | 11,312 | -7,658 |
| Services: Rest of EU | 1,781 | 2,645 | -864 |
| Services: Rest of the world | 152 | 2,507 | -2,355 |
Source: Trade survey for Wales 2019, HMRC, ONS
(a) Services are based on the year 2018 and includes a small value within financial and insurance activities.
In 2019 the TSW estimates France was Wales’ top export partner with £9.5bn export value from businesses in Wales. This was followed by Germany (£1.5bn) and the United States (£1.2bn). The following estimates are significantly different from HMRC estimates and should be treated with caution using the appropriate caveats in the limitations. A key difference is methodology HMRC is admin data, based on customs declarations so will have more complete coverage. The inclusion of UK supply chains in the TSW (including inter-company transfers) may also cause further divergence from existing estimates. Inter-company transfers from Wales to other regions of the UK will be captured as domestic trade in TSW results, irrespective of whether the final customer location is international. This differs from the existing estimates which use data collected at the UK firm level, where sales to international customers will be captured as such and retrospectively apportioned to regions of the UK.
| Country | TSW estimate | Country | HMRC estimate (a) |
|---|---|---|---|
| France | 9,515 | Germany | 2,881 |
| Germany | 1,501 | France | 2,819 |
| United States | 1,247 | United States | 2,744 |
| Netherlands | 378 | Ireland | 1,696 |
| Japan | 338 | Netherlands | 981 |
| China | 298 | Belgium | 547 |
| Italy | 278 | Spain | 471 |
| Spain | 192 | United Arab Emirates | 463 |
| Portugal | 176 | China | 407 |
| Ireland | 156 | Turkey | 338 |
Source: Trade survey for Wales 2019, HMRC 2019
(a) HMRC estimate includes goods only.
Quality and methodology information
These are experimental statistics as the method employed is still in development, and there are some known data quality issues.
Our ‘Trade Survey for Wales, 2019: quality report’ provides further detail of key quality information and ‘Trade Survey for Wales, 2019: technical report’ provides methodology information.
Well-being of Future Generations Act (WFG)
The Well-being of Future Generations Act 2015 is about improving the social, economic, environmental and cultural wellbeing of Wales. The Act puts in place seven wellbeing goals for Wales. These are for a more equal, prosperous, resilient, healthier and globally responsible Wales, with cohesive communities and a vibrant culture and thriving Welsh language. Under section (10)(1) of the Act, the Welsh Ministers must (a) publish indicators (“national indicators”) that must be applied for the purpose of measuring progress towards the achievement of the wellbeing goals, and (b) lay a copy of the national indicators before the National Assembly. The 46 national indicators were laid in March 2016.
Information on the indicators, along with narratives for each of the wellbeing goals and associated technical information is available in the Wellbeing of Wales report.
Further information on the Well-being of Future Generations (Wales) Act 2015.
The statistics included in this release could also provide supporting narrative to the national indicators and be used by public services boards in relation to their local wellbeing assessments and local wellbeing plans.
Contact details
Statistician: James Koe
Telephone: 0300 025 9016
Email: stats.trade@gov.wales
Media: 0300 025 8099
SFR 260/2021