Trade Survey for Wales: technical report, 2019
An overview of the data collection, including a visual representation of the data journey, and outlines the survey timeline.
In this page
Overview
Background
The Welsh Government (WG) commissioned IFF Research (IFF) to pilot the Trade Survey for Wales (TSW) on their behalf. In its second year, the survey produces experimental statistics from information captured directly from businesses on trade flows to and from Wales. This second year of fieldwork was carried out between the19 October 2020 and 7 January 2020, before the UK officially left the EU trading block (31 January 2020).
The rationale for the TSW stemmed from the need to have a more detailed evidence base to underpin WG’s policymaking. Increased evidence would enable WG to:
- have a better understanding of Wales’ economy, including interlinkages between Wales-based businesses and those in other parts of the UK and abroad
- more accurately assess potential impacts of the UK’s proposed future trading relationships, on businesses in Wales and the wider economy
Welsh Government Analysts were responsible for:
- scoping the TSW content
- drawing the sample
- setting up a governance framework for TSW oversight with key WG stakeholders
- commissioning the main-stage fieldwork and the analysis of survey results
- quality assuring the analysis and compiling the publications
IFF were commissioned to:
- collect data from respondent businesses
- chase businesses that had not completed the survey by the deadline date
- validate respondent business data through desk research and clarification phone calls
- prepare and deliver data updates, and the final data file, to WG
- produce estimates of Wales’ trade from survey responses
This Technical report provides an overview of this survey years’ data collection, including a visual representation of the data journey, the survey timeline with letter templates sent to businesses throughout fieldwork.
The accompanying Quality report outlines the quality aspects of the survey methodology and statistics produced. The findings release details the results of the survey.
Report structure
This Technical report covers each element of the 2019 TSW data collection and delivery process. It provides an overview of the project, from initial postal contact with sampled businesses, through to the validation, imputation and weighting processes. The overall structure of the report is as follows.
- Overview details the data collection and journey, reason for the method selected and information about the pilot study.
- Sample sets out how the sample was selected and which businesses were included within the sampling strategy.
- Timeline outlines the project timeframe, and includes a Gantt chart showing the mainstage fieldwork timeline.
- Postal and email contact with businesses describes the invitation and reminder letters sent to businesses.
- Survey completion gives an overview of the survey content and a summary of various response metrics, including time spent completing the survey, reported costs and number of completed responses in Welsh and English, and telephone responses.
- Incoming contact with businesses details the call handler training that took place and the queries received from businesses via telephone and email.
- Other support offered to businesses provides information on the FAQ documents supplied to sampled businesses, and the telephone chasing which took place throughout fieldwork, including how telephone numbers were sourced. A breakdown of the outcome of the chasing is also provided.
- Response rates summarises the response rates achieved.
- Validation and Analysis details the validation and the key decisions taken in analysing the results, the imputation methodology and the number of cases where a value was imputed, and a summary of the weighting methodology used and the rationale behind it.
- Appendices which include survey communications and the questionnaire.
Overall data collection and data journey
The survey was conducted using a push-to-web approach. Sampled businesses were initially sent a bilingual (Welsh and English) postal invitation letter (Appendix A) encouraging them to go online to complete the TSW.
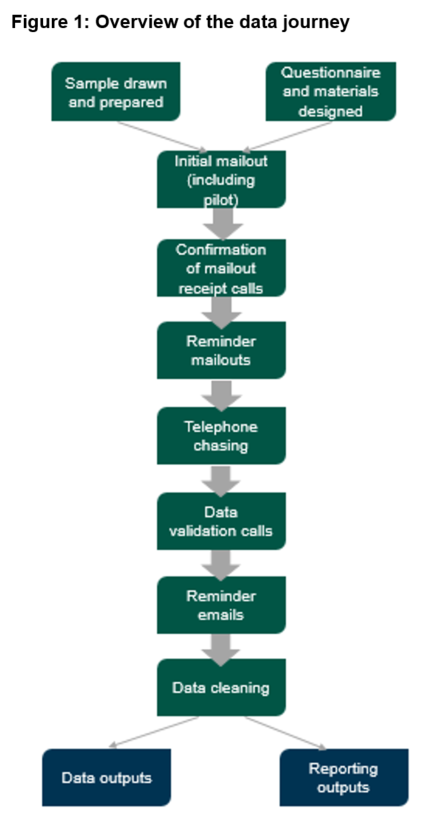
Fieldwork took place whilst COVID-19 restrictions were in place in both Wales and the rest of the UK. The TSW was voluntary; businesses were invited to take part via an initial invitation letter, followed by a phone call to confirm receipt of the initial invitation letter, one reminder letter, and a subsequent reminder email (where an email address for the business was held). The receipt confirmation phone calls and reminder emails were to mitigate against the possibility of sampled businesses not picking-up office mail during COVID-19 restrictions. In addition, IFF undertook call chasing throughout the fieldwork period, since many businesses were working from home during the pandemic.
If respondents needed to complete the survey in more than one sitting (or more than one person needed to fill in the survey), they could do so by re-entering their access code. When they re-entered the survey, respondents were immediately taken to the last point in the survey they had reached. It was only possible to use each access code for a single survey response, so each business could only submit one return.
Throughout the data journey process, all data was stored securely in IFF’s Unicom Intelligence online storage system.
As part of regular progress updates between IFF and WG during the fieldwork phase, weekly response rate reports were compiled using survey data (which showed, for example, information on which survey sections respondents were pausing at, and respondents’ business size and sector).
Cognitive testing and Piloting
Cognitive testing and piloting was not undertaken for year two of the TSW although the Outline of survey content section, details some testing undertaken on new questions included for 2019. Please refer to the Technical report, 2018 for information on cognitive testing undertaken in year one.
Sample
Welsh Government Statisticians selected companies using a stratified approach based on employment. Some strata took a census approach with random sampling from the IDBR for other strata.
Sampling took place at the reporting unit level with selected units asked to provide information covering the activities of their Welsh local units. The sample was stratified by employment size band, and industrial sector (Standard Industrial Classification (SIC) at the 2-digit level).
UK Standard Industrial Classification of Economic Activities (SIC) (ONS)
The sample excluded businesses from the following industry sectors: of public administration, defence, human health and social work activities, activities of households as employers and extra-territorial organisations. Businesses of certain legal statuses were also excluded from the sample. These were local authority organisations, central government and most non-profit bodies (universities were included). The complete list of sector inclusions and exclusions is in the accompanying Quality report.
After considering all exclusions, the survey participants were selected from a population of approximately 33,000 reporting units with activity in Wales and employing three or more people.
All reporting units (a census) with employment of 20 or more were included, and made up the majority of the sample. Different approaches were taken for those in the 3 to 19 employment.
| Strata definition | Percentage of records selected | Records selected |
|---|---|---|
| 20 + employment | 100% | 5,970 |
| 3 to 19 employment and reported sales/purchases outside wales in previous survey | 100% | 178 |
| 3 to 19 employment | 7% | 1,852 |
Source: IDBR
A stratified random sample was taken of the remaining businesses in the 3-19 employment size band (those with only one local unit in Wales). These businesses were further stratified by employment size (‘3 to 9’ and ‘10 to 19’) and industrial sector (SIC section), together yielding 1,852 records. The sample was allocated based on the SIC section turnover; sectors with higher total turnover received a greater proportion of the sample. Further adjustments were made to the sample allocation to avoid under or over sampling within sub-bands.
Sampling a small proportion of businesses with 3 to 19 ensured coverage of all size bands while reducing the overall burden placed on businesses and maintaining a practical and cost-effective sample size. The rationale for over-representing larger businesses within the sample was to ensure a large proportion of the Welsh economy (total Welsh IDBR turnover) was captured. The 8,000 sampled businesses were estimated to account for 90% of turnover in Wales (from businesses with employment of 3 or more).
Timeline
The mainstage fieldwork commenced 19 October 2020 and closed on 7 January 2021.
| Task | Start date | Finish date |
|---|---|---|
| Initial mailout letter | 16/10/2020 | 16/10/2020 |
| Mainstage fieldwork | 19/10/2020 | 07/01/2021 |
| Telephone chasing | 29/10/2020 | 18/12/2020 |
| Mailout reminder letter | 10/11/2020 | 10/11/2020 |
| Validation calls | 17/11/2020 | 08/01/2021 |
| Reminder Email | 07/12/2020 | 07/12/2020 |
| Final day fieldwork | 07/01/2021 | 07/01/2021 |
Postal and email contact with businesses
Invitation and reminder letters
Businesses sampled for the TSW were initially sent a bilingual survey invitation letter on 16 October 2020 informing them of the survey and how they could complete it (a copy can be seen in Appendix B).
Reminder letters and emails
A bilingual postal reminder letter was sent on the 10 November 2020 to those who had not yet completed the survey, explaining that the deadline had been extended to 11 December 2020 (Appendix B). As a result of the reminder letter, the largest number of daily responses were received on the 16 November 2020, with 101 completions on this date.
A reminder email (Appendix C) was sent to around 1900 respondents in early December, to those businesses who had asked to have the survey emailed to them following contact with the IFF call handlers. This however had limited impact, with around 1% completing the survey after receiving the email reminder.
Survey completion
Outline of survey content
The majority of the year two TSW survey (collecting 2019 data) remained the same as the previous year (which collected 2017 and 2018 data). There were some minor changes introduced to the year two survey.
Given the lack of data on intra-UK trade, domestic traders were asked to provide their top 5-products sold and the value for each of the top 5 products sold in 2019. (This question was only asked of international traders in year 1, however the response rate (232 out of 1003 respondents) meant this data had to be suppressed for publication).
The three following imports questions were removed due to a low response rate in 2018 (229 out of 836 respondents).
- Select up to 5 of the top goods or services imported (from outside of the UK) in 2017 and 2018.
- Enter the value (£) for each of the top 5 imports in 2017 and 2018.
- Enter the value (£) for each of these import locations in 2017 and 2018.
Two new ‘closed response questions were added because of policy interest in the topic areas of i) Mode 5 services and ii) international public sector contracts.
- The 'Mode 5' services question was asked only to manufacturer respondents who indicated they sold goods in 2019.
“In the process of selling those goods, are there any services embedded in the overall product (e.g. data) or offered as part of the sale of the good (e.g. a servicing/maintenance contract or software support, subscription service)?” (‘yes’/‘no’ response options). - The international public sector contracts question was asked only to those that export internationally in 2019.
"Have you ever bid for, or won, public sector and/or government contracts to deliver goods or services in (a) Europe (b) overseas markets outside of Europe (RoW)?" (‘yes’/‘no’ response options).
To make the survey as short as possible and reduce respondent burden, questions were routed where possible to allow respondents to automatically miss pages that were not relevant to them.
Although respondents could not skip forward through the questions (due to routing constraints), they could move backwards in the survey to review and edit their previous answers before submitting the survey.
The year two survey asked respondents for information for one year of data, for 2019. This saw the burden of the survey reduced in comparison to year one, which had requested two years’ worth of data (2017 and 2018).
Response metrics
The survey was accessible 24 hours a day during the fieldwork period, although the peak periods of activity were usually during office hours.
There are two sources of data which may be considered when measuring time taken to complete the survey: data collected by the system when surveys were completed online, and self-reported figures provided by respondents within the survey.
Considering firstly the system metrics, an average completion time of 21 minutes was recorded for year two; a reduction of 28 minutes or 57% from the year one survey, which had taken respondents an average of 49 minutes to complete. This year two average completion time of 21 minutes only includes businesses who completed the survey on one single day (896).
The Code of Practice for Statistics advises public bodies collecting statistical data that the burden of the survey for respondents should be proportionate to the benefits arising from use of the survey data collected. A question therefore was included within the survey asking businesses for an estimate on how much time they felt it had taken them to complete the survey. The question asked respondents to include:
- time taken to become familiar with the questionnaire
- time of everyone who helped the business complete the questionnaire
- time spent extracting and preparing information from their systems
- any other time spent in relation to the questionnaire
The majority (88%) of micro businesses reported completion of the survey in under two hours, compared with 84.5% of small and 75.2% of medium businesses (See Business size section). Nearly three quarters of large businesses (73.7%) reported completion in under two hours, with 19.5% reporting they spent over three hours on completing the survey. These figures exclude seven businesses who said it took them zero minutes to complete. It also excludes six businesses who said the survey took them 24 hours or longer to complete.
| Time spent | Micro (3 to 9) (a) | Small (10 to 49) (b) | Medium (50 to 249) (c) | Large (250+) (d) |
|---|---|---|---|---|
| <1 hour | 62.0 | 48.5 | 40.1 | 36.8 |
| 1 hour to < 2 hours | 26.1 | 36.0 | 35.1 | 36.8 |
| 2 hours to < 3 hours | 7.0 | 8.7 | 13.8 | 6.8 |
| 3+ hours | 4.9 | 6.7 | 11.0 | 19.5 |
| Total | 100 | 100 | 100 | 100 |
Source: Trade Survey for Wales 2019
(a) Micro businesses (156)
(b) small businesses (642)
(c) medium businesses (335)
(d) large businesses (154)
There was a clear trend of survey completion primarily on weekdays and survey completion mainly occurred during typical business hours.
The number of businesses who completed the survey over one day or more (for example, they started it on Monday and didn’t click submit until Thursday) was 317. It was not possible to establish how many minutes during these periods these respondents were active in the survey.
Reported cost of completing the survey
A question in the TSW asked respondents to estimate how much completing the survey cost their business, including the time of anyone involved in filling out the survey.
Of those who reported estimated costs incurred in completing the survey (1213), a majority (61.3%) estimated the survey cost their business less than £50 to complete. Table 4 outlines the self-reported estimated costs broken down by company size. Compared to the previous year, the costs reported in TSW 2019 were reduced for a greater proportion of businesses, thought to reflect the reduced burden for businesses in year two as one reference years’ worth of data (2019) was requested, as well as increased survey familiarity for those businesses who previously responded to TSW. In year one, of those who reported estimated costs incurred in completing the survey (971), 53.9% estimated the survey cost their business less than £50 to complete; the remainder estimated it cost their business £50 or more to complete.
| Cost of completing the survey (£) | Micro (3 to 9) (a) | Small (10 to 49) (b) | Medium (50 to 249) (c) | Large (250+) (d) |
|---|---|---|---|---|
| 0 | 22.2 | 17.7 | 15.3 | 20.3 |
| 1 to <50 | 43.1 | 46.6 | 42.4 | 31.9 |
| 50 to <100 | 25.7 | 16.1 | 18.7 | 23.2 |
| 100 to <200 | 4.9 | 14.1 | 13.7 | 14.5 |
| 200+ | 4.2 | 5.6 | 10.0 | 10.1 |
| Total | 100 | 100 | 100 | 100 |
Source: Trade Survey for Wales 2019
(a) Micro businesses (156)
(b) small businesses (642)
(c) medium businesses (335)
(d) large businesses (154)
Compliance Costs
Compliance costs for businesses completing the TSW were estimated using GSS guidance. The total cost for all businesses to complete the survey was calculated to be £27,319. Where: Burden = [{Number of respondents x median completion time (hours)} + {Number of businesses recontacted for validation x Median time (hours) taken for re-contact}] x hourly_rate (based on the Annual Survey of Hours and Earnings, table 14.6A 2019 using managers and senior officials hourly pay). Final calculation: Burden = [(1,287 x 1) + (64 x 0.15)] x 21.07 = £27,319.36.
This financial cost is calculated based on the time taken to complete the questionnaire, an appropriate hourly rate and external costs incurred (for example, costs to the business of a bookkeeper or accountant to aid in completion of the survey). Subsequent contact between IFF and respondents to validate responses is also included in calculations since it contributes to respondent burden.
Respondents were asked the length of time and cost involved in completing the TSW. Based on the self-reported question in the survey the median completion time for all responses was approximately 60 minutes. 64 businesses were re-contacted over the phone for validation. The median duration for these calls was approximately 9 minutes.
Completes in Welsh and English
The TSW complied with the Welsh Language Standards, meeting the WG’s commitment to treating the Welsh and English languages equally. Respondents were given the opportunity to complete the survey in either Welsh or English and could switch easily between the two languages throughout when completing the online survey.
The system only captured language information for those who clicked ‘submit’ on the final page of the survey; this captured the language they were viewing on the final page. Of the 1,287 respondents, 1,284 submitted the survey in English and three did so in Welsh, although some may have completed parts of the survey in Welsh.
Telephone data collection
In instances where businesses were unable to complete online, IFF call handlers were able to collect data over the phone. Due to the complexity of the information being collected, this was only provided as a last resort, where technical issues or infrastructure within the business prevented them from completing online, or where the business’s data was relatively simple. A total of 5 respondents completed over the phone.
Incoming contact with businesses
Businesses were able to contact IFF via phone and email with any queries they had relating to the survey. In total, 389 queries were received either by email (136) or by telephone (253); a much lower volume than the 973 queries received in year one. Typically, businesses who made contact wanted to ask for an amendment to their business details, such as an updated business address (161 queries), ask general questions about the survey (57 queries) or opt out of the survey (56 queries).
Call handlers logged ‘dead letters’, a letter that was undeliverable and typically with an incorrect address, and then conducted desk research to find alternative details for these businesses. In total, 67 letters were returned to IFF and updated details were sourced for 47 of these businesses. The low number of dead letters did not affect the overall 16% response rate when deducted from the 8,000 sample.
Other support offered to businesses
FAQ documents
Alongside the initial invitation letter, businesses were sent a FAQs sheet which contained:
- background detail on the TSW and its importance to the WG
- information about IFF
- how to verify the survey was genuine
- how businesses were selected
- reassurance about confidentiality
- the deadline for completion
- how to complete the survey if the business was not primarily based in Wales, had no data to report or had entered into administration/receivership
The online survey site contained a longer version of the FAQs, with some more detailed information than could be included with the invitation letter. Additional information included in the online FAQs related primarily to the survey itself, including:
- more detail on how data provided would be used
- the process for reporting any technical issues experienced with the survey
- how to provide feedback on the survey to the WG
- how IFF securely received respondents’ personal details
Response chasing
To encourage businesses to respond, telephone chasing took place from the 29 October 2020 to 18 December 2020. From the sample of 8,000 businesses, 6,292 (79%) were successfully contacted, with 476 going on to complete the survey.
Other metrics of response chasing
The try-count records the number of contact attempts made to each business during the chasing exercise. Most businesses were reached within one or two calls, although there were some that required further chasing [Table 5]. The average number of contact attempts made was 2.75.
| Tries | Number |
|---|---|
| 0 | 1,525 |
| 1 | 2,000 |
| 2 | 1,268 |
| 3 | 887 |
| 4 | 562 |
| 5 | 397 |
| 6 | 315 |
| 7 | 262 |
| 8 | 311 |
| 9 | 366 |
| 10 | 95 |
| 11 | 9 |
| 12 | 2 |
| 13 | 1 |
On average, a respondent took 6 days to submit their data from the point at which they ended their conversation with the call handler. Of the 465 respondents who received a chasing call and who then went on to successfully complete the survey (including those who did not explicitly agree to complete, such as those who were left a voicemail message), an average of 10.3 days elapsed between receiving the call and submitting the survey; 24% (110) of respondents who received a call went on to complete submitted data within 24 hours of receiving the call, while 49% (230) took over a week.
Response rates
An initial response rate of 16% was achieved, with 1,287 respondents taking part in the survey out of a possible 8,000 businesses. Only responses where both the sales and/or purchases sections of the survey had been completed, and where no discrepancies within the data were flagged, were included within the analysis. It was encouraging to see an increase from the year-one response rate of 14%, particularly given ongoing disruption due to COVID-19 related restrictions.
In terms of response rates for businesses according to business size (based on UK employment values within the IDBR), Medium-sized businesses had the highest response rate (19%), whilst Large businesses had the lowest (11%).
| Business size | All responses | Sample | Response rate |
|---|---|---|---|
| Micro (3 to 9) | 156 | 1,273 | 12% |
| Small (10 to 49) | 642 | 3,471 | 18% |
| Medium (50 to 249) | 335 | 1,794 | 19% |
| Large (250+) | 154 | 1,462 | 11% |
| Total | 1,287 | 8,000 | 16% |
Source: Trade Survey for Wales 2019
The response rate was fairly consistent across different business sectors, but those in Construction and Manufacturing had the highest response rates (18%).
| Business sector | All responses | Sample | Response rate |
|---|---|---|---|
| Business and Other Services (a) | 390 | 2,198 | 17% |
| Construction | 133 | 740 | 18% |
| Manufacturing | 215 | 1,208 | 18% |
| Primary Sector and Utilities | 55 | 401 | 14% |
| Trade, Accommodation and Transport | 494 | 3,316 | 15% |
| Total | 1,287 | 8,000 | 16% |
Source: Trade Survey for Wales 2019
(a) Sectors were grouped into five categories throughout data processing and analysis. After consultation with WG, it was agreed to group sectors using a standard sector grouping used in the Employer Skills Survey, but 'Non-market services' were combined with 'Business and other services' due to low base sizes.
Validation and analysis
The online questionnaire contained automated validation checks to flag any discrepancies or unusual data. Further details can be found in the Quality report.
Business size
Throughout the data processing and analysis of TSW, businesses were grouped into categories based on the number of employees they had (business size). Further details can be found in the Quality report.
Imputation
To maximise the data that could be analysed from the survey, imputation was carried out to model missing values within responses, based on other values (responses) provided within the survey.
Throughout the survey, respondents had the option of answering ‘tick box’ questions which asked to which destinations (for example, Wales, RUK) they sold, and then a subsequent question asking for the values of these selected destinations. Imputation was carried out when respondents answered a tick box question but could not provide the subsequent actual values For example, a business that selected they had Goods sales in Wales and RUK (and not REU or ROW), but then hadn’t apportioned out their total Goods sales value between these two destinations had values imputed.
Missing values were imputed based on apportioning the relevant total figure provided by the respondent in line with average proportions of sales/purchases made to each destination among businesses of a) a similar type and b) selecting the same combination of destinations.
Businesses of similar type
Average proportions were calculated within imputation groups that grouped businesses by size and sector, meaning values were only calculated from the values of similar businesses. Values were only calculated within each group if there were at least 10 other businesses who had provided exact values in the same cell as the record requiring imputation. Consequently, three imputation groups were created to account for differing base sizes within different sector and size combinations. Employment values and sector information within the IDBR were used to allocate respondents to the relevant groups. In summary:
- Imputation Group 1 was based on the 21 sector codes and 4 size bands
- Imputation Group 2 merged the sector codes into 5 broader groups but retained the 4 size bands
- Imputation Group 3 retained the 5 broader sector groups as in Group 1, but also merged the size bands into 2 broader bands
If a business requiring imputation fell into an imputation group cell containing fewer than 10 businesses giving exact values, then they were allocated to the next level down imputation group, for example, if their cell in imputation group 1 contained fewer than 10 businesses, then their imputation group 2 cell would have been used instead.
Imputation Group Categorization
Imputation Group 1
Industry sector included:
- Accommodation and food service activities
- Activities of extraterritorial organisations and bodies
- Activities of households as employers; undifferentiated goods-and services-producing activities of households for own use
- Administrative and support service activities
- Agriculture, forestry and fishing
- Arts, entertainment and recreation
- Construction
- Education
- Electricity, gas, steam and air conditioning supply
- Financial and insurance activities
- Human health and social work activities
- Information and communication
- Manufacturing
- Mining and quarrying
- Other service activities
- Professional, scientific and technical activities
- Public administration and defence; compulsory social security
- Real estate activities
- Transportation and storage
- Water supply; sewerage, waste management and remediation activities
- Wholesale and retail trade; repair of motor vehicles and motorcycles
Size band included:
- Micro
- Small
- Medium
- Large
Imputation Group 2
Industry sector included:
- Primary Sector and Utilities
- Manufacturing
- Construction
- Trade, Accommodation and Transport
- Business and Other Services
Size band included:
- Micro
- Small
- Medium
- Large
Imputation Group 3
Industry sector included:
- Primary Sector and Utilities
- Manufacturing
- Construction
- Trade, Accommodation and Transport
- Business and Other Services
Size band included:
- Micro/Small
- Medium/Large
Same combination of destinations
Apart from the questions which asked for a total value to be split by goods and services, for each type of question, there were a number of different combinations of destinations that businesses could have selected [Table 8]. Average proportions were calculated only among businesses who had also selected the same combination of answers within the imputation group cell.
| # | Wales | UK | REU | ROW | Combination example |
|---|---|---|---|---|---|
| 1 | Yes | No | No | No | WXXX |
| 2 | Yes | Yes | No | No | WUXX |
| 3 | Yes | Yes | Yes | No | WUEX |
| 4 | Yes | Yes | Yes | Yes | WUER |
Plus, the remaining 12 combinations for this set of questions.
Within these imputation group cells of similar business types and the same combination of destinations, the average proportions of sales or purchases allocated across these destinations were calculated, as opposed to average monetary values. Missing values were then calculated for each record by applying these average proportions to the actual total value provided by that business [Table 9]. For example, if a business said it had Goods sales of £1,000 in 2019, but had not said how this split between Wales, UK, REU and ROW, the average proportions would be applied as below.
| Goods | Wales | UK | REU | ROW | |
|---|---|---|---|---|---|
| Calculated average proportions | 100% | 17% | 63% | 14% | 6% |
| Values provided before imputation | £1,000 | - | - | - | - |
| Values after imputation | £1,000 | £170 | £630 | £140 | £60 |
In total, imputation was calculated across 32 variables, allowing a total of 708 values, across 208 business, to be imputed. Across these 32 variables, the highest number of values per variable that were able to be imputed was 75 and the lowest was 0. The highest percentage of total values imputed ranged from 0% to 6.97%.
Weighting
Survey data were weighted and grossed up to the total population of businesses, according to the 2019 IDBR. This was the latest available business population statistics available from the ONS at the time of the sampling.
In total, two weights were created, a ‘unit-based’ weight and a ‘turnover-based’ weight. These two types of weights were created to account for the fact that roughly half of the survey collected turnover values, and the other half collected responses for tick-box questions which suited being weighted to represent the business population of Wales in terms of reporting units. The ‘unit-based’ weights were used for analysis of ‘tick-box/coded’ based questions and ‘turnover-based’ weights were used for analysis of turnover based questions.
The weighting/grossing process involved the following steps:
- Step 1: Calculating two non-response weights comparing to the starting sample of the survey
- Step 2: Calculating two ‘unit-based’ and ‘turnover-based’ grossing weights to the total population
- Step 3: Multiplying these weights together to create the final four weights needed
Step 1: Non-response weights
As the survey was not mandatory, there was some natural variation in response rates between different types of businesses which resulted in the survey profile differing slightly from that of the starting sample of the survey. To adjust for these differences, non-response weights were calculated, using RIM (random iterative method), and applied to bring the survey profile in line with the sample.
Non-response weights were calculated by comparing the profile of achieved interviews with the 8,000 businesses in the starting sample. The variables were compared, and where there was a difference of 2 or more percentage points between the achieved interview profile and that of the sample profile, a non-response weight was applied.
Variables used to calculate non-response weights
Sector Employment (5 bands)
Groupings:
- Primary Sector and Utilities
- Manufacturing
- Construction
- Trade, Accommodation and Transport
- Business and Other Services
Size (IDBR UK employees, 4 bands)
Groupings:
- Micro (<10 employees)
- Small (10-49 employees)
- Medium (50- 249 employees)
- Large (250+ employees)
IDBR Turnover (banded)
Groupings:
- <£1 million
- £1 million - <£5 million
- £5 million - <£10 million
- £10 million - <£20 million
- £20 million - <£50 million
- £50 million - <£100 million
- £100 million+
Region (IDBR)
Groupings:
- AA. North East
- North West (BA BB)
- DC. Yorkshire and the Humber
- ED. East Midlands
- FE. West Midlands
- GF. Eastern
- GG. Eastern
- HH. London
- JG. South East
- KJ. South West
- WW. Wales
No of branches in Wales (banded)
Groupings:
- 0
- 1
- 2
- 3+
Whether business is entirely Welsh
Groupings:
- Yes
- No
Step 2: Grossing ‘unit-based’ and ‘turnover-based’ weights
The non-response weights were applied to the data, and then two different weighting grids were calculated, grouping cells by four size bands and five sector bands (the smallest number of businesses in any one cell was six and so no cell merging took place).
Weighting grid groupings
Size bands:
- Micro (<10)
- Small (10 to 49)
- Medium (50 to 249)
- Large (250+)
Sector bands:
- Primary Sector and Utilities
- Manufacturing
- Construction
- Trade, Accommodation and Transport
- Business and Other Services
The two different weighting grids compared the:
- number of units (sales and purchases) achieved in the survey compared to the population
- total turnover (sales and purchases) in the survey compared to the population
Unit grid
For the unit grid, a weight was created for each cell of the grid to gross the number of records in each cell to the number of businesses in that cell in the population (i.e. if there were 20 records in the cell and there were 100 in the population then each record received a weight of 5). The UK employment values reported within the survey were not used because data cleaning revealed these were not as reliable compared to the IDBR employment data. This was likely as the survey would in some cases have been completed by staff with knowledge of the Wales based business but not necessarily with the UK-wide overview. The unit grid was therefore calculated using the employment values provided within the IDBR.
Turnover grid
For the turnover grid, a weight was created for each cell of the grids to gross the sum of turnover for each cell (from the population and from our achieved sample) and applied to each £ of turnover so that each respondent in that cell would get a weight relative to their exact amount of turnover. The IDBR turnover figure provided in both the sample auxiliary variables and was used because, although the survey asked about Welsh turnover specifically, the IDBR turnover field relates to UK turnover and a reliable turnover figure to gross to was required.
Step 3: Creating the final four weights
These ‘unit-based’ weights and ‘turnover-based’ weights were then multiplied by the non-response weights to create the final weights.
| Weight | Applied for analysis of… |
|---|---|
| 1 UNIT_WEIGHT | Coded questions in the survey |
| 2 TURNOVER_WEIGHT | Value questions in the survey |
Glossary of terms
Ceased trading: a business that has ceased trading is no longer operating or engaged in economic activity.
Dormant: a dormant company is a company that, in legal terms, has 'no significant accounting transactions' during a financial year.
General Data Protection Regulation: the regulation in EU law on data protection and privacy in the European Union and the European Economic Area.
Goods: goods or materials of a company’s own production.
Inter-Departmental Business Register: a comprehensive list of UK businesses used by government for statistical purposes.
Purchases: the purchase of any goods or services by a business, including sub-contracting of services, purchase of goods or services from other parts of respondent’s business and purchases from suppliers outside of Wales (imports) and the UK (international imports).
Sales: the sales of any goods or services by a business to a customer, including sub-contracting of services, provision of goods or services to other parts of respondent’s business and sales made to customers outside of Wales (exports) and the UK (international exports).
Services: provision or supply of services to another business or customer.
Abbreviations
GDPR: General Data Protection Regulation
IDBR: Inter-Departmental Business Register
IFF: IFF Research
ONS: Office for National Statistics
PAYE: Pay as you earn income tax scheme
REU: Rest of EU
RIM: Random Iterative Method
ROW: Rest of World
RUK: Rest of UK
SIC: Standard Industrial Classification
TSW: Trade Survey for Wales
WG: Welsh Government