Wellbeing of Wales, 2022 - A healthier Wales
This report provides an update on progress being made in Wales towards the achievement of the 7 wellbeing goals
A PDF download of this document will be available soon.
In this page
The goal for a healthier Wales
Author: Dr William Perks
A society in which people’s physical and mental wellbeing is maximised and in which choices and behaviours that benefit future health are understood.
What have we learnt from the data in the last year?
Data covered in this chapter now all captures the impact of at least a period of the coronavirus (COVID-19) pandemic.
Life expectancy fell in the most recent period available (2018-20), which includes part of the period of the COVID-19 pandemic .
Life expectancy is higher for women, however the proportion of life spent in good health is higher for men.
Recent analysis (based on 2018 to 2020) shows that the gap in healthy life expectancy between the most and least deprived has remained wide but relatively stable.
In 2021, there were 36,135 deaths from all causes, a decrease compared to the high number of deaths seen in 2020. COVID-19 was the sixth highest cause of death in the year-to-date.
The avoidable mortality rate for Wales in 2020 was higher than all years since 2012.
The number of live births increased marginally; the first year that the number has not fallen since 2010.
Pregnant women’s healthy lifestyle behaviours at initial assessment was mixed, with a lower percentage of women self-reporting as smokers, but a higher percentage recorded as obese or with a mental health condition than the previous year.
The majority (93%) of adults reported following two or more of the five healthy lifestyle behaviours. The percentage of children reporting this hasn’t changed.
Both adults and 11 to 16 year olds reported lower levels of wellbeing during the pandemic, compared to results from prior.
Data on life satisfaction and anxiety levels, which covers most of the first year of the pandemic (2020-21), saw levels deteriorating to worse than those seen in 2011-12. More recent data from the National Survey for Wales 2021-22 suggests life satisfaction may have generally returned to pre-pandemic levels.
What is the longer term progress towards the goal?
Limited progress appears to have been made towards achieving the goal, with many of the healthier Wales national indicators remaining relatively stable and not showing significant change over the periods in which they are available. However, many of the indicators do not yet cover a long enough time period or at sufficient frequency to discern a long term trend.
The pandemic has had a dominant effect on many of the trends in the most recent data, and the implications for longer term trends is unclear. For this reason, the following long term conclusions are drawn mainly on the basis of pre-pandemic evidence.
Life expectancy had been rising since the Second World War, although at a slower pace in the past decade. However, it has fallen for the most recent period, likely reflecting the impact of the COVID-19 pandemic.
Healthy life expectancy continues to be worse for those living in more deprived areas but has remained relatively stable between 2011-2013 and 2018-2020.
Over the long-term age-standardised mortality rates (ASMRs) have been improving, falling from 1,406 deaths per 100,000 people in 1994 to 1,062 deaths per 100,000 people in 2021. This has been negatively impacted in the latest two years due to the increased numbers of deaths associated with the pandemic.
The proportion of babies born with a low birth weight has remained relatively steady over the course of the time series, typically fluctuating between 5% and 6%, though has seen a slight upward trend in recent years, following the lowest figures in 2014 and 2015.
Due to the change in the mode of the National Survey for Wales, it’s not possible to consider recent trends for healthy lifestyle measures for adults. Prior to the pandemic, between 2016-18 and 2019-20 there was no significant change in the proportion of adults who reported two or more healthy lifestyle behaviours.
The national milestone is to increase the percentage of children with two or more healthy behaviours to 94% by 2035 and more than 99% by 2050. The data shows the percentage of children meeting the national milestone remains at 88% in the 2019 academic year and has remained stable since data collection started in the 2013/14 academic year.
Adult average mental wellbeing decreased for the period covering July 2021 to January 2022 compared to 2018-19, which itself was a slight increase compared with 2016-17. However, due to the difference in collection mode and possible real change due to the pandemic, it is difficult to draw longer term comparisons for this indicator.
School Health Research Network Student Health and Wellbeing survey data collected for 11 to 16 year olds prior to the COVID-19 outbreak showed little change in mental wellbeing from previous years. However, as for adults, more recent data collected in September to December 2021 indicates a fall in the average score for 11 to 16 year olds compared to prior to the pandemic.
Average life satisfaction had been increasing since 2011-12, with slight reductions in average anxiety levels. However, the year prior to the pandemic, saw a slight deterioration in levels of both life satisfaction and anxiety. This trend continued in the first year of the pandemic with life satisfaction and anxiety levels deteriorating to levels worse than those seen in 2011-12. More recent data from the National Survey for Wales 2021-22 suggests life satisfaction may have generally returned to pre-pandemic levels.
Hazardous housing conditions have improved in the last 10 years. The most recent Welsh Housing Conditions Survey showed that 82% of dwellings were free from the most serious (category 1) hazards in 2017-18, compared with 71% in 2008. There were improvements in all tenures.
Life expectancy
Life expectancy had been rising since the Second World War, although at a slower pace in the past decade.
Life expectancy fell in the most recent period available (2018-20), which includes part of the period of the COVID-19 pandemic, compared to the previous period (2017-2019).
Life expectancy at birth was 82 years for women and 78 years for men for 2018-20. This was a slight reduction for both males and females, following higher death rates in 2020 during the COVID-19 pandemic.
Healthy life expectancy was 62 years for females and 61 years for males in 2018 to 2020.

Causes of deaths
In 2021, there were 36,135 deaths from all causes, a decrease compared to the high number of deaths seen in 2020.
The five-year average for 2022 has been provided for 2016 to 2019 and 2021, providing an up-to-date comparison that is still close to representing a usual (non-pandemic year), but not including the exceptionally high number of deaths seen in 2020.
The highest number of deaths in the year-to-date (January to July 2022) were from ischaemic heart diseases, followed by dementia and Alzheimer's disease. COVID-19 was the sixth highest cause of death in the year-to-date after being the leading cause of death in 2020 and the second leading cause of death in 2021.
Age-standardised mortality rates (ASMRs) allow for comparisons over time and area because they account for the population size and age structure.
Over the long-term ASMRs have been improving, falling from 1,406 deaths per 100,000 people in 1994 to 1,062 deaths per 100,000 people in 2021. This has been negatively impacted in the latest two years due to the increased numbers of deaths associated with the pandemic.
In 2021, the ASMRs were significantly higher for males (1,234.6 deaths per 100,000 males) than for females (916.6 deaths per 100,000 females).
In 2020, the avoidable mortality rate for Wales was statistically significantly higher than all years since 2012. Around two thirds of avoidable deaths were attributed to preventable conditions, and one third to treatable conditions.
Looking at broad groupings of cause of death, the leading cause of avoidable mortality was neoplasms. COVID-19 was the 3rd leading cause.
In 2021, there were 322 drug poisoning deaths registered in Wales, of these 210 were drug misuse deaths. The general trend in drug poisoning and drug misuse deaths in Wales has been upwards since the first statistics in 1993. The figures for 2021 are the second highest on record for drug poisoning (almost reaching the high of 2018), and the highest on record for drug misuse.
These figures are based on the year in which the death was registered, rather than when it occurred. Because of registration delays, around half of these deaths will have occurred in years prior to 2021. Delays in death registrations, which increased during the COVID-19 pandemic, are likely to have affected the figures.
Drug deaths were more common among men than women and higher rates of drug poisoning deaths were found in more deprived areas.
Over the long-term suicide rates have fluctuated from year to year but have generally been falling. 2021 registrations showed suicide rates (12.7 per 100,000 people) were higher (though not statistically significant) than 2020 but similar to levels seen in years before the pandemic. The increase in 2021 compared with 2020 is likely to reflect disruption to coroners’ inquests caused by the pandemic and so delays in death registrations. The latest figures include deaths that occurred in 2020 and were subsequently registered in 2021.
Although a slight increase was seen in 2020 rates of alcohol specific deaths have stayed relatively stable in recent years.

Inequalities in life expectancy and mortality
Inequalities in life expectancy and mortality remain wide.
Recent analysis (based on 2018 to 2020) shows that the overall gap in healthy life expectancy between the most and least deprived has remained relatively stable between 2011-2013 and 2018-2020. In the most recent time period this gap seems to have reduced slightly for males (13.3 years) and increased slightly for females (16.9 years).
The life expectancy gap is much narrower at 7.6 years for males and 6.3 years for females. But has been generally increasing in recent years for males and females, suggestive of growing inequality.
Further breakdowns of the gap in life expectancy and healthy life expectancy by health board and local authority can be seen on the Public Health Wales Health expectancies in Wales with inequality gap profile.
Males spend more of their life in good health (78.5%) compared to females (76.0%).
The proportion of total deaths that were avoidable continued to be substantially larger in the most deprived areas compared with the least deprived areas, with avoidable deaths accounting for 37.0% of all male deaths in the most deprived areas compared with 18.9% in the least deprived areas. For females the equivalent figures were 25.7% in the most deprived areas and 14.1% in the least deprived areas.
The absolute gap in avoidable mortality between the most and least deprived areas has widened to the highest level since 2003 for males and since the data time series began for females.
Avoidable mortality rates with COVID-19 as an underlying cause of death were statistically significantly higher in the most deprived areas compared with the least deprived areas.

The gap in health expectancies is calculated as the absolute difference between the least and most deprived fifths. This is a change of method since previous health expectancies releases, to improve the stability of the measure at local authority level. The gap was previously calculated using the Slope Index of Inequality (SII). The Office for National Statistics continue to publish the SII at national level as part of their Health state life expectancies release.
Low birth weight babies
The percentage of low birth weight babies has remained relatively steady over the course of the time series, typically fluctuating between 5% and 6%.
The lowest figures on record were recorded in 2014 and 2015. Since then there has been a slight upward trend in the number of low birth weight babies with 2020 being the highest on record before falling back again in 2021.
In 2021, a slightly higher percentage of female babies had low birth weight (6.2%) compared to male babies (5.3%). This is broadly consistent with the longer-term trend.
The proportion of live births with low birth weight or low gestational age was highest in the youngest and oldest mothers in 2021, though there are only a small number of births to mothers in these age groups. The percentage of babies with low gestational age and the percentage of babies with low birth weight has remained broadly stable across age groups over the last 10 years.
Also in 2021, a higher percentage of Asian babies had a low birth weight (8.4%) compared to other ethnic groups. The number of low birth weight babies per year in Wales is small when categorised by ethnic group so there can be relatively large changes from year-to-year through natural volatility. However, a larger proportion of Asian babies had low birth weights than any other ethnic group in three out of the four years for which there is data available (starting in 2018).
Breastfeeding has health benefits for babies and their mothers. In the last decade breastfeeding rates at birth have been increasing. The latest annual data in 2021 showed the percentage of babies breastfed at birth was around 64%. This was 3.0 percentage points higher than in 2016. Babies of older mothers are more likely to be breastfed than those of younger mothers.

Maternal health
In 2021, the data shows mixed results for healthy lifestyle behaviours of pregnant women at initial assessment, with a lower percentage of women self-reporting as smokers, but a higher percentage recorded as obese than in the previous year.
In 2021, 15% of pregnant women were recorded as smokers at their initial assessment. This accelerates the downward trend since data was first collected in 2016 and is two percentage points lower than in the previous year. However, the large decrease in 2021 may be affected by nearly all data being self-reported, rather than being carbon monoxide monitored.
A greater proportion of younger women were smokers at initial assessment than older women. A third (33%) of women aged 16 to 19 were recorded as smokers at initial assessment compared to one in ten (10%) women aged 30 or over. Smoking rates at initial assessment have fallen over the last five years for all age groups, (other than those aged under 16, which is subject to year-to-year volatility due to the low number of women in this group).
Three out of ten (30%) pregnant women had a body mass index (BMI) of 30 or greater at their initial assessment. The longer-term upward trend continued as the percentage in 2021 was one percentage point higher than in the previous year and three percentage points higher than in 2016 (the first year of comparable data).
Nearly three out of ten (29%) pregnant women reported a mental health condition at their initial assessment. The longer-term upward trend continued, with the latest data two percentage points higher than in the previous year, and ten percentage points higher than in 2016 (the first year of comparable data).
The number of live births increased marginally; the first year that the number has not fallen since 2010. The percentage of new-borns from each ethnic background has remained broadly unchanged since 2018.
The percentage of young mothers continues to fall. Most mothers giving birth in the year were aged between 25 and 34, while there were more mothers aged 40 or older than 19 or younger for the first time on record.
Healthy lifestyle behaviours
The National Survey for Wales has been adapted due to the pandemic, with a change in the mode of the survey (telephone interviews replacing face-to-face interviews) and changes to some questions compared with previous years. Some results from prior to the pandemic are provided to add context to this more recent data. However, as these topics can be sensitive to such changes it is not possible to compare the results directly with data from years prior to 2020-21.
The data presented here is for April 2021 to March 2022.
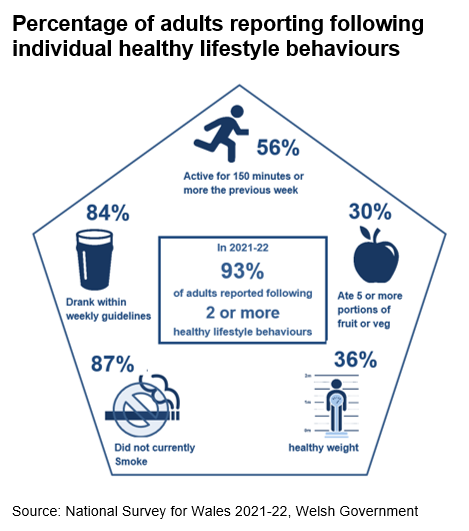
The majority (93%) of adults reported following two or more of the five healthy lifestyle behaviours. This includes:
- not currently smoking
- drinking within weekly guidelines
- eating five or more portions of fruit or vegetables
- being active for 150 minutes or more the previous week
- being a healthy weight
30% of adults followed four or five of the healthy lifestyle behaviours.
In 2021-22, the percentage of adults with two or more healthy lifestyle behaviours was lower for males (compared with females), people aged between 45 to 65 (compared to those from younger or older age groups) and people from a less deprived area (compared with those from a more deprived area).
The national milestone on children’s healthy lifestyle behaviours is to increase the percentage of children with two or more healthy behaviours to 94% by 2035 and more than 99% by 2050.
The School Health Research Network Student Health and Wellbeing survey showed the percentage of 11 to 16 year olds meeting the national milestone remained at 88% in 2019 and has remained stable since data collection started in the 2013/14 academic year.
These healthy lifestyle behaviours include not smoking, never/rarely drinking alcohol, eating fruit or vegetables every day and being physically active for an hour or more, seven days per week. For these underlying behaviours for 11 to 16 year olds in 2019:
- 94% reported that they did not smoke
- 81% reported that they never or rarely drunk alcohol
- 48% reported that they eat fruit or vegetables every day
- 18% reported that they had been physically active for an hour or more, seven days per week
In 2019, the percentage of children with two or more healthy lifestyle behaviours declined with age in secondary school and to a lesser degree lower family affluence. However, there were no large differences between girls and boys.
Reported physical activity levels declined with age in secondary school, and boys (rather than girls) and those from a high family affluence background (rather than low family affluence) were more likely to report being physically active for an hour or more every day.
The percentage of children who reported that they eat fruit or vegetables every day also declined with age in secondary school, with girls (rather than boys) and those from a high family affluence background (rather than low family affluence) more likely to report that they eat fruit or vegetables every day.
The percentage of children who reported that they did not smoke declined with age during secondary school. Girls (compared with boys) and those from a high family affluence background (compared with low family affluence) were more likely to report they did not smoke.
The percentage of children who reported that they never or rarely drank alcohol fell with age during secondary school. There was little difference between boys and girls. However, those from a low family affluence background were more likely to report that they never or rarely drank alcohol (compared with high family affluence).

Mental health and wellbeing in adults
Due to the pandemic, the National Survey has taken place over the phone instead of face-to-face. As a result, the national indicator on mental wellbeing (as measured by the Warwick Edinburgh Mental Well-Being Scale for adults (WEMWBS)) hasn’t been updated as normal.
However, from July 2021 to January 2022, a follow-up online survey was trialled, where a sample of approximately 2,000 respondents completed an additional set of questions after completing the telephone survey.
Results for the period covering part of the pandemic are shown below along with some results from previous years to provide context. However, due to the difference in mode and possible real change due to the pandemic, care should be taken when making direct comparisons.
People were asked about their mental wellbeing and results were scored using WEMWBS. A higher score (58 to 70) suggests high mental wellbeing, while scoring 44 or lower suggests having a low mental wellbeing. Scoring between 45 and 57 suggests the person has medium mental wellbeing.
The overall WEMWBS score from July 2021 to January 2022 was 49. This is lower than in 2018-19, when the average score was 51. 30% of people were found to have low wellbeing, 54% to have medium wellbeing, and 16% to have high wellbeing.
On average younger people have lower wellbeing, with those aged 25 to 44 having a score of 47, compared with a score of 52 for those aged over 75.
People who describe their general health as bad or very bad score 39, a lower score than for people with better general health.
People who say they are lonely also have lower mental wellbeing on average (39) than those who are sometimes lonely (53) or never lonely (49).
These interactions with age and health show the same trend as in 2018-19, but with lower average scores in all categories corresponding to lower wellbeing. This decrease may be explained by the effects of the pandemic but the change in mode should also be considered when comparing the results.
Average life satisfaction had been increasing since 2011-12, with slight reductions in average anxiety levels. However, the year prior to the pandemic saw a slight deterioration in levels of both life satisfaction and anxiety. This trend continued in the most recent data which covers most of the first year of the pandemic, with life satisfaction and anxiety levels deteriorating to levels worse than those seen in 2011-12.
Mental health and wellbeing in children
National indicator data for children aged 10 to 15, collected prior to the pandemic (2019/20 academic year), shows there has been little change in the mean strength and difficulties questionnaire score since the 2013/14 academic year.
However, as for adults, more recent School Health Research Network Student Health and Wellbeing survey data collected in September – December 2021 indicates a fall in mental wellbeing for 11 to 16 year olds (as measured by the Short Warwick-Edinburgh Mental Wellbeing Scale (SWEMWBS)), compared to prior to the pandemic.
The average SWEMWBS score for 11 to 16 year olds was marginally lower in 2021 (23.0), compared to 2019 (23.7). While seemingly only a small reduction, given the large sample, this is a statistically significant decline in mental wellbeing.
Breakdowns by gender and year group showed those self-identifying as neither a boy nor a girl reported the lowest mental wellbeing, and girls reported lower mental wellbeing than boys. Mental wellbeing scores declined with age.
Trends by ethnicity highlight a smaller relative decline in mental wellbeing between 2019 and 2021 among Black, Asian and Minority Ethnic students compared to White students.
Breakdown by family affluence showed declines of similar magnitude between 2019 and 2021 among students of lower and higher family affluence, suggesting pre-existing socio-economic inequalities in mental wellbeing had not widened over this period.

Hazardous housing
A range of factors are important to everyone's health. For example employment, air pollution and housing all impact on overall health outcomes.
Housing conditions in Wales have improved over the last 10 years, reducing the potential risk to the health of occupants. Social housing dwellings that are compliant with the Welsh Housing Quality Standard continues to increase, with 99% of dwellings compliant (including acceptable fails).
The most recent Welsh Housing Conditions Survey showed that 82% of dwellings were free from the most serious (category 1) hazards in 2017-18, compared with 71% in 2008. There were improvements in all tenures.
Further reading
Previous Well-being of Wales reports, have included further analysis of problematic social media use.
This report covers a wide range of subjects, and therefore in this report it is only possible to consider high level measures of progress. More in depth analysis of many of these topics are available through the range of statistical releases published by Welsh Government, the Office for National Statistics or other statistical producers.
Data sources
Annual personal well-being estimate (Office for National Statistics)
Avoidable mortality in Great Britain (Office for National Statistics)
Deaths due to COVID-19, registered in England and Wales (Office for National Statistics)
Deaths registered in England and Wales (Office for National Statistics)
Deaths related to drug poisoning in England and Wales (Office for National Statistics)
Health expectancies in Wales with inequality gap (Public Health Wales)
Life expectancy for local areas of the UK (Office for National Statistics)
Life expectancy and mortality in Wales (Public Health Wales)
Maternity and birth statistics, 2021
Monthly mortality analysis, England and Wales (Office for National Statistics)
National Survey for Wales online trial
Quarterly alcohol-specific deaths in England and Wales (Office for National Statistics)
Socioeconomic inequalities in avoidable mortality in Wales (Office for National Statistics)
Student Health and Wellbeing Survey (School Health Research Network)
Suicides in England and Wales (Office for National Statistics)
Welsh Housing Conditions Survey (assessment of elements of the Welsh Housing Quality Standard)
Youth mental health and wellbeing in Wales (School Health Research Network)