WIMD is designed to identify the small areas of Wales that are the most deprived.

First published: 27 November 2025
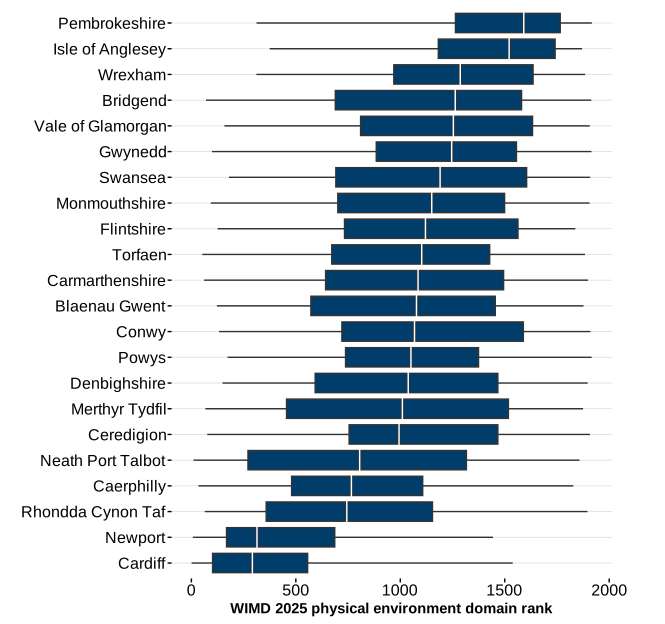
Last updated: 9 December 2025

Introduction

Introduction

About WIMD

The Welsh Index of Multiple Deprivation (WIMD) is the official measure of relative deprivation for small areas in Wales. It identifies areas with the highest concentrations of several different types of deprivation. WIMD ranks all small areas from 1 (most deprived) to 1,917 (least deprived). It is an accredited official statistic produced by statisticians at the Welsh Government.

WIMD is used by Welsh Government and other government bodies, local government and Public Service Boards, academics and students, as well as the third sector and private sector. The purpose of the index is to provide evidence about the most deprived areas of Wales to inform a variety of decisions and research, including funding or targeting of programmes and services for local areas. 

This release updates WIMD 2019, but some changes (explained below) mean WIMD 2025 outputs are not directly comparable to previous indices.

We are grateful for the contributions of many people and organisations who have provided data and advice for WIMD 2025.

What WIMD measures

Being deprived does not just mean being poor, it can also mean having fewer resources and opportunities than we might expect in our society, for example in terms of health, education or access to services. WIMD is made up of 8 separate domains (or types) of deprivation, each compiled from a range of different indicators. The index adds up deprivation scores from the different domains, but some domains are given more weight than others meaning they contribute more to the overall index. 

The domains and their WIMD 2025 weights 

  • Income, 22%.
  • Employment, 20%.
  • Health, 15%.
  • Education, 14%.
  • Access to services, 10%.
  • Housing, 9%.
  • Community safety, 5%.
  • Physical environment, 5%.

How WIMD is constructed

There are 3 main components of the index: 

  • the 54 underlying indicator datasets
  • ranks for the 8 separate domains (or types) of deprivation, created by combining relevant indicators within each domain
  • overall WIMD ranks, created by combining the domain ranks 

All these components are calculated for each of the Lower layer Super Output Areas (LSOAs) in Wales. The boundaries of LSOAs are produced by the Office of National Statistics (ONS) following each census and are a standard statistical geography used for reporting small area statistics. A full list of the indicators can be found in the final background chapter. 

The way the indicators and domains are combined is designed to reliably distinguish between areas at the most deprived end of the distribution, but not at the least deprived end. This means that differences between the least deprived areas are less well defined than differences between the more deprived areas.

There is no definitive threshold above which an area is described as ‘deprived’. WIMD ranks are often grouped into deciles, quintiles or other groups for analysis purposes. Deciles split a set of data into 10 equal parts, and quintiles into 5. The first decile is the lowest 10% of values, the second decile is the next 10%, and so on. Deprivation groups used within this report are designed to have smaller groups at the more deprived end of the distribution, where the difference between areas is greater than at the less deprived end. 

Changes for WIMD 2025

The methodology is broadly the same as for previous indices, with the same 8 domains or types of deprivation captured. However some new datasets, methodologies and geographies have been used to produce WIMD 2025, meaning outputs are not directly comparable to previous indices.

New indicators

  • Housing: inability to afford to enter owner occupation or the private rental market.
  • Housing: dwellings with poor energy performance.
  • Access to services: travel times to childcare services.
  • Physical environment: noise pollution.

Main changes to existing indicators

  • Income: indicator reviewed due to rollout of Universal Credit (UC).
  • Employment: as above, and now includes those not working due to caring responsibilities.
  • Education: absenteeism split into primary and secondary stages, small change to qualifications indicator.
  • Access to services: new approach to calculating average travel times and some changes to location data sources.
  • Physical environment: new data source for ambient green space, and some changes to what’s included as a green space in the proximity measure.
  • Community safety: police recorded violent crime split into sub-indicators with some changes to offence codes, and most crime rate denominators now include non-resident daytime population.

Indicators no longer included

These two indicators have been removed from the index for WIMD 2025 as updated datasets are not available, these are: 

  • education domain, Foundation Phase average point score
  • education domain, Key Stage 2 average point score

Changes to domain weighting

The addition of 2 new indicators in the housing domain has led to a small increase in its weight from 7% to 9%. To allow for this, the weight for the employment domain has been reduced slightly from 22% to 20%.

Changes to geographies

The ONS reviewed LSOA boundaries after the release of Census 2021 data, and there are now 1,917 LSOAs instead of the previous 1,909 for WIMD 2019. 

Uses of WIMD

What WIMD can be used for

  • Identifying the most deprived small areas.
  • Comparing relative deprivation of small areas.
  • Exploring the 8 types of deprivation for small areas.
  • Comparing the proportion of small areas within a larger area that are very deprived.
  • Using some indicator data (but not ranks) to compare absolute change over time.

WIMD can also be used to look at the change in relative deprivation ranks between iterations, for example which areas have left, joined or remained in the most deprived group. However, care should be taken in interpreting changes in rank due to changes in the way the index is calculated between different publications. 

For WIMD 2025, to produce the best possible snapshot of relative deprivation using the latest available data, we have changed some of the indicators and domain weights. These improvements to the measurement of deprivation may have contributed to an area becoming more (or less) deprived relative to others, as well as underlying shifts in deprivation since WIMD 2019.

What WIMD can’t be used for

  • Quantifying how deprived a small area is, or how much more than another (the difference between two ranks can be tiny or large).
  • Using ranks to infer absolute change over time (as they are relative measures).
  • Identifying deprived people (not everyone who is deprived lives in a deprived area).
  • Comparing with other UK countries (each country measures deprivation slightly differently).
  • Measuring affluence (lack of deprivation is not the same as being affluent).

Further details

The guidance report contains more information about what WIMD measures, interpreting the results, and the uses and limitations of WIMD. The technical report contains more information about the methodology and construction of the index, including each of the indicators within each domain. There is more information available on what we are publishing and when.

WIMD is typically updated every 5 years, but the dates of publication for future indices have not yet been scheduled. 

Overall index

Introduction

The introduction provides important information about WIMD and an explanation of terms used in the results chapters. Full details on the indicators, domains and construction of the index is available in the WIMD 2025 technical report.

Main points

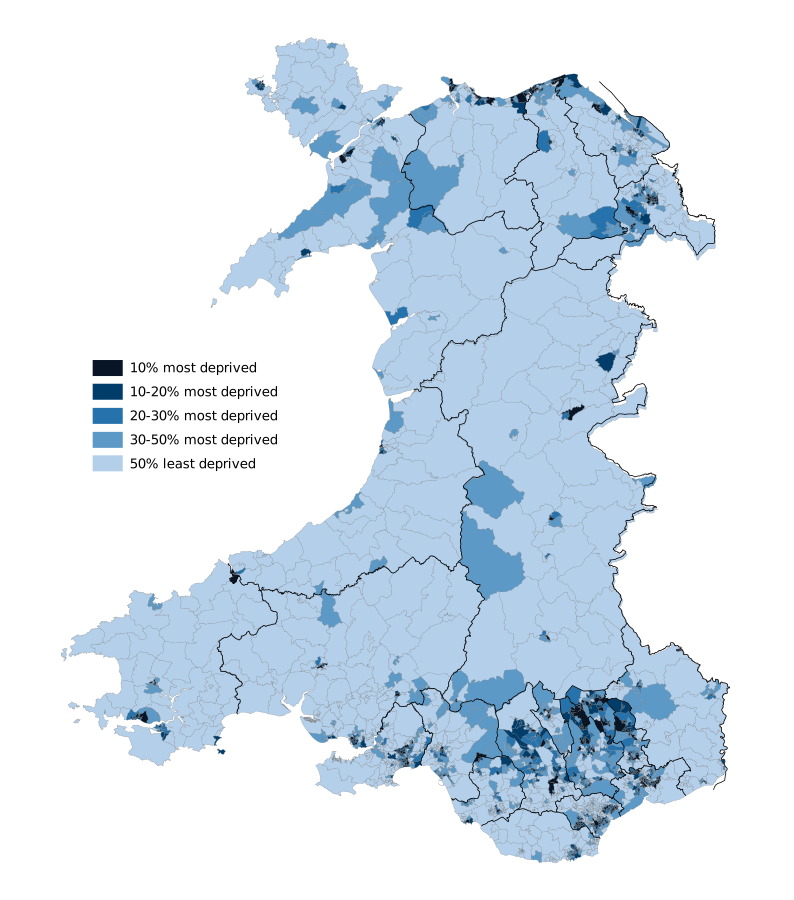
Figure 1.1: map of LSOAs shaded by deprivation group, WIMD 2025

Image

© Crown copyright 2025. Cartographics. Welsh Government.

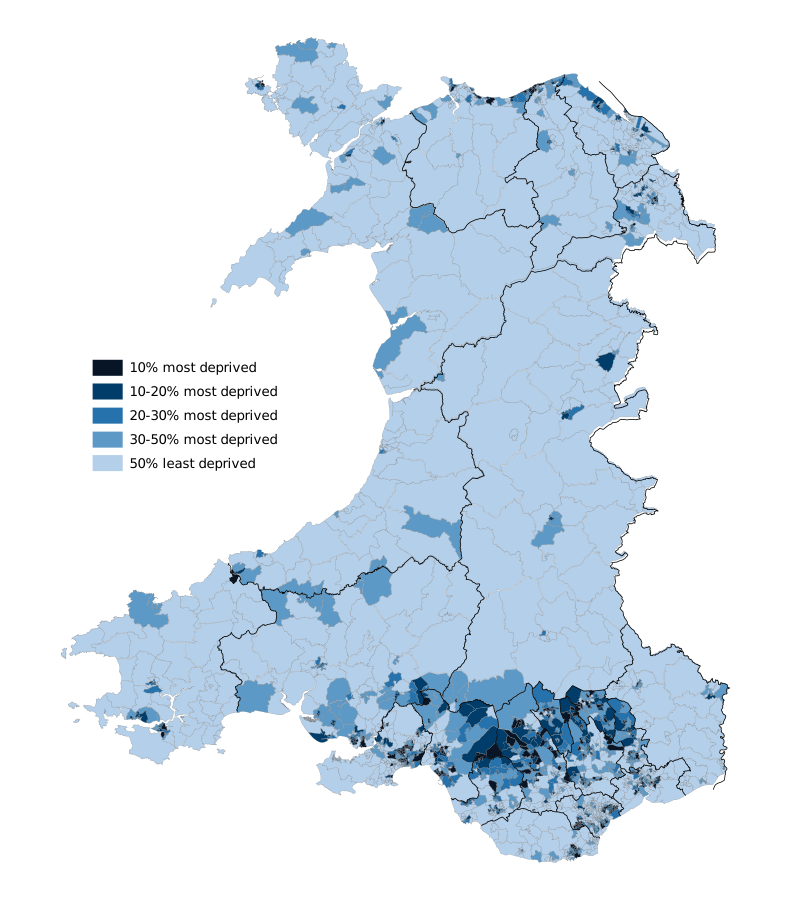
Description of figure 1.1: the map shows that in WIMD 2025 there were pockets of high relative deprivation in the South Wales cities and valleys, various coastal towns, and some towns in North East Wales. 

  • The overall picture is similar to that of WIMD 2019.
  • Five of the 10 most deprived areas from WIMD 2019 remained in the 10 most deprived areas in WIMD 2025.
  • The most deprived small area in Wales in WIMD 2025 was Rhyl West 2 (the area around Rhyl High Street) in Denbighshire, the same as in WIMD 2019.
  • Deprivation is dispersed across Wales: all but one of the 22 local authorities contain at least one of the most deprived 10% of areas in Wales.
  • The local authority with the highest proportion of small areas in the most deprived 10% in Wales was Blaenau Gwent (20% or 9 areas) followed by Newport (18% or 18 areas).
  • Monmouthshire was the only local authority with no areas in the most deprived 10%, Powys and Ceredigion each had one area in the most deprived 10%.
  • Analysis of deep-rooted deprivation looks at areas that have remained in the top 50 most deprived for all WIMD iterations in the past 20 years: there are 22 small areas in deep-rooted deprivation, spread across 10 local authorities.

The full set of domain ranks from WIMD 2025 and the underlying indicators can be downloaded from our StatsWales web pages.

Comparison between WIMD 2019 and WIMD 2025

The introduction summarises changes for 2025. For detailed information on how the index and each domain has changed since 2019 see the technical report.

Table 1.1: movement between deprivation group between WIMD 2019 and 2025
WIMD 
deprivation 
group
10% 
most 
deprived 
2025
10% to 20% most 
deprived 
2025
20% to 30% most 
deprived 
2025
30% to 50% most 
deprived 
2025
50% 
least 
deprived 
2025
10% 
most 
deprived 
2019
85%14%2%0%0%
10% to 20% 
most 
deprived 
2019
15%65%18%2%0%
20% to 30% 
most 
deprived 
2019
0%19%59%21%1%
30% to 50% 
most 
deprived 
2019
0%1%11%69%19%
50% 
least 
deprived 
2019
0%0%0%8%92%

The table shows the percentage of small areas (LSOAs) in each of the deprivation groups for WIMD 2019 that have stayed or moved group in WIMD 2025. Deprivation groups used within this report are designed to have smaller groups at the more deprived end of the distribution, where the difference between areas is greater than at the less deprived end. 

Due to changes in the total number of LSOAs and the boundaries of some LSOAs this comparison is approximate as explained further in the WIMD 2025 guidance report.

The diagonal (top left to bottom right), shows the percentage of areas which have remained in the same deprivation group. Above the diagonal are percentages of areas which have moved from a more to a less deprived group. Below the diagonal are the percentages of areas which have moved from a less to a more deprived group.

The table shows that:

  • most LSOAs remained in the same deprivation group between 2019 and 2025
  • of the 10% most deprived areas in 2019, 85% remained in that group in 2025
  • of the 50% least deprived areas in 2019, 92% remained in that group in 2025
  • there were 29 areas that moved into the 10% most deprived group in 2025, all of these were in the 10% to 20% most deprived group in 2019

Areas that changed rank the most

No areas moved by more than 2 deprivation groups between 2019 and 2025, and only 14 LSOAs moved 2 deprivation groups.

Relatively less deprived

Focussing on the more deprived groups, three areas moved from the 10% most deprived group in 2019 to the 20% to 30% most deprived group in 2025, becoming less deprived. Two of these were in Rhondda Cynon Taff, and were Pentre 5 (an area around Ystrad Rhondda railway station that has changed boundary) and Tonyrefail West 3 (which includes the Bryngolau area).

The other area was Plasnewydd 7, an area of Cardiff around the Newport Road and City Road junction. This area became relatively less deprived in 5 domains, moving from the 10% most deprived group to the 30% to 50% most deprived group on both employment and income (new student accommodation has led to an increase in the student age population in this area).

Outside the most deprived groups, the two largest changes included one area which moved from the 30% to 50% most deprived group to the 50% least deprived group becoming relatively less deprived. This was Tredegar Park 3 in Newport, an LSOA that has changed boundary since WIMD 2019 when it was grouped with what is now Tredegar Park 4 (now in the 10% to 20% most deprived group).

Relatively more deprived

The other largest change outside the most deprived groups was in Grangetown 12. This area around Grangemoor Park in Cardiff has seen the introduction of temporary accommodation for the homeless in recent years. Its overall rank fell from 1,648 in 2019 to 715 in 2025, moving from the 50% least deprived group to the 30% to 50% most deprived group to become relatively more deprived.

Local authority analysis

Figure 1.2: box plot of WIMD 2025 ranks, by local authority

Image

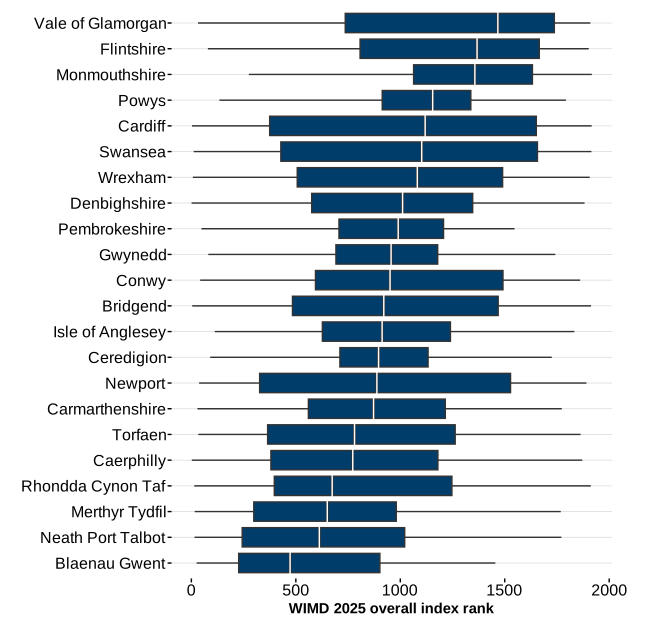
Description of figure 1.2: the chart shows the spread of ranks for each local authority in Wales. The blue boxes contain half the total number of small areas (LSOAs) in each local authority, centred on the median (middle) rank for each local authority and the ‘whiskers’ show the full range of ranks within the local authority. Deprivation increases with decreasing rank (that is, towards the left-hand side of the plot). 

The spread of the overall index ranks is greatest in Cardiff, followed by Swansea and Newport and narrowest in Ceredigion and Powys. Vale of Glamorgan has the highest median rank (less deprived) and Blaenau Gwent has the lowest (more deprived).

Concentrations of deprived areas, by local authority

One way of considering WIMD data at the local authority level is to look at the proportion of areas within the local authority that are in the most deprived 10% (or 20% and so on) of all areas. This method can be seen as identifying the concentration of the most deprived areas in a local authority, rather than an average level of deprivation.

The WIMD 2025 overall index results show that:

  • the local authority with the highest proportion of areas in the most deprived 10% in Wales was Blaenau Gwent (20% or 9 areas) followed by Newport (18% or 18 areas)
  • Monmouthshire had no small areas in the most deprived 10% and Powys and Ceredigion each had only one area
  • Monmouthshire was the local authority with the lowest concentration of areas in the most deprived half of Wales, at 19%, followed by Powys (29%) and Flintshire (29%)
  • Blaenau Gwent (76%), Merthyr Tydfil (72%) and Neath Port Talbot (72%) had the highest percentage of areas in the most deprived 50%

Concentrations of WIMD 2025 deprived areas, by local authority on StatsWales

The most deprived areas in WIMD 2025

The table below lists the 10 most deprived areas in Wales according to WIMD 2025, together with 5 areas that were ranked between 1 and 10 in WIMD 2019, but have moved out of that group in WIMD 2025.

Note that WIMD does not measure the level of deprivation in a small area, but rather whether an area is more or less deprived relative to all other small areas in Wales. It is not possible to determine from a change in rank alone whether deprivation has improved or not in an area.

Table 1.2: Top 10 most deprived areas in WIMD 2025 plus 5 areas that were in the top 10 in 2019
LSOALocal authorityLSOA name [Note 1]WIMD 2019 rankWIMD 2025 rank
W01000240DenbighshireRhyl West 211
W01001421CaerphillySt James 332
W01001741CardiffEly 5143
W01000991BridgendCaerau (Bridgend) 154
W01000237DenbighshireRhyl South West 2195
W01001884CardiffTrowbridge 8136
W01000413WrexhamQueensway 197
W01001738CardiffEly 2288
W01000239DenbighshireRhyl West 129
W01000241DenbighshireRhyl West 31110
W01001274Rhondda Cynon TafTylorstown 1423
W01001209Rhondda Cynon TafPenrhiw-ceiber 1660
W01001308Merthyr TydfilPenydarren 1716
W01001428CaerphillyTwyn Carno 1812
W01001662NewportPillgwenlly 41049

[Note 1]: Links are to 2021 Census area profile for the LSOA (ONS), which includes a map of the area

The table shows that:

  • Rhyl West 2, Denbighshire remains the most deprived small area in Wales
  • half of the 10 most deprived areas in WIMD 2019 remained in the 10 most deprived  areas for WIMD 2025 

The table includes links to 2021 Census profiles for these areas. To explore household and demographic characteristics of any area in more detail enter the LSOA code into the 2021 Census Profile for areas in England and Wales tool on the NOMIS website (ONS).

Deep-rooted deprivation

Small areas of ‘deep-rooted’ deprivation are those that have remained within the top 50 most deprived, roughly equal to the top 2.6% of small areas in Wales for the last 6 publications of WIMD ranks (WIMD 2005, 2008, 2011, 2014, 2019 and 2025). This means that across a period of 20 years, the small areas that fall into this category are considered the most deprived, as they have consistently ranked in the top 50 out of all small areas in Wales. The analysis only looks at ranks as far back as WIMD 2005 as this was the first index when LSOAs became the standard geography. The data underlying this analysis has been published on StatsWales and as an OpenDocument Spreadsheet.

Since WIMD is a measure of relative deprivation, it doesn’t give an indication of the level of deprivation in these small areas. The small areas that fall into the deep-rooted deprivation category may have seen a decrease in levels of deprivation since WIMD 2005 but are still some of the most deprived when compared  to other small areas in Wales.

In total, there are 22 small areas that are in deep-rooted deprivation, representing roughly 1.1% of all small areas in Wales. These are listed in the table below, ordered by their WIMD 2025 overall rank.

Table 1.3: Small areas of deep-rooted deprivation, 2025
LSOA codeLocal AuthorityLSOA NameWIMD 2025 rank
W01000240DenbighshireRhyl West 21
W01001421CaerphillySt James 32
W01000991BridgendCaerau (Bridgend) 14
W01000237DenbighshireRhyl South West 25
W01000413WrexhamQueensway 17
W01000239DenbighshireRhyl West 19
W01000830SwanseaPenderry 111
W01001428CaerphillyTwyn Carno 112
W01000833SwanseaPenderry 413
W01001222Rhondda Cynon TafPen-y-waun 214
W01000921Neath Port TalbotCymer (Neath Port Talbot) 215
W01001308Merthyr TydfilPenydarren 116
W01000863SwanseaTownhill 219
W01000864SwanseaTownhill 320
W01001274Rhondda Cynon TafTylorstown 123
W01001739CardiffEly 324
W01000862SwanseaTownhill 126
W01001339CaerphillyBargoed 427
W01000742SwanseaCastle 130
W01001345CaerphillyBedwas Trethomas and Machen 631
W01000832SwanseaPenderry 336
W01001479Blaenau GwentTredegar Central and West 244

Of the small areas listed, 2 have been ranked within the top 10 most deprived since WIMD 2005 (Rhyl West 2 and Queensway 1). In addition to these 2 small areas, a further 5 (Rhyl West 1, St. James 3, Twyn Carno 1, Penydarren 1, Pen-y-waun 2) make up the 7 small areas that have consistently been ranked within the top 20 most deprived.

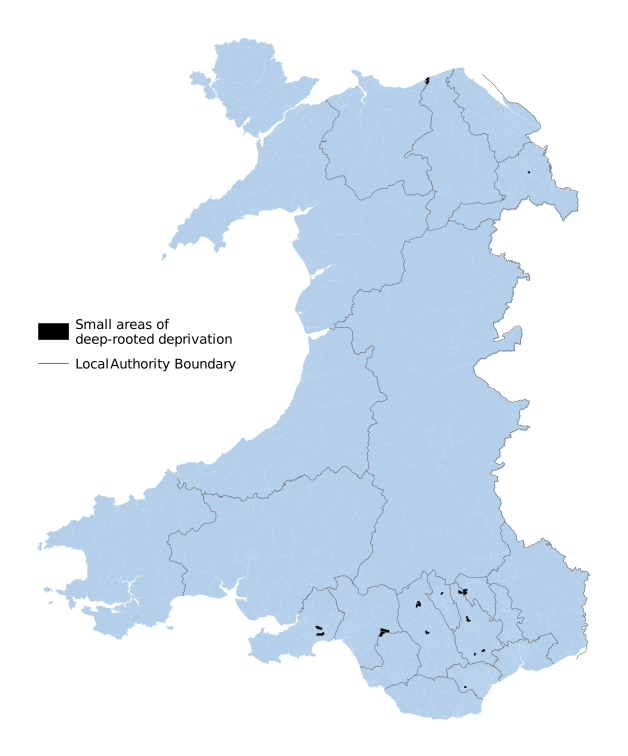
Figure 1.3: map of LSOAs of deep-rooted deprivation across Wales, WIMD 2025

Image

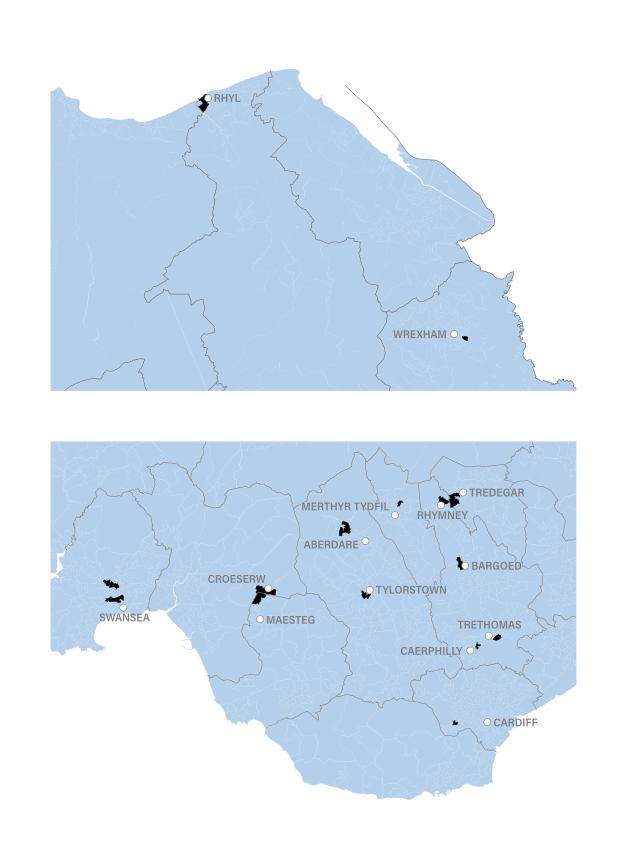
Figure 1.4: map of LSOAs of deep-rooted deprivation, close ups for South and North East Wales, WIMD 2025

Image

© Crown copyright 2025. Cartographics. Welsh Government.

Description of figures 1.3 and 1.4: the maps show that in WIMD 2025 the 22 small areas of deep-rooted deprivation are spread across 10 local authorities; the highest number of which are found in Swansea. 

These 7 small areas located in Swansea account for almost a third (32%) of those consistently ranking within the top 50 most deprived, almost twice as many as the local authority with the next highest number (Caerphilly, with 4 small areas).

All but 2 of the 22 are located within a named built up area (BUA), with the most being found in Swansea (6) followed by Rhyl (3). Other BUAs with one small area of deep-rooted deprivation each are Aberdare, Bargoed, Caerphilly, Cardiff, Croeserw, Maesteg, Merthyr Tydfil, Rhymney, Tredegar, Trethomas and Wrexham. The areas in deep-rooted deprivation but not in a BUA are Penderry 3 in Swansea and Tylorstown 1 in Rhondda Cynon Taf. 

There are 12 local authorities with no small areas of deep-rooted deprivation (Isle of Anglesey, Gwynedd, Conwy, Flintshire, Powys, Ceredigion, Pembrokeshire, Carmarthenshire, Vale of Glamorgan, Torfaen, Newport, and Monmouthshire). This does not mean that there aren’t currently any very deprived areas in these local authorities.

Areas that have recently left the 50 most deprived group

There are 6 areas that were in the 50 most deprived areas in 3 or 4 of the earlier iterations of the index but were not in the top 50 most deprived areas for 2019 or 2025. However they all remain in the 10% most deprived group for WIMD 2025:

  • Cyfarthfa 2 (Merthyr Tydfil) ranked 69 in WIMD 2025
  • Gurnos 1 (Merthyr Tydfil) ranked 87 in WIMD 2025
  • Gurnos 2 (Merthyr Tydfil) ranked 89 in WIMD 2025
  • Butetown 1 (Cardiff) ranked 136 in WIMD 2025
  • Hengoed 2 (Ystrad Mynach, Caerphilly) ranked 158 in WIMD 2025
  • Pillgwenlly 3 (Newport) ranked 174 in WIMD 2025

Related sources

Indices of multiple deprivation across the UK

England, Scotland and Northern Ireland all produce their own indices of multiple deprivation:

These datasets are based on the same concept and general methodology, however there are differences (described in the guidance report) meaning the indices are not directly comparable. The ONS previously published information explaining in more detail the similarities and differences between the 4 Indices (ONS).

We continue to work with MHCLG and devolved governments to explore opportunities to produce harmonised outputs. This includes sourcing data which will enable the publication of UK-wide products. Release plans are yet to be confirmed but will be announced on GOV.UK in due course.

Other local data for Wales

ONS have published data and information relating to the 2021 Census (ONS) as well as local statistics (ONS). Statistics specifically for Wales can be found in National Survey for Wales bulletins, and in the National Survey for Wales results viewer.

Trajectories of deprivation

Academics continue to use census and indices of deprivation data to research and evidence deprivation trajectories, or ‘deprivation histories’ for small areas in the UK, investigating case studies of local authority districts. For example see the published article 50-year Deprivation Trajectories: Local Area Change in England and Wales, 1971–2021 (Norman, P., Lloyd, C.D., McLennan D., Ferguson, S. and Catney, G., 2024). The upcoming article ‘Trajectories of deprivation in the UK’ (Lloyd, C. D., Ferguson, S., Catney, G., McLennan, D. and Norman, P., Nuffield Foundation 2025) will include analysis of Welsh data up to the 2021 Census and WIMD 2019.

Income domain results

Introduction

The purpose of this domain is to measure the proportion of people experiencing deprivation relating to low income. The domain has a relative weight of 22% in the overall index.

Indicators

Figure 2.1: income domain indicator, WIMD 2025

Image

Description of figure 2.1: diagram showing which benefits are used to derive the income domain. The domain has one indicator made up of several components, giving a snapshot of people in receipt of income-related benefits and tax credits and supported asylum seekers.

It uses non-overlapping counts of means-tested claimants, and applies an income threshold to working households. The summed counts are then expressed as a percentage of the estimated total population for the Lower layer Super Output Area (LSOA).

The domain numerator captures the following categories of claimant, their partners and dependent children, as of end March 2024:

  • ‘Legacy’ out-of-work means-tested benefits:
    • income support
    • income-based Jobseeker’s Allowance
    • income-related Employment and Support Allowance
  • Pension Credit (Guarantee)
  • Universal Credit (UC) ‘out of work’ conditionality groups, including:
    • no work requirements
    • planning for work
    • preparing for work
    • searching for work
  • UC ‘in work’ conditionality groups (with income after housing costs below a 70% median threshold) including:
    • working with requirements
    • working, no requirements
  • Housing Benefit, with income after housing costs below a 70% median threshold
  • Tax Credit, with income after housing costs below a 70% median threshold
  • Asylum seekers in dispersed accommodation in receipt of support

Full details on the indicator and construction of the domain is available in the WIMD 2025 technical report.

Main points

Figure 2.2: map of LSOAs shaded by income deprivation group, WIMD 2025

Image

© Crown copyright 2025. Cartographics. Welsh Government.

Description of figure 2.2: the map shows that in the WIMD 2025 income domain, there were pockets of high income deprivation in the South Wales valleys and large cities, and in some North Wales coastal towns. 

  • All local authorities except Monmouthshire had at least some areas with over 46% of people in income deprivation, equivalent to being in the most deprived 10% of areas.
  • The local authorities with the highest proportion of areas in the most deprived 10% were Blaenau Gwent (at 22%) followed by Cardiff and Newport (both at 18%).
  • The overall patterns of income deprivation in WIMD 2025 are broadly like those for WIMD 2019.
  • For the income domain, the most deprived area in Wales was Rhyl West 2, Denbighshire (around Rhyl High Street), the same as for WIMD 2019 and WIMD 2014.
  • Six of the 10 most deprived areas in WIMD 2025 were also in the 10 most deprived areas in WIMD 2019.
  • Over a fifth or 22% of people who are income deprived live in the most deprived 10% of small areas for the income domain (the areas ranked 1 to 191).
  • Half of those who are income deprived live in the most deprived 29% of areas for the income domain.
  • Across Wales, 25% of people are in income deprivation.
  • The percentage of people who are income deprived within the most deprived 10% of areas varies a lot, from 88% in Rhyl West 2, to 46% for Neath South 1, the area ranked 191. 

The full set of domain ranks from WIMD 2025 and the underlying indicators can be downloaded from our StatsWales web pages.

More information on the distribution of the income deprived population in WIMD 2025 can be found in the WIMD 2025 guidance report.

Comparison between WIMD 2019 and WIMD 2025

The introduction of Universal Credit (UC) has significantly influenced how income deprivation is measured in WIMD. This has led to the adoption of new indicators developed by the Ministry of Housing, Communities and Local Government (MHCLG) and the Department for Work and Pensions (DWP) that reflect policy and data changes. This updated method includes a 70% of median income after housing costs threshold. The income deprivation indicator is therefore not directly comparable with that for WIMD 2019. For full information on how the domain has changed since 2019 see the WIMD 2025 technical report, and the English indices of deprivation technical report (MHCLG).

Table 2.1: Movement between income deprivation group between WIMD 2019 and 2025
WIMD 
deprivation 
group
10% 
most 
deprived 
2025
10% to 20% most 
deprived 
2025
20% to 30% most 
deprived 
2025
30% to 50% most 
deprived 
2025
50% 
least 
deprived 
2025
10% 
most 
deprived 
2019
82%16%2%1%0%
10% to 20% 
most 
deprived 
2019
17%60%20%3%0%
20% to 30% 
most 
deprived 
2019
1%21%51%26%2%
30% to 50% 
most 
deprived 
2019
0%1%13%65%20%
50% 
least 
deprived 
2019
0%0%0%8%92%

The table shows the percentage of small areas (LSOAs) in each of the deprivation groups for WIMD 2019 that have stayed or moved group in WIMD 2025. 

For an explanation of how we have treated the minority of areas that changed boundary, and the ranks counted in each category for WIMD 2019 and WIMD 2025, please see the guidance report.

The diagonal (top left to bottom right), shows the percentage of areas which have remained in the same deprivation group. Above the diagonal are percentages of areas which have moved from a more to a less deprived group. Below the diagonal are the percentages of areas which have moved from a less to a more deprived group.

The table shows that:

  • most LSOAs remained in the same deprivation group between 2019 and 2025
  • of the small areas ranked in the 10% most deprived in 2019, 82% remained in that group in 2025
  • of the small areas ranked in the 50% least deprived in 2019, 92% remained in that group in 2025 

Only 3 LSOAs moved by more than 2 deprivation groups. Below we focus on the 2 that have moved in or out of the 10% most deprived.

More deprived

One area has moved from the 30% to 50% most deprived group in WIMD 2019 to the 10% most deprived group in WIMD 2025 (Tredegar Park 4 in Newport). This LSOA has changed boundary since WIMD 2019, when it was grouped with what is now Tredegar Park 3 (in the least deprived half for income deprivation)

Less deprived

One area has moved from the 10% most deprived group in WIMD 2019 to the 30% to 50% most deprived group in WIMD 2025. This was Plasnewydd 7 in Cardiff, an area close to the city centre including the junction of City Road and Newport Road.

Local authority analysis

Figure 2.3: box plot of WIMD 2025 income domain ranks, by local authority

Image

Description of figure 2.3: the chart shows the spread of income domain ranks for each local authority in Wales. The blue boxes contain half the total number of small areas (LSOAs) in each local authority, centred on the median (middle) rank for each local authority and the ‘whiskers’ show the full range of ranks within the local authority. Deprivation increases with decreasing rank (that is, towards the left-hand side of the plot). 

The spread of income domain ranks is greatest in Swansea and Cardiff, and narrowest in Isle of Anglesey and Powys. Monmouthshire has the highest median rank (less deprived) and Blaenau Gwent has the lowest (more deprived).

Concentrations of income deprived areas, by local authority

One way of considering WIMD data at the local authority level is to look at the proportion of areas within the local authority that are in the most deprived 10% (or 20% etc) of all areas. This method can be seen as identifying the concentration of the most deprived areas in a local authority, rather than an average level of deprivation.

The WIMD 2025 income domain results show that:

  • the local authority with the highest proportion of areas in the most deprived 10% in Wales was Blaenau Gwent (22% or 10 areas) followed by Cardiff and Newport (both 18%)
  • Monmouthshire had no small areas in the most deprived 10%, followed by Powys and Ceredigion with only one each of their areas
  • Monmouthshire and Powys were also the local authorities with the lowest concentrations of areas in the most deprived half of Wales, at 26% and 28% respectively
  • Blaenau Gwent and Merthyr Tydfil had the highest percentage of areas in the most deprived 50%, at 74% and 72% respectively

Concentrations of WIMD 2025 income deprived areas, by local authority on StatsWales.

Other relevant sources

Income deprivation for children and older people

Two additional indicators were created for WIMD 2025, which are subsets of the income deprivation indicator. These are income deprivation for children (aged 0 to 15) and income deprivation for older people (aged 60 or over). Both are published on StatsWales.

Data for England and Wales

We will continue to work with the Ministry of Housing, Communities and Local Government (MHCLG) and other devolved governments to explore opportunities to produce harmonised outputs. Release plans will be announced on GOV.UK in due course.

Benefit statistics

The Department for Work and Pension’s dissemination tool Stat-Xplore (DWP) allows you to download and customise benefit statistics, including local area data and time series. 

Modelled income estimates

The Office for National Statistics’ small area model-based income estimates (ONS), modelled from survey data, are available down to middle-layer super output area (MSOA) level.

Households below average income data

DWP publish a dataset on households below average income (DWP). Based on that data we publish analysis of poverty in Wales, with various breakdowns. The data cannot be broken down below Wales level due to limitations in sample size. 

Admin-based income statistics

We will continue to review progress in developing the Office for National Statistics (ONS) experimental admin-based income statistics for England and Wales (ABIS) for potential use in future indices. A recent research paper provides information on the strengths and limitations of the current ABIS, and the direction of travel for future development (ONS).

Employee earnings estimates

ONS publishes estimates of employee earnings based on data from the annual survey of hours and earnings (ONS). These are the most robust and comprehensive source of earnings data for the UK; however estimates are not available below local authority level, the data are only a subset of all sources of income, and they do not cover the self-employed.

Employment domain results

Introduction

The purpose of this domain is to measure the proportion of working-age people involuntarily excluded from the labour market. This includes people who may want to work but are unable to do so due to unemployment, sickness or disability, or caring responsibilities. The domain has a relative weight of 20% in the overall index.

Indicators

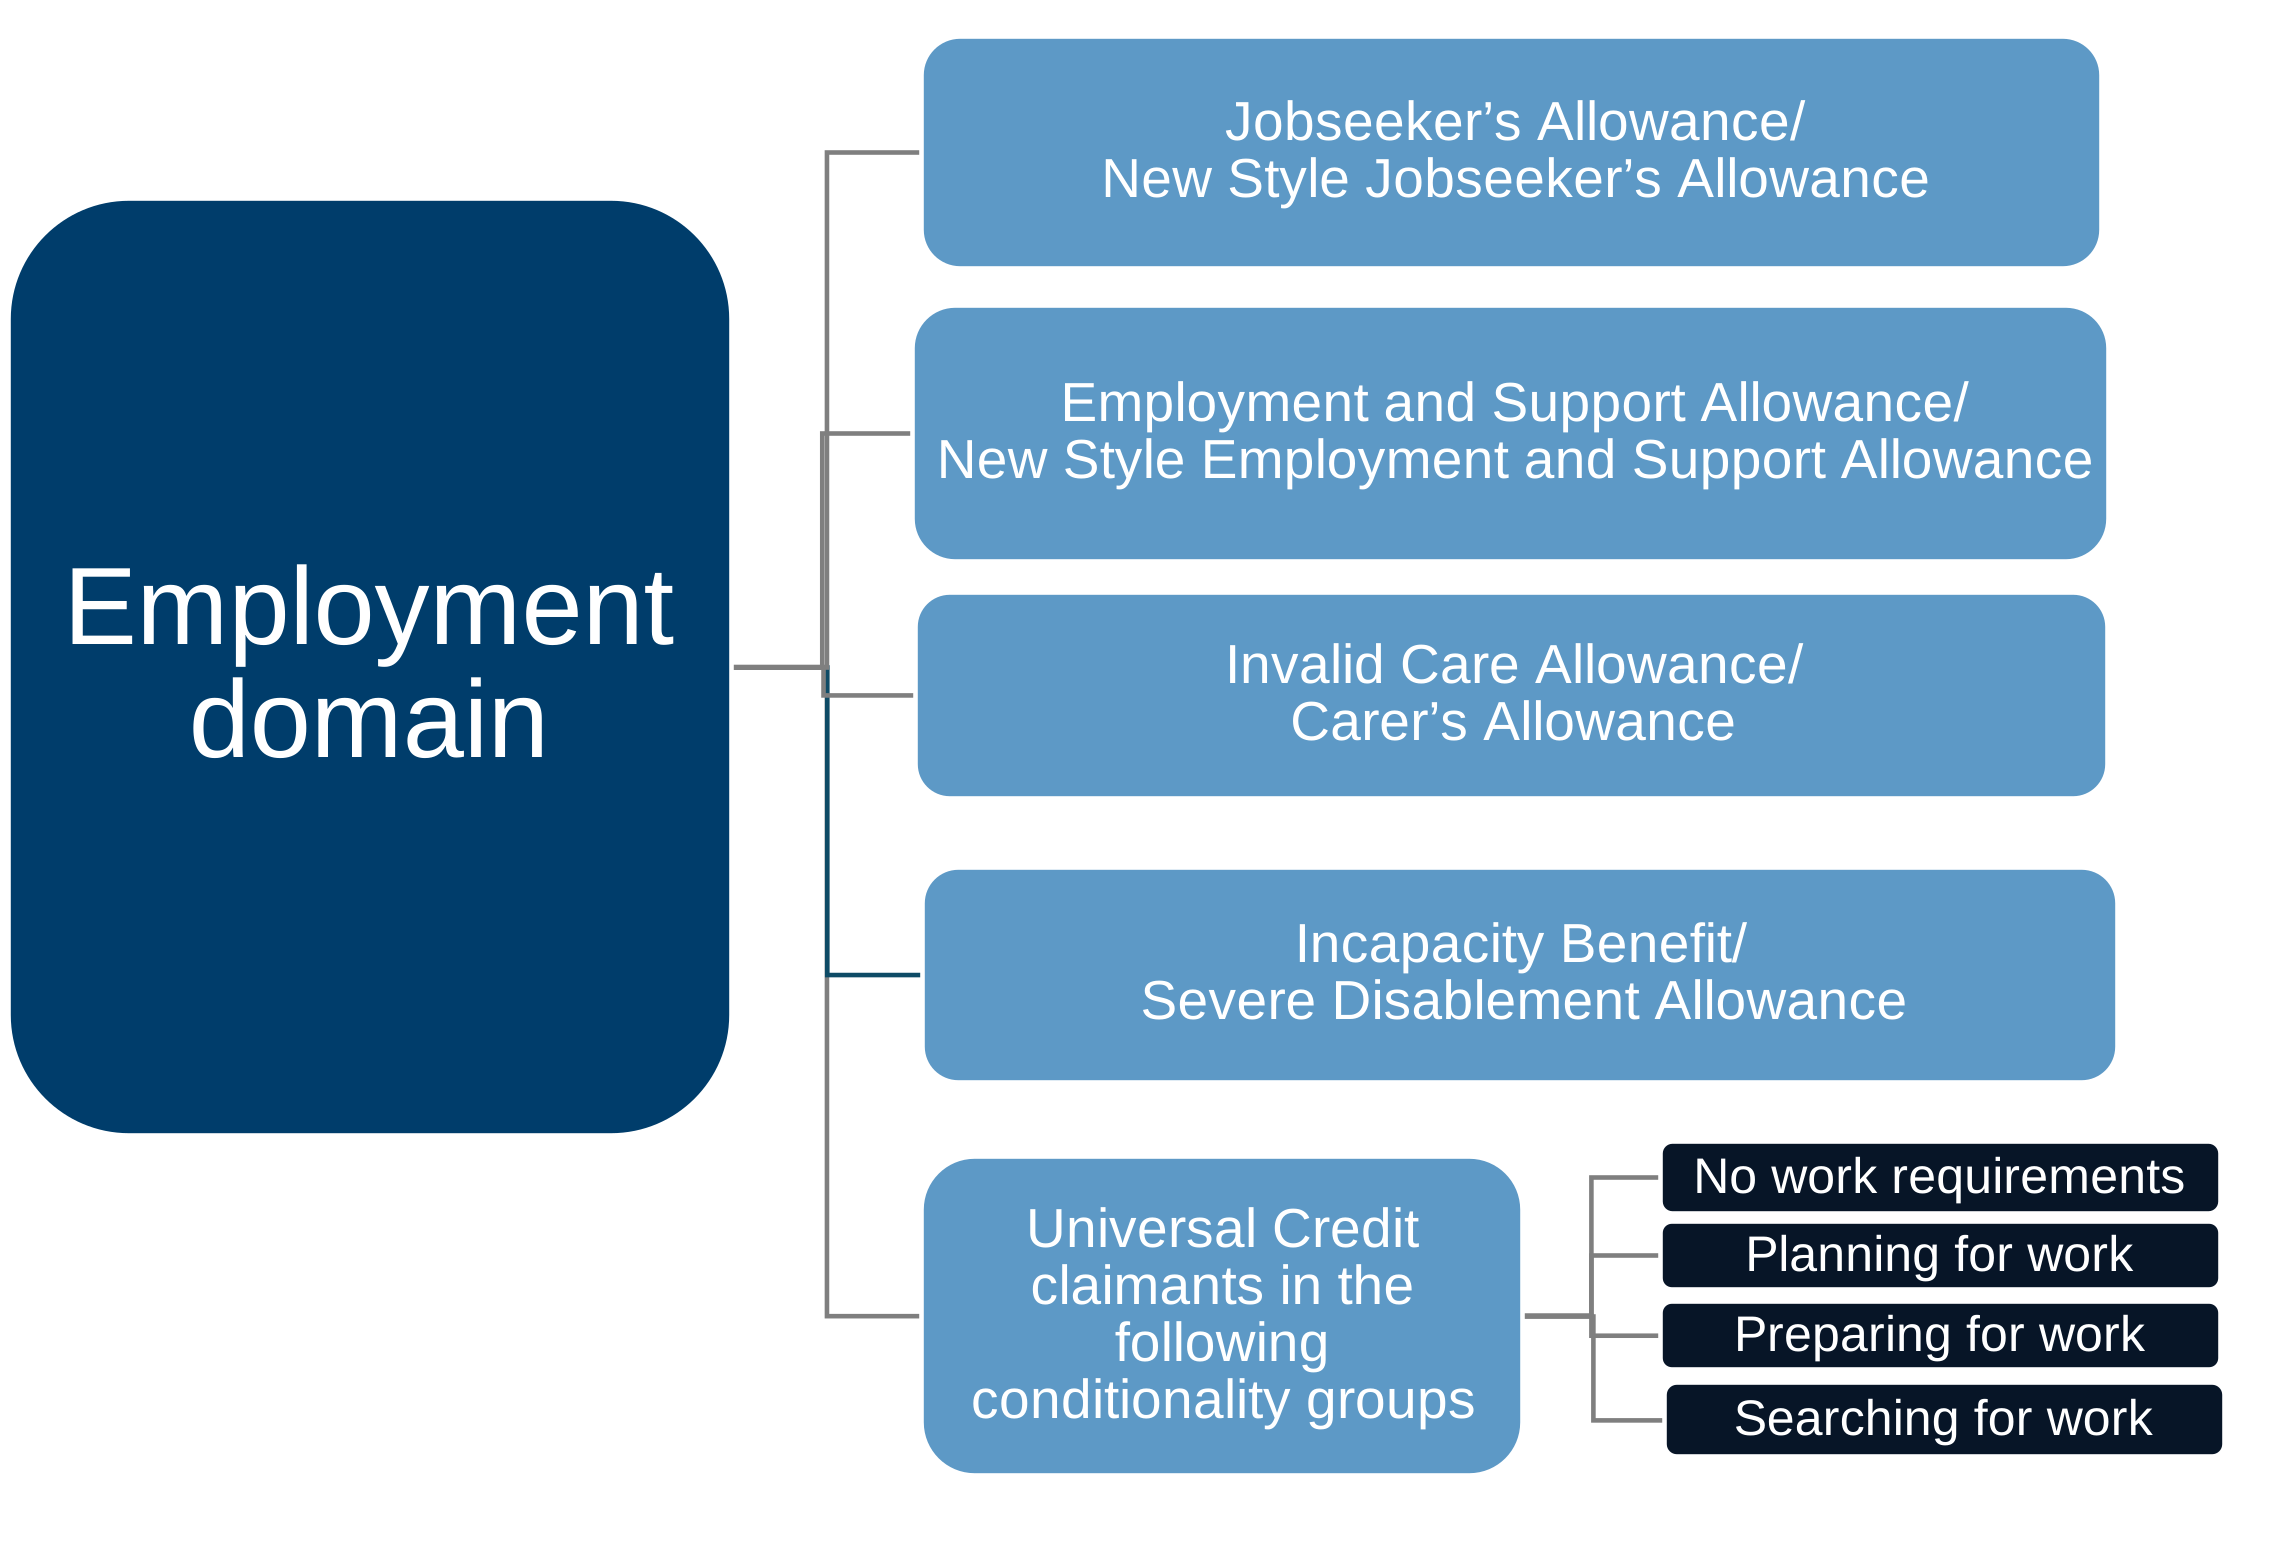
Figure 3.1: employment domain indicator, WIMD 2025

Image

Description of figure 3.1: Diagram showing which benefits are used to derive the employment domain, also described below. 

The domain has one indicator made up of several components, a snapshot of working age people in receipt of unemployment-related benefits. It is expressed as a percentage of the estimated population aged 18 to 66 in an LSOA. The numerator is a count of individuals aged 18 to 66, averaged over 12 separate monthly timepoints from April 2022 to March 2023, who were entitled to:

  • Jobseeker’s Allowance (both contribution-based and income-based)
  • New Style Jobseeker’s Allowance
  • Employment and Support Allowance (both contribution-based and income-based)
  • New Style Employment and Support Allowance
  • Incapacity Benefit
  • Severe Disablement Allowance
  • Carer’s Allowance
  • Income Support
  • Universal Credit (UC) claimants in the following conditionality groups:
    • no work requirements
    • planning for work
    • preparing for work
    • searching for work

Full details on the indicator and construction of the domain is available in the WIMD 2025 technical report.

Main points

Figure 3.2: map of LSOAs shaded by employment deprivation group, WIMD 2025

Image

© Crown copyright 2025. Cartographics. Welsh Government.

Description of figure 3.2: the map shows that in the WIMD 2025 employment domain, there were pockets of high employment deprivation in the South Wales valleys and large cities, and in some North Wales coastal towns. 

  • All local authorities except Monmouthshire had at least one area with over 32% of people in employment deprivation, equivalent to being in the most deprived 10% of areas.
  • The local authorities with the highest proportion of areas in the most deprived 10% were Blaenau Gwent (at 24%) followed by Neath Port Talbot (at 20%).
  • The overall patterns of employment deprivation in WIMD 2025 are broadly like those for WIMD 2019.
  • For the employment domain, the most deprived area in Wales was Rhyl West 2, Denbighshire (around Rhyl High Street), the same as for WIMD 2019 (and WIMD 2014).
  • Six of the 10 most deprived areas in WIMD 2025 were also in the 10 most deprived areas in WIMD 2019.
  • A fifth (20%) of people who are employment deprived live in the most deprived 10% of small areas for the employment domain (the areas ranked 1 to 191).
  • Half of those who are employment deprived live in the most deprived 30% of areas for the employment domain.
  • Across Wales, 17% of people are in employment deprivation.
  • There is a wide range in the percentage of people who were employment deprived within the most deprived 10% of areas, from 64% in Rhyl West 2, to 32% for ‘Bedwas Trethomas and Machen 2’, the area ranked 191. 

The full set of domain ranks from WIMD 2025 and the underlying indicators can be downloaded from our StatsWales web pages.

More information on the distribution of the employment deprived population in WIMD 2025 can be found in the WIMD guidance report.

Comparison between WIMD 2019 and WIMD 2025

The introduction of UC has significantly influenced how employment deprivation is measured in WIMD. This has led to the adoption of new indicators developed by the Ministry of Housing Communities and Local Government (MHCLG) and DWP that reflect policy and data changes. This updated method also includes people who may want to work but are unable to do so due to caring responsibilities, a change since WIMD 2019. The employment deprivation indicator is therefore not directly comparable with that for WIMD 2019. For full information on how the domain has changed since 2019 see the technical report.

Table 3.1: movement between employment deprivation group between WIMD 2019 and 2025
WIMD 
deprivation 
group
10% 
most 
deprived 
2025
10% to 20% most 
deprived 
2025
20% to 30% most 
deprived 
2025
30% to 50% most 
deprived 
2025
50% 
least 
deprived 
2025
10% 
most 
deprived 
2019
78%19%2%1%0%
10% to 20% 
most 
deprived 
2019
19%56%22%3%0%
20% to 30% 
most 
deprived 
2019
3%22%44%30%1%
30% to 50% 
most 
deprived 
2019
0%2%16%63%19%
50% 
least 
deprived 
2019
0%0%0%8%92%

The table shows the percentage of small areas (LSOAs) in each of the deprivation groups for WIMD 2019 that have stayed or moved groups in WIMD 2025. 

For an explanation of how we have treated the minority of areas that changed boundary, and the ranks counted in each category for WIMD 2019 and WIMD 2025, please see the guidance report. 

The diagonal line of data (i.e., from top left to bottom right), shows the percentage of areas which have remained in the same deprivation group. Above the diagonal are percentages of areas which have moved from a more to a less deprived group. Below the diagonal are the percentages of areas which have moved from a less to a more deprived group.

The table shows that:

  • except for the 20% to 30% most deprived grouping, most LSOAs remained in the same deprivation group between 2019 and 2025
  • of the small areas ranked in the 10% most deprived in 2019, 78% remained in that group in 2025
  • of the small areas ranked in the 50% least deprived in 2019, 92% remained in that group in 2025

Only one LSOA moved by more than 2 deprivation groups (see second bullet point below). Below we focus on a few that have moved the most in the most deprived groups.

Relatively more deprived

Two of the areas that moved from the 30% to 50% most deprived group in WIMD 2019 to the 10% to 20% most deprived group in WIMD 2025 were:

  • Ringland 1 in Newport (the Coldra area)
    • ‘Milford: North 2’ in Pembrokeshire, an LSOA that has changed boundary since WIMD 2019, when it was grouped with what is now ‘Milford: North 1’ (in the 30% to 50% most deprived for employment deprivation).

Relatively less deprived 

One area moved from the 10% most deprived group in WIMD 2019 to the 30% to 50% most deprived group in WIMD 2025. This was Plasnewydd 7 in Cardiff, an area close to the city centre including the junction of City Road and Newport Road.

Local authority analysis

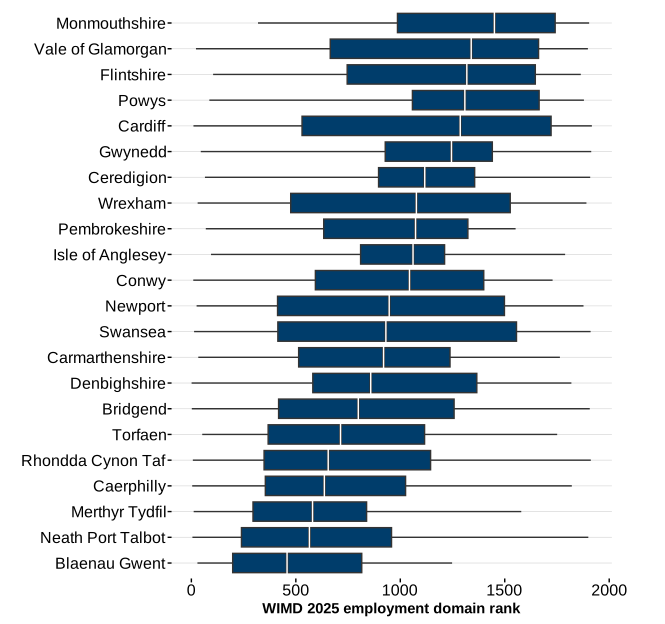
Figure 3.3: box plot of WIMD 2025 employment domain ranks, by local authority

Image

Description of figure 3.3: the chart shows the spread of employment domain ranks for each local authority in Wales. The blue boxes contain half the total number of small areas (LSOAs) in each local authority, centred on the median (middle) rank for each local authority and the ‘whiskers’ show the full range of ranks within the local authority. Deprivation increases with decreasing rank (that is, towards the left-hand side of the plot). 

The spread of employment domain ranks was greatest in Cardiff followed by Swansea, while the narrowest were in Isle of Anglesey and Ceredigion. Monmouthshire had the highest median rank (less deprived) and Blaenau Gwent the lowest (more deprived).

Concentrations of employment deprived areas, by local authority

One way of considering WIMD data at the local authority level is to look at the proportion of areas within the local authority that are in the most deprived 10% (or 20% etc) of all areas . This method can be seen as identifying the concentration of the most deprived areas in a local authority, rather than an average level of deprivation.

The WIMD 2025 employment domain results show that:

  • the local authority with the highest proportion of areas in the most deprived 10% in Wales was Blaenau Gwent (24% or 11 areas) followed by Neath Port Talbot (20% or 18 areas)
  • Monmouthshire had no small areas in the most deprived 10% , followed by Ceredigion, Gwynedd and Powys with only one each of their areas
  • Powys and Monmouthshire were also the local authorities with the lowest concentrations of areas in the most deprived half of Wales, at 22% and 24% respectively
  • Blaenau Gwent and Merthyr Tydfil had the highest percentage of areas in the most deprived 50%, at 87% and 81% respectively

Concentrations of WIMD 2025 employment deprived areas, by local authority on StatsWales.

Other relevant sources

Data for England and Wales

We will continue to work with MHCLG and other devolved governments to explore opportunities to produce harmonised outputs. Release plans will be announced on GOV.UK in due course.

Benefit statistics

The Department for Work and Pension’s dissemination tool Stat-Xplore (DWP) allows you to download and customise benefit statistics, including local area data and time series. 

Labour market statistics

The Welsh Government publishes labour market data for UK countries and regions and also for Welsh economic regions and local authorities, based on the Annual Population Survey. This includes estimates of employment, unemployment and economic inactivity.

Working and workless households

The Office for National Statistics publish data at a local level about households and the adults and children living in them, by their economic activity status. These are based on the Annual Population Survey Household (APSH) datasets.

Health domain results

Introduction

The purpose of this domain is to measure lack of good health in all people, and to capture predictors of future health based on deprivation experienced in childhood. The domain has a relative weight of 15% in the overall index.

Indicators

Figure 4.1: health domain indicators, WIMD 2025

Image

Description of figure 4.1: diagram showing that the health domain has seven indicators, each a rate within the relevant population, and the percentage shown next to each indicator is the amount it contributes to the overall domain.

Of the indicators, 2 relate to children:

  • low birth weight (live single births less than 2.5kg), 2015 to 2024 (4.3%)
  • children aged 4 to 5 living with obesity, 5 years combined: 2016/17 (September 2016 to August 2017), 2017/18, 2018/19, 2022/23 and 2023/24 (3.6%)

Of the indicators, 3 capture specific diagnosed conditions:

  • chronic conditions diagnosed by GPs, July 2025 (19.6%)
  • mental health conditions diagnosed by GPs, July 2025 (8.1%)
  • cancer incidence, all malignancies excluding non-melanoma skin cancer, 2012 to 2021 (4.7%)

Of the indicators, 2 capture broader population health status:

  • premature deaths (death under the age of 75), 2015 to 2024 (27.9%)
  • self-reported limiting long-term illness, 2021 (31.7%)

Some of the indicators are age-sex standardised to account for population differences across small areas. Within the health domain, factor analysis is used to determine the weights.

Full details on the indicators and construction of the domain is available in the WIMD 2025 technical report.

Main points

Figure 4.2: map of LSOAs shaded by health deprivation group, WIMD 2025

Image

© Crown copyright 2025. Cartographics. Welsh Government.

Description of figure 4.2: the map shows that for the WIMD 2025 health domain there were pockets of high health deprivation in the South Wales valleys and large cities, and in some North Wales coastal towns.

  • For the health domain, the most deprived small area was Rhyl West 2 followed by Rhyl West 1 (in Denbighshire) then Brackla 3 (in Bridgend).
  • These areas were ranked as the second, fourth and fifth most deprived respectively in WIMD 2019.
  • The overall patterns of health deprivation in WIMD 2025 are fairly similar to those for WIMD 2019.
  • The local authorities with the highest concentration of areas in the most deprived 10% of small areas were Merthyr Tydfil (28%), followed by Neath Port Talbot (19%) and Cardiff (16%).
  • Ceredigion had no small areas in the most deprived 10%, and Gwynedd, Isle of Anglesey, Monmouthshire and Powys had one each.

The full set of domain ranks from WIMD 2025 and the underlying indicators can be downloaded from our StatsWales web pages.

Comparison between WIMD 2019 and WIMD 2025

There have been some small methodological changes to the health domain between WIMD 2019 and WIMD 2025, but they remain broadly comparable. For full information on how the domain has changed since 2019 see the WIMD 2025 technical report.

Table 4.1: movement between health deprivation group between WIMD 2019 and 2025
WIMD 
deprivation 
group
10% 
most 
deprived 
2025
10% to 20% most 
deprived 
2025
20% to 30% most 
deprived 
2025
30% to 50% most 
deprived 
2025
50% 
least 
deprived 
2025
10% 
most 
deprived 
2019
76%20%4%0%0%
10% to 20% 
most 
deprived 
2019
20%52%21%7%0%
20% to 30% 
most 
deprived 
2019
4%22%38%35%2%
30% to 50% 
most 
deprived 
2019
0%3%16%62%19%
50% 
least 
deprived 
2019
0%0%1%7%92%

The table shows the percentage of small areas (LSOAs) in each deprivation group for WIMD 2019 that have stayed or moved group in WIMD 2025. For an explanation of how we have treated the minority of areas that changed boundary, please see the guidance report.

The diagonal (top left to bottom right) shows the percentage of areas which have remained in the same deprivation group. Above the diagonal are percentages of areas which have moved from a more to a less deprived group. Below the diagonal are the percentages of areas which have moved from a less to a more deprived group.

The table shows that:

  • except for the 20% to 30% most deprived group, most LSOAs remained in the same deprivation group between 2019 and 2025
  • of the 10% most deprived areas in 2019, 76% remained in that group in 2025
  • of the 50% least deprived areas in 2019, 92% remained in that group in 2025

Only one area moved by more than 2 deprivation groups, Llanishen 11 in Cardiff, which moved from the 50% least deprived in 2019 to the 10% to 20% most deprived in 2025 (note that this does not appear in the above table due to rounding).

Below we focus on other areas that have moved most in or out of the more deprived groups.

Relatively more deprived

Seven areas have moved from the 20% to 30% most deprived group in WIMD 2019 to the 10% most deprived group in WIMD 2025, spread across seven different local authorities.

Relatively less deprived

Seven areas moved from the 10% most deprived group to the 20% to 30% most deprived group in WIMD 2025, although 2 of those had changed LSOA boundary between WIMD 2019 and WIMD 2025.

Local authority analysis

Figure 4.3: box plot of WIMD 2025 health domain ranks, by local authority

Image

Description of figure 4.3: the chart shows the spread of health domain ranks for each local authority. The blue boxes contain half the total number of small areas (LSOAs) in each local authority, centred on the median (middle) rank for each local authority and the ‘whiskers’ show the full range of ranks within the local authority. Deprivation increases with decreasing rank (that is, towards the left-hand side of the plot).

The chart shows that the spread of health domain ranks is greatest in Cardiff, the Vale of Glamorgan and Swansea, and narrowest in Isle of Anglesey, Ceredigion and Gwynedd. Powys has the highest median rank (less deprived) and Blaenau Gwent has the lowest (more deprived).

Concentrations of WIMD 2025 health deprived areas, by local authority

One way of considering WIMD data at the local authority level is to look at the proportion of areas within the local authority that are in the most deprived 10% (or 20% etc) of all areas. This method can be seen as identifying the concentration of the most deprived areas in a local authority, rather than an average level of deprivation.

The WIMD 2025 health domain results show that:

  • the local authority with the highest proportion of areas in the most deprived 10% was Merthyr Tydfil (28%, or 10 areas), followed by Neath Port Talbot (19%, or 17 areas) then Cardiff (16%, or 34 areas)
  • Ceredigion had no small areas in the most deprived 10%, and Gwynedd, the Isle of Anglesey, Monmouthshire and Powys each had one small area in the most deprived 10%
  • Powys had the lowest concentrations of areas in the most deprived half of Wales, at 20%
  • Blaenau Gwent had the highest percentage of areas in the most deprived 50%, at 83%

Concentrations of WIMD 2025 health deprived areas, by local authority on StatsWales.

Other relevant sources

Welsh Government Health and Social Care Statistics

We publish a comprehensive set of information on health, health services and social services in Wales. These statistics cover a wide range of topics including NHS primary and community activity, waiting times and NHS staff.

Dental health

We have published new data on oral health assessments performed during NHS dental contacts. We mentioned plans to look into this as a potential WIMD indicator in our proposals report and subsequent summary of user feedback. However we found that the coverage of the data (proportions of people having recent NHS dental contacts) was variable by LSOA, meaning at present we cannot confidently assess dental health consistently across Wales, which is required for a WIMD indicator.

National Survey for Wales

The National Survey for Wales asks questions about health and use of health services. This covers a wide range of topics which vary by survey year, and results can be found on the Survey topic pages for Population Health and NHS & Social Care.

Public Health Wales

The Public Health Wales Observatory provides public health intelligence for decision makers and the public. As part of this, the Public Health Outcomes Framework compiles information on health outcomes for the people of Wales.

Childhood vaccinations

Public Health Wales publish reports on the uptake of childhood vaccinations based on data from the national community child health database (managed by Digital Health and Care Wales). We mentioned plans to look into this as a potential WIMD indicator in our proposals report and subsequent summary of user feedback. We looked at 6 years’ worth of data and found the data contained a very high degree of variability for LSOAs compared to other indicators in the domain. We will review in future with a longer, post-pandemic set of data.

Welsh Cancer Intelligence & Surveillance Unit

The Welsh Cancer Intelligence & Surveillance Unit is the National Cancer Registry for Wales and its primary role is to record, store and report on all incidence of cancer for the resident population of Wales wherever they are treated. 

Health Maps Wales

Health Maps Wales contains a wide range of health data about Welsh residents, including hospital admissions, mortality and child health.

Office for National Statistics

The Office for National Statistics also publishes statistics on health and social care, including life expectancy, and mortality data, collected from registrations and surveys.

School Health Research Network

The student health and wellbeing survey of secondary schools conducted by the School Health Research Network provides a range of data including measures of mental wellbeing and physical activity in 11 to 16 year olds.

Education domain results

Introduction

The purpose of this domain is to capture the extent of deprivation relating to education, training and skills. It is designed to reflect educational disadvantage within an area in terms of lack of qualifications and skills. The domain has a relative weight of 14% in the overall index.

Indicators

Figure 5.1: education domain indicators, WIMD 2025

Image

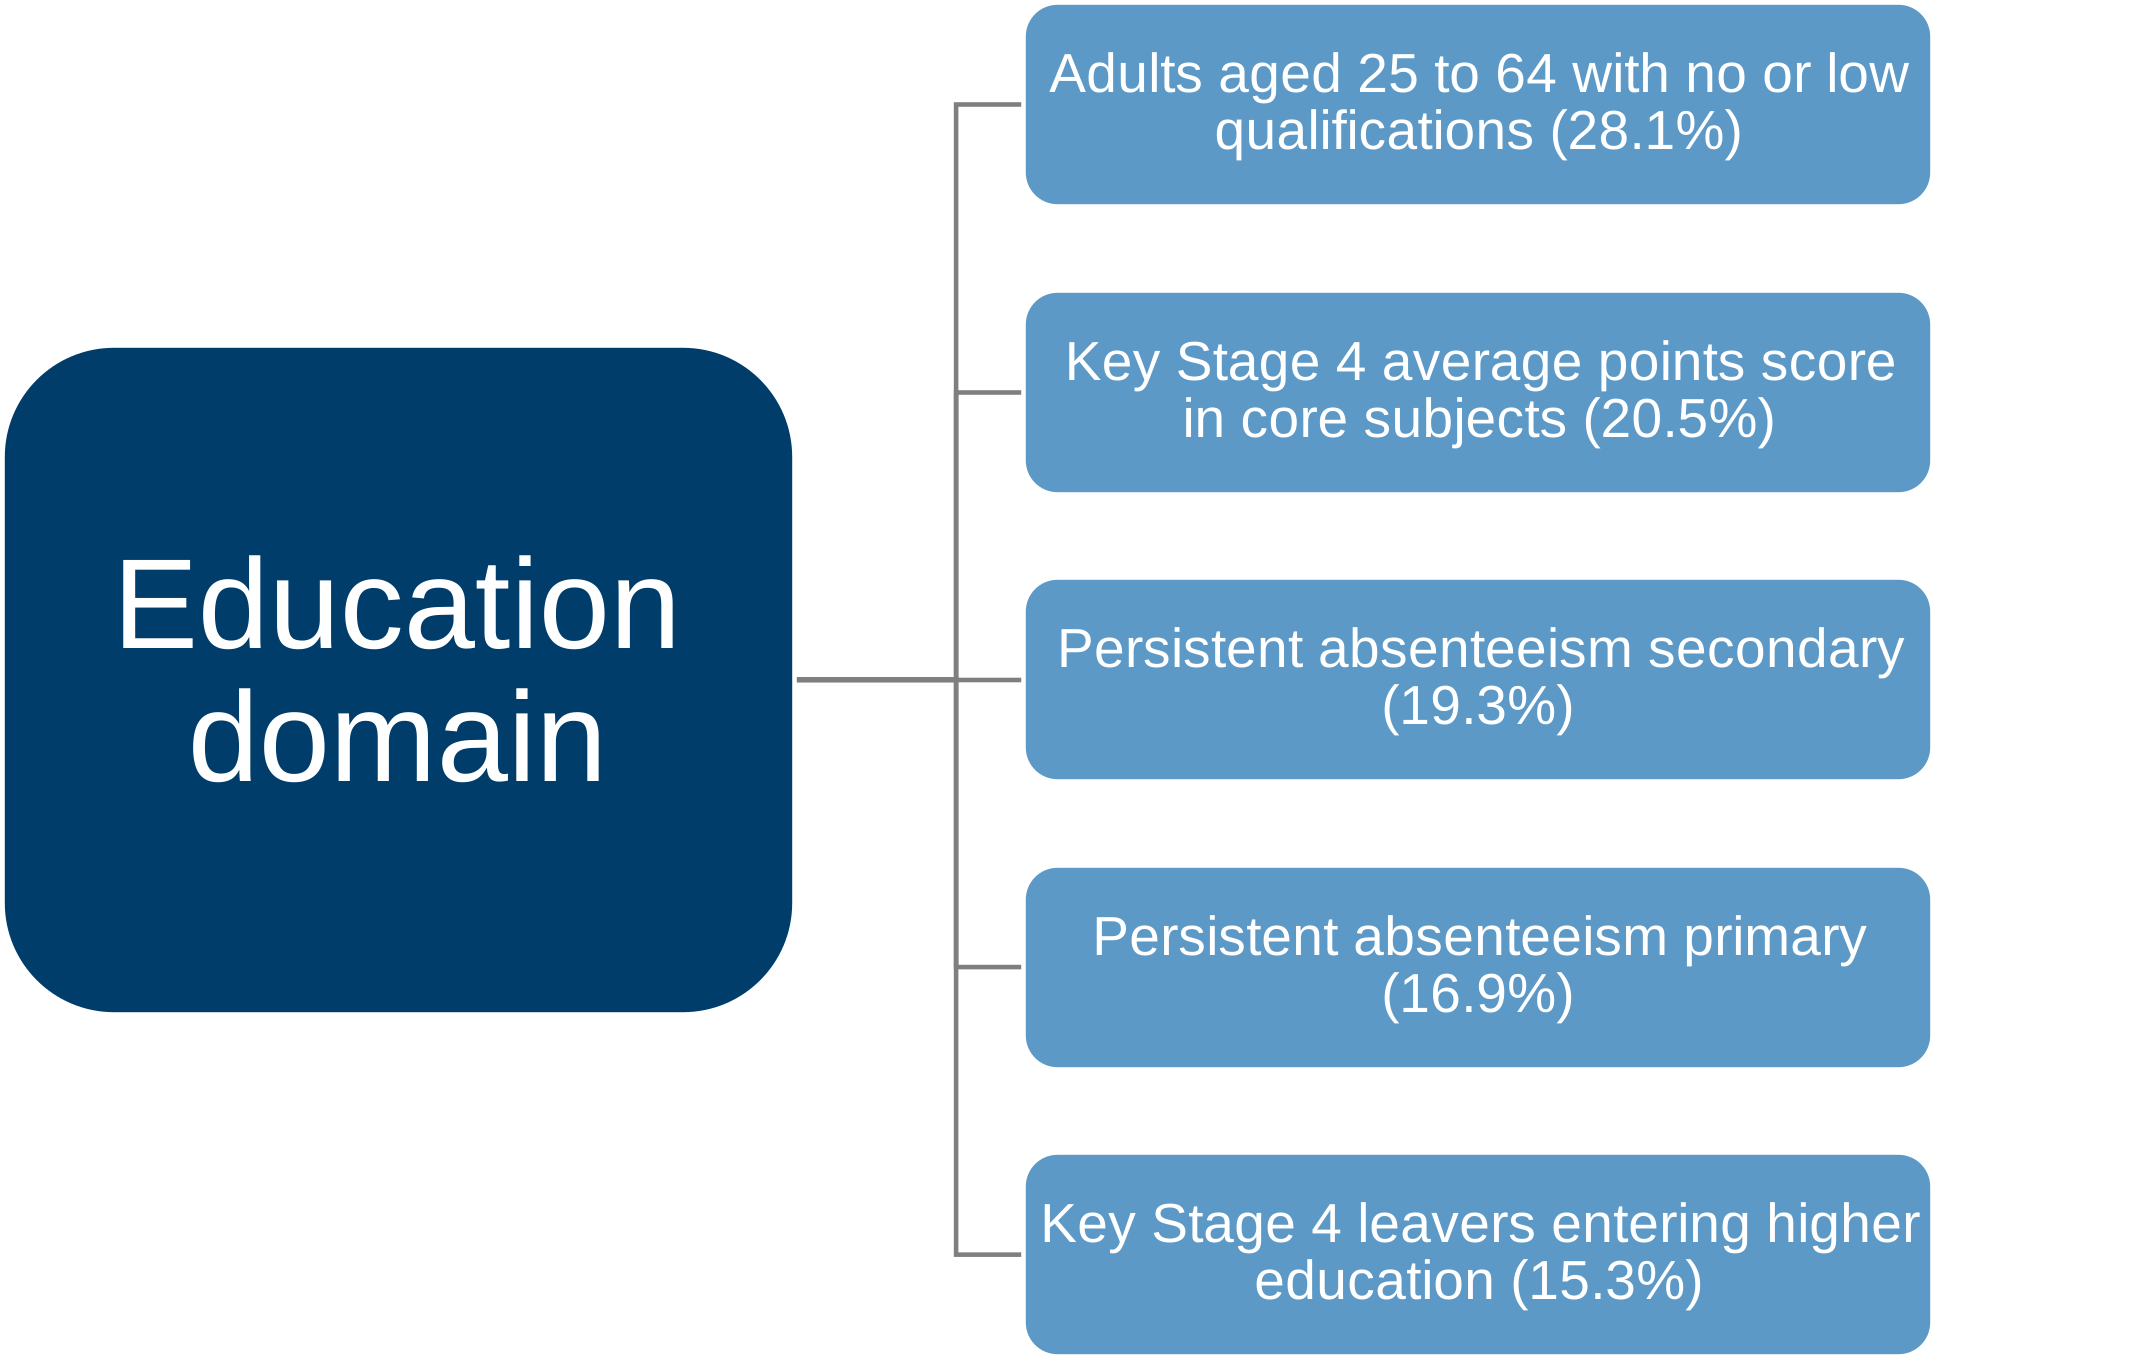
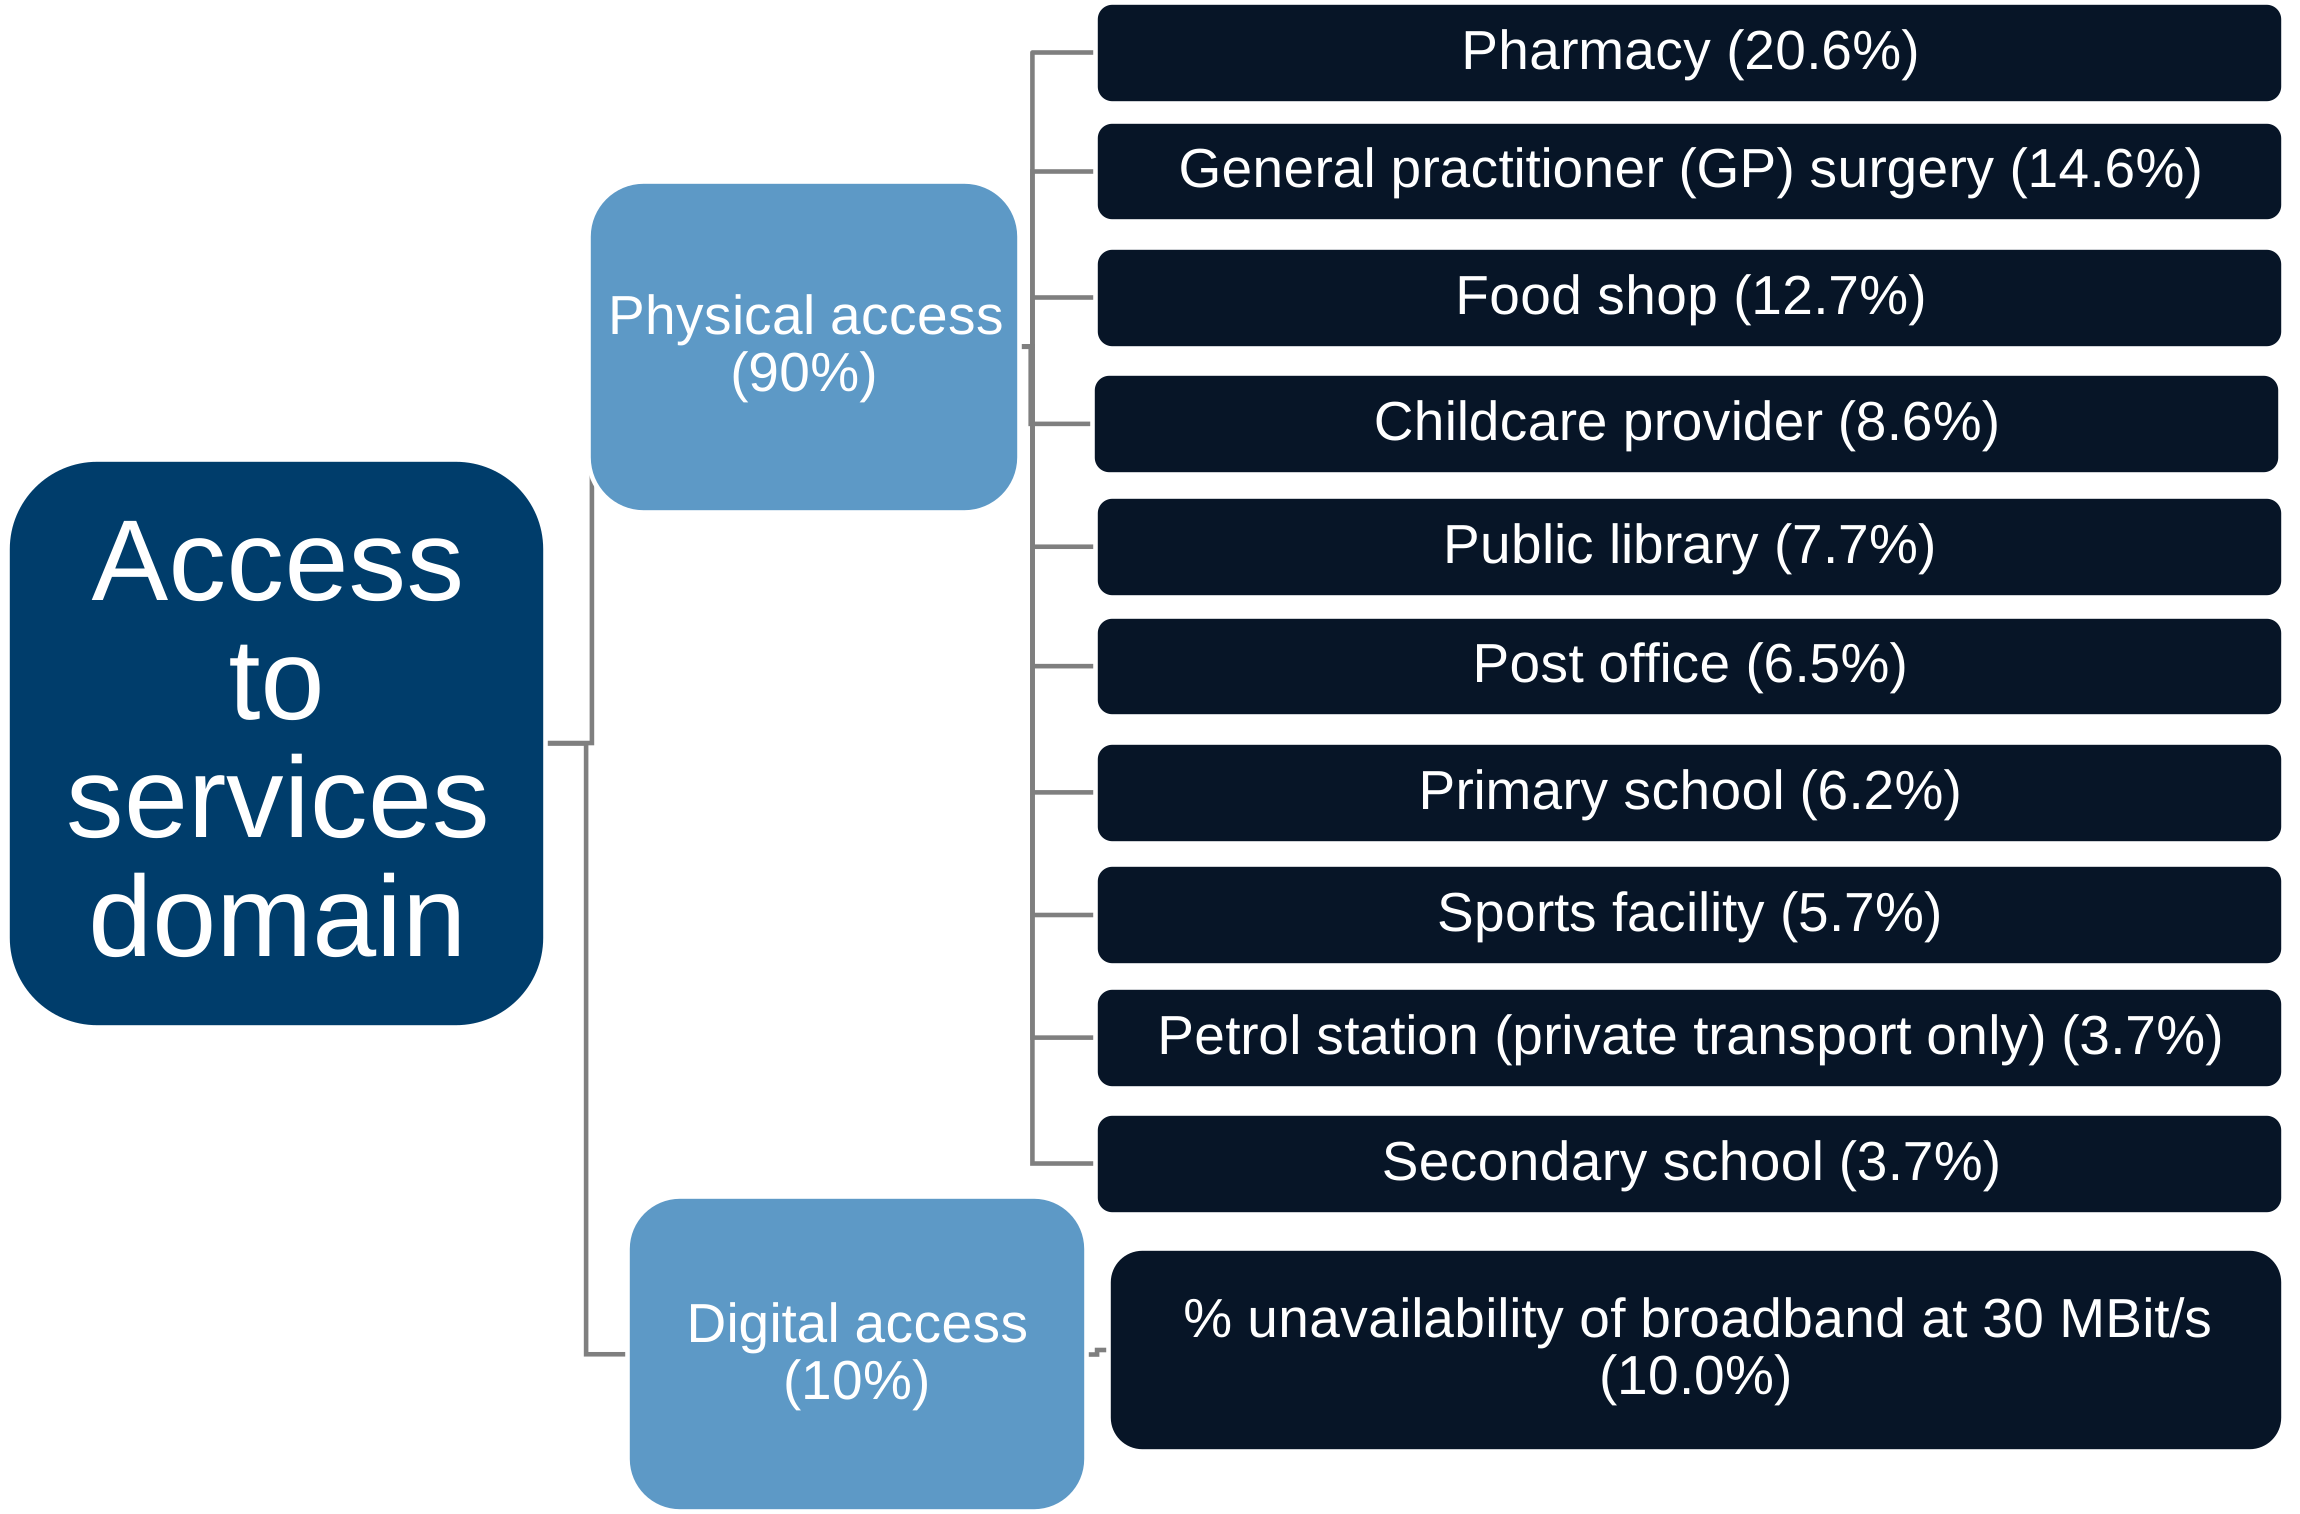
Description of figure 5.1: diagram showing that the education domain has 5 indicators, and the percentage shown next to each indicator is the amount it contributes to the overall domain.

Of the indicators, 3 focus on capturing low attainment and behaviours that may impact that (such as absenteeism) among school children:

  • average points score of year 11 pupils (Key Stage 4, KS4) calculated from the grades achieved in the core subjects of GCSE English or Welsh, mathematics and science (or equivalent qualifications); a 2-year average based on academic years 2022 to 2023 (2022/23) and 2023/24
  • two persistent absenteeism indicators of the percentage of primary and secondary school pupils respectively missing 10% or more of school sessions; 2-year averages based on academic years 2022/23 and 2023/24

Of the indicators, 2 focus on capturing the lack of qualifications and skills in adults and young people post-compulsory education age:

  • the proportion of KS4 pupils who, at some point in the 4 years after leaving year 11, enter higher education; a 4-year average based on pupils who left school between academic years 2016/17 and 2019/20
  • the proportion of adults aged 25 to 64 with no qualifications or low (level 1) qualifications, based on 2021 Census data

Full details on the indicators and construction of the domain is available in the WIMD 2025 technical report. This includes information about the 2 previous indicators (Foundation Phase and Key Stage 2 attainment) that are no longer able to be included.

Main points

Figure 5.2: map of LSOAs shaded by education deprivation group, WIMD 2025

Image

© Crown copyright 2025. Cartographics. Welsh Government.

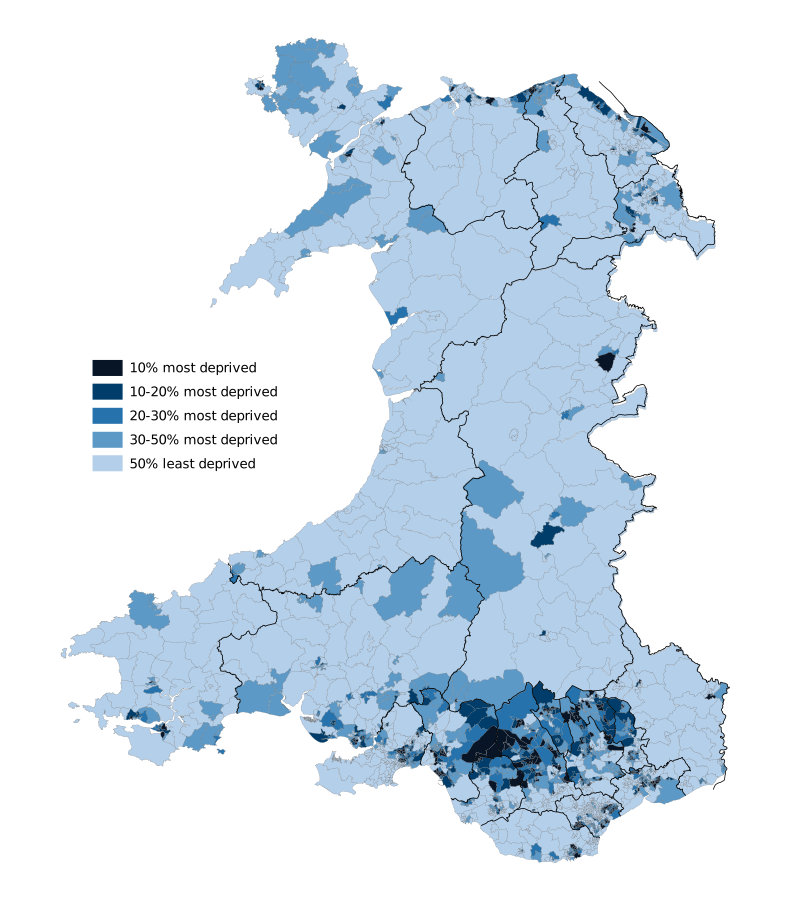
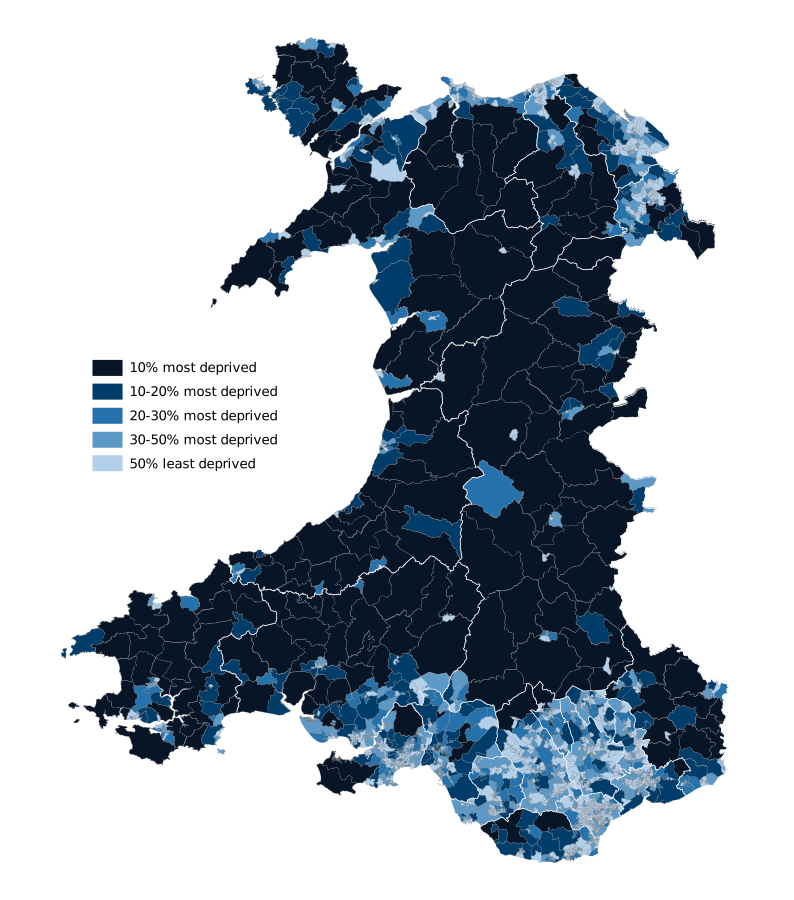
Description of figure 5.2: the map shows that in the WIMD 2025 education domain, there were pockets of high education deprivation in the South Wales valleys, in larger towns and cities, and in some North Wales and West Wales coastal towns. 

  • For the education domain, the most deprived area in Wales was Cymer 2 (Neath Port Talbot), this area was ranked 53rd most deprived in 2019.
  • Out of the 10 most deprived areas in WIMD 2025, 3 were also in the 10 most deprived areas in WIMD 2019.
  • The local authority with the highest proportion of areas in the most deprived 10% was Blaenau Gwent (22%), followed by Neath Port Talbot (21%).
  • Ceredigion was the only local authority with no LSOAs in the most deprived 10% of areas.
  • The overall patterns of education deprivation in WIMD 2025 are similar to those for WIMD 2019.

The full set of domain ranks from WIMD 2025 and the underlying indicators can be downloaded from the StatsWales web pages.

Comparison between WIMD 2019 and WIMD 2025

Two indicators have been removed from this domain, another split into 2 indicators (by stage of school) and another has changed slightly in scope. The education domain is therefore not directly comparable with that for WIMD 2019. For full information on how the domain has changed since 2019 see the technical report.

Table 5.1: movement between education deprivation group between WIMD 2019 and 2025
WIMD 
deprivation 
group
10% 
most 
deprived 
2025
10% to 20% most 
deprived 
2025
20% to 30% most 
deprived 
2025
30% to 50% most 
deprived 
2025
50% 
least 
deprived 
2025
10% 
most 
deprived 
2019
73%21%5%1%0%
10% to 20% 
most 
deprived 
2019
25%41%23%9%2%
20% to 30% 
most 
deprived 
2019
2%26%32%34%6%
30% to 50% 
most 
deprived 
2019
0%6%19%50%25%
50% 
least 
deprived 
2019
0%0%1%11%88%

The table shows the percentage of small areas (LSOAs) in each deprivation group for WIMD 2019 that have stayed or moved group in WIMD 2025. For an explanation of how we have treated the minority of areas that changed boundary, please see the guidance report.

The diagonal (top left to bottom right), shows the percentage of areas which have remained in the same deprivation group. Above the diagonal are percentages of areas which have moved from a more to a less deprived group. Below the diagonal are the percentages of areas which have moved from a less to a more deprived group.

The table shows that:

  • most LSOAs in the most deprived and least deprived deprivation groups remained in the same group between 2019 and 2025
  • of the 10% most deprived areas in 2019, 73% remained in that group in 2025
  • of the 50% least deprived areas in 2019, 88% remained in that group in 2025

Relatively more deprived

Only one area moved by more than 2 deprivation groups to become relatively more deprived, Mardy 3 in Monmouthshire, which moved from the 30% to 50% least deprived in 2019 to the 10% most deprived in 2025 (note that this does not appear in the above table due to rounding). 

Relatively less deprived

Six LSOAs moved by more than 2 deprivation groups becoming relatively less deprived, and of these areas:

  • two have moved from the 10% most deprived group in WIMD 2019 to the 30% to 50% most deprived group in WIMD 2025
  • four have moved from the 10% to 20% most deprived group to the 50% least deprived group

Cardiff contained 4 of these areas, in Adamsdown, Cathays and Butetown, with very small pupil numbers affecting the latter 2 areas. Rhondda Cynon Taf contained one (in the Treforest area) and Wrexham contained one (in the Brynyffynnon area).

Local authority analysis

Figure 5.3: box plot of WIMD 2025 education domain ranks, by local authority

Image

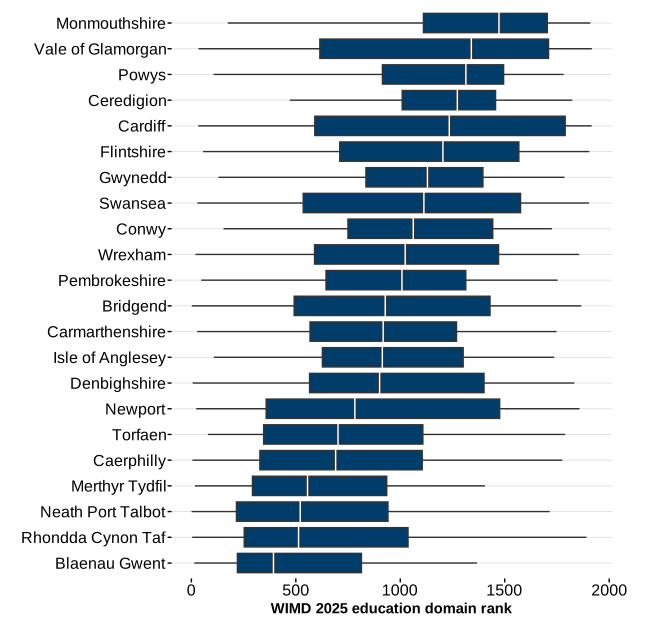
Description of figure 5.3: the chart shows the spread of education domain ranks for each local authority. The blue boxes contain half the total number of small areas (LSOAs) in each local authority, centred on the median (middle) rank for each local authority and the ‘whiskers’ show the full range of ranks within the local authority. Deprivation increases with decreasing rank (that is, towards the left-hand side of the plot).

The spread of education domain ranks is greatest in Cardiff, Newport and Vale of Glamorgan and narrowest in Ceredigion. Monmouthshire has the highest median rank (less deprived) and Blaenau Gwent has the lowest (more deprived).

Concentrations of education deprived areas, by local authority

One way of considering WIMD data at the local authority level is to look at the proportion of areas within the local authority that are in the most deprived 10% (or 20% etc) of all areas. This method can be seen as identifying the concentration of the most deprived areas in a local authority, rather than an average level of deprivation.

The WIMD 2025 education domain results show that:

  • the local authority with the highest proportion of areas in the most deprived 10% was Blaenau Gwent (22%), followed by Neath Port Talbot (21%) then Rhondda Cynon Taf (20%)
  • Blaenau Gwent and Merthyr Tydfil had the highest percentage of areas in the most deprived 50% (at 85% and 83% respectively)
  • Ceredigion was the only local authority with no small areas in the most deprived 10%.  Isle of Anglesey, Gwynedd, Conwy, Powys and Monmouthshire each have 2 areas in the 10% most deprived
  • Ceredigion had the lowest proportion of areas in the 50% most deprived at 18%, followed by Monmouthshire (21%) and Powys (28%)

Concentrations of WIMD 2025 education deprived areas, by local authority on StatsWales.

Other relevant sources

Welsh Government education statistics 

The Welsh Government publishes information on education and skills in Wales. These statistics cover a wide range of topics relating to education including examination results and absence.

Medr

Medr, the Commission for Tertiary Education and Research, publishes official statistics about tertiary education and other data relating to tertiary education and research. This includes information on destination of post-16 learners on completion of their learning programmes. 

Office for National Statistics

The Office for National Statistics also publishes statistics relating to education from the 2021 Census.

Pupil destinations survey

Data on young people who are not in education, employment or training (NEET) is published by CareersWales based on the pupil destinations survey. Whilst it was not possible to use this data in WIMD 2025 due to concerns around coverage and consistency at LSOA level, we will consider any developments for future WIMD releases.

Access to services domain results

Introduction

The purpose of this domain is to capture deprivation as a result of a household’s inability to access a range of services considered necessary for day-to-day living, both physically and online. This covers both material deprivation (for example, not being able to get food) and social aspects of deprivation (for example, not being able to attend after school activities). The domain has a relative weight of 10% in the overall index.

Indicators

Figure 6.1: access to services domain indicators, WIMD 2025

Image

Description of figure 6.1: diagram showing that the access to services domain has 20 indicators grouped into 2 sub-domains. Each service in the physical access sub-domain has a public transport indicator (excluding petrol stations) and a private transport indicator. 

The physical access sub-domain contains 19 indicators measuring the average travel time to 1 of 10 services using a mode of transport (public or private). The services included are (in descending order of indicator weight):

  • pharmacy
  • General Practitioner (GP) surgery
  • food shop
  • childcare provider
  • public library
  • post office
  • primary school
  • sports facility
  • petrol station (private transport only)
  • secondary school

The indicators measure an average return travel time (in minutes) from residential dwellings to the nearest service by the given mode of transport. Public transport includes travel by public bus, public train, foot and national coach. Private transport is travel by private car.  

The digital access sub-domain measures the percentage of homes and small businesses unable to receive fixed line broadband at a download speed of at least 30MB/s (superfast broadband).

Public and private travel time indicators for each service are combined in weighted sums using Census 2021 data on car ownership and the number of adults ages 17 or over. Factor analysis is then applied to these combined scores to calculate the weights displayed in figure 6.1, which contributes 90% of the overall domain score. The digital access subdomain contributes the remaining 10% of the domain score.

Childcare provider has been introduced to the list of services included in the physical access sub-domain for WIMD 2025, with two corresponding new indicators. Childcare providers are those registered with Care Inspectorate Wales (CIW), including day and sessional care, crèches, out of school care and childminders.

Most datasets for these indicators relate to a 2025 time period. Full details on indicators and the construction of the domain is available in the WIMD 2025 technical report. The report includes details of the travel time indicator methodology, which has changed since WIMD 2019.

Main results

Figure 6.2: map of LSOAs shaded by access to services deprivation group, WIMD 2025

Image

© Crown copyright 2025. Cartographics. Welsh Government.

Description of figure 6.2: the map shows that in the WIMD 2025 access to services domain high deprivation was widespread across rural areas.  

  • The local authority with the highest proportion of areas in the 10% most deprived was Powys (at 49%) followed by Ceredigion (at 44%) and Pembrokeshire (at 35%).
  • Blaenau Gwent, Bridgend, Caerphilly, Cardiff and Torfaen had no areas in the 10% most deprived group.
  • The overall patterns of access to services deprivation in WIMD 2025 are broadly like those for WIMD 2019.
  • For the access to services domain, the most deprived area in Wales was Llanegwad 2, a rural area in Carmarthenshire, which was ranked fifth most deprived in WIMD 2019.
  • Of the 10 most deprived areas in Wales in 2025, 4 were also in the top 10 most deprived in 2019.

The full set of domain ranks from WIMD 2025 and the underlying indicators can be downloaded from  our StatsWales web pages.

Comparison between WIMD 2019 and WIMD 2025

There is one new indicator in this domain, and some of the travel time methodology and data sources have changed. The access to services domain is therefore not directly comparable with that for WIMD 2019. For full information on how the domain has changed since 2019 see the technical report.

Table 6.1: movement between access to services deprivation group between WIMD 2019 and 2025
WIMD 
deprivation 
group
10% 
most 
deprived 
2025
10% to 20% most 
deprived 
2025
20% to 30% most 
deprived 
2025
30% to 50% most 
deprived 
2025
50% 
least 
deprived 
2025
10% 
most 
deprived 
2019
87%12%1%1%0%
10% to 20% 
most 
deprived 
2019
12%45%20%15%8%
20% to 30% 
most 
deprived 
2019
1%20%24%37%19%
30% to 50% 
most 
deprived 
2019
1%8%16%30%45%
50% 
least 
deprived 
2019
0%1%4%17%77%

The table shows the percentage of small areas (LSOAs) in each deprivation group for WIMD 2019 that have stayed or moved group in WIMD 2025. For an explanation of how we have treated the minority of areas that changed boundary, please see the guidance report.

The diagonal (top left to bottom right) shows the percentage of areas which have remained in the same deprivation group. Above the diagonal are percentages of areas which have moved from a more to a less deprived group. Below the diagonal are the percentages of areas which have moved from a less to a more deprived group.

The table shows that:

  • most LSOAs in the most deprived and least deprived deprivation groups remained in the same group between 2019 and 2025
  • of the 10% most deprived areas in 2019, 87% remained in that group in 2025
  • of the 50% least deprived areas in 2019, 77% remained in that group in 2025

For access to services, 30 areas moved by more than 2 deprivation groups. Below we focus on those that have moved in or out of the most deprived group:

Relatively more deprived

Two areas moved from the 30% to 50% most deprived group in 2019 to the most deprived 10% in 2025, these were Resolven 1 in Neath Port Talbot and Borth in Ceredigion.

Relatively less deprived

One area moved from the 10% most deprived group in 2019 to the 30% to 50% most deprived group in 2025, this was Llandrindod South in Powys.

Another 16 areas moved from the 10% to 20% most deprived to the 50% least deprived group; the biggest movers in this group were Rhyl West 2 in Denbighshire and Coity Higher 3 in Bridgend (an LSOA that has changed boundary).

Local authority analysis

Figure 6.3: box plot of WIMD 2025 access to services domain ranks, by local authority

Image

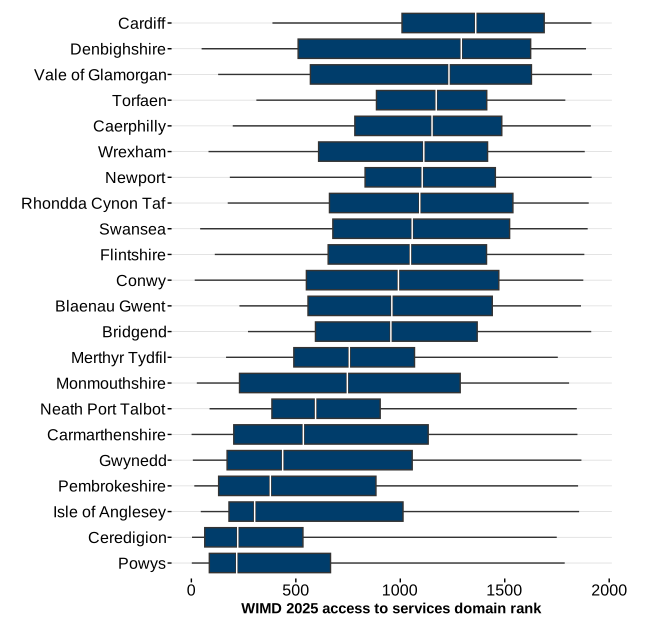
Description of figure 6.3: the chart shows the spread of access to services domain ranks for each local authority. The blue boxes contain half the total number of small areas (LSOAs) in each local authority, centred on the median (middle) rank for each local authority and the ‘whiskers’ show the full range of ranks within the local authority.  Deprivation increases with decreasing rank (that is, towards the left-hand side of the plot). 

The spread of access to services domain ranks is greatest in Denbighshire, Vale of Glamorgan and Monmouthshire and narrowest in Ceredigion followed by Neath Port Talbot and Torfaen. Cardiff has the highest median rank (less deprived) and Powys and Ceredigion have the lowest (more deprived).

Concentrations of access to services deprived areas, by local authority

One way of considering WIMD data at the local authority level is to look at the proportion of areas within the local authority that are in the most deprived 10% (or 20% etc) of all areas. This method can be seen as identifying the concentration of the most deprived areas in a local authority, rather than an average level of deprivation.

The WIMD 2025 access to services domain results show that:

  • the local authority with the highest proportion of areas in the most deprived 10% was Powys (49% or 39 areas) followed by Ceredigion (44% or 20 areas)
  • Blaenau Gwent, Bridgend, Caerphilly, Cardiff and Torfaen had no areas in the 10% most deprived
  • Ceredigion and Powys had the highest percentage of areas in the most deprived 50%, at 84% and 82% respectively
  • Cardiff had the lowest percentage of areas in the 50% most deprived (22%)

Concentrations of WIMD 2025 access to services deprived areas, by local authority on StatsWales.

Other relevant sources

National Survey for Wales

The National Survey for Wales includes questions about whether people are satisfied with their ability to access the services and facilities they need. 

Ofcom

Alongside fixed provider coverage data, Ofcom publish data on fixed provider performance and mobile coverage at a variety of geographies in their connected nations report. 

Office for National Statistics (ONS)

The ONS publish interactive analyses of access to local amenities in England and Wales, including post offices, cashpoints and parks, as well as travel time estimates to railway stations and libraries.

Housing domain results

Introduction

Conceptually, the purpose of the housing domain is to identify inadequate housing, in terms of physical and living conditions and availability. Here, living condition means the suitability of the housing for its inhabitant(s), for example in terms of health and safety, and necessary adaptations.

The domain has a relative weight of 9% in the overall index. This has increased from 7% in the 2019 index, due to the addition of new indicators on energy efficiency and the inability to afford to enter owner occupation or the private rental market.

Indicators

Figure 7.1: housing domain indicators, WIMD 2025

Image

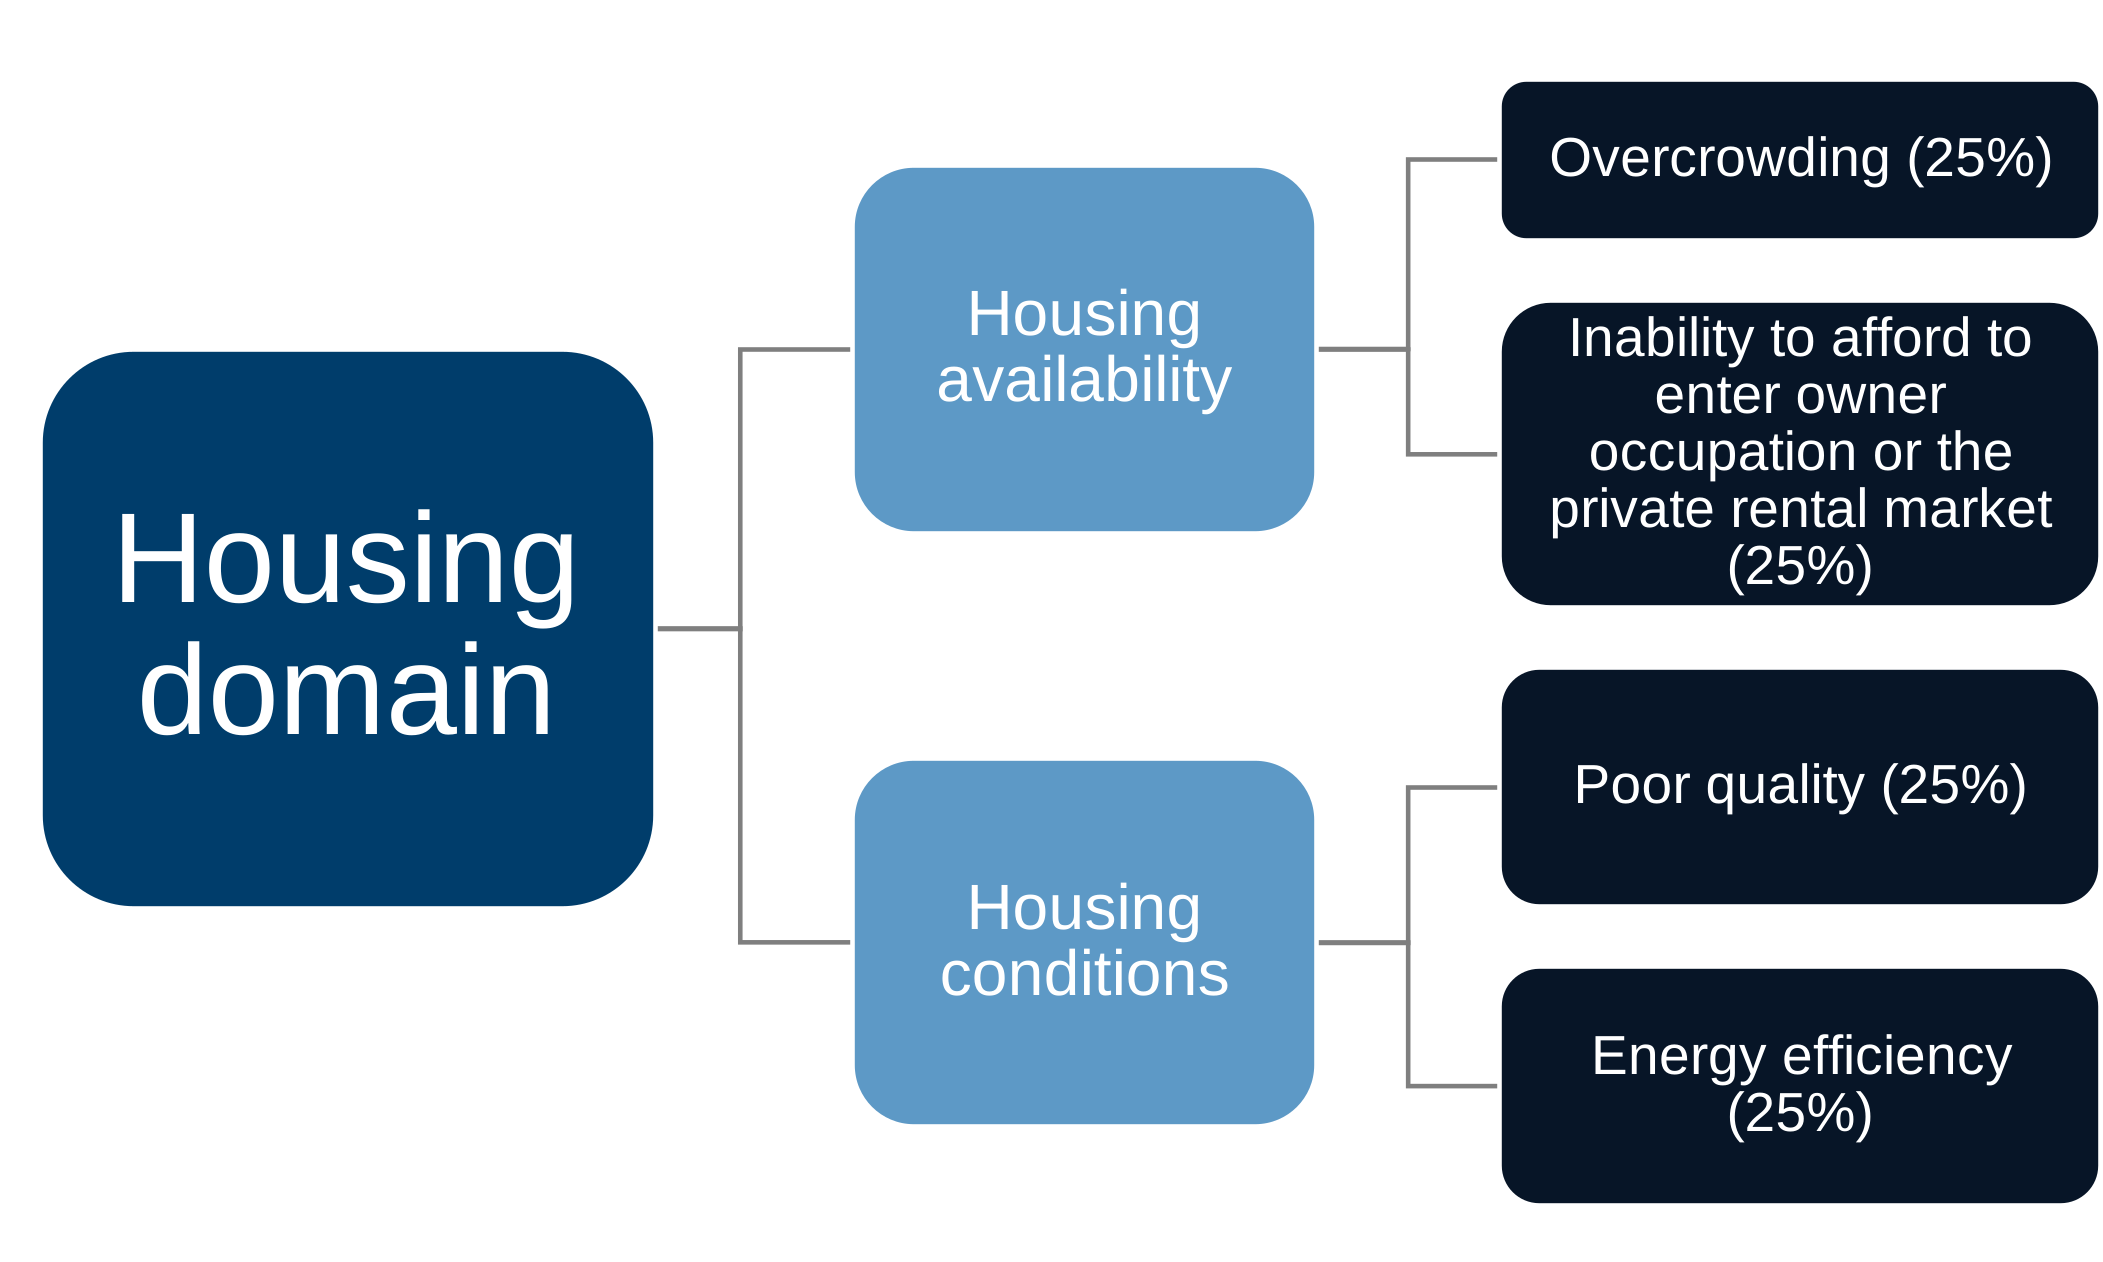
Description of figure 7.1: diagram showing that the housing domain has two equally weighted sub-domains, housing availability and housing conditions, with two equally weighted indicators each.

The housing availability sub-domain contains indicators of:

  • the percentage of households that are overcrowded on the Census 2021 based bedroom measure
  • inability to afford to enter owner occupation or the private rental market, 2023 (new for WIMD 2025, further details below)

The housing conditions sub-domain contains indicators of:

  • poor quality, the likelihood of housing being in disrepair or containing serious hazards (for example, risk of falls or cold housing), 2023
  • energy efficiency, 2012 to 2024 (new for WIMD 2025, further details below)

We are introducing a new indicator on inability to afford to enter owner occupation or the private rental market produced by Heriot-Watt University. This indicator has been used in several iterations of the English indices of deprivation, for younger households with head of household aged under 40. Our measure also considers older private renters with a head of household aged 40 to 65. These are modelled estimates based on lower quartile house prices and private rents by dwelling size, and modelled household incomes. The indicator estimates whether households in an LSOA can afford to buy or privately rent a suitable home within a broader local housing market area, based on the income and dwelling size needs of households.

We are introducing a new measure of energy efficiency, based on average Standard Assessment Procedure (SAP) scores for residential properties in the area, using data from Energy Performance Certificate (EPC) records. MHCLG have developed this indicator for residential dwellings in England and Wales, imputing estimated EPC scores for all dwellings that do not currently have a valid EPC. 

Full details on the indicators and construction of the domain is available in the WIMD 2025 technical report.

Main points

Figure 7.2: map of LSOAs shaded by housing deprivation group, WIMD 2025

Image

© Crown copyright 2025. Cartographics. Welsh Government.

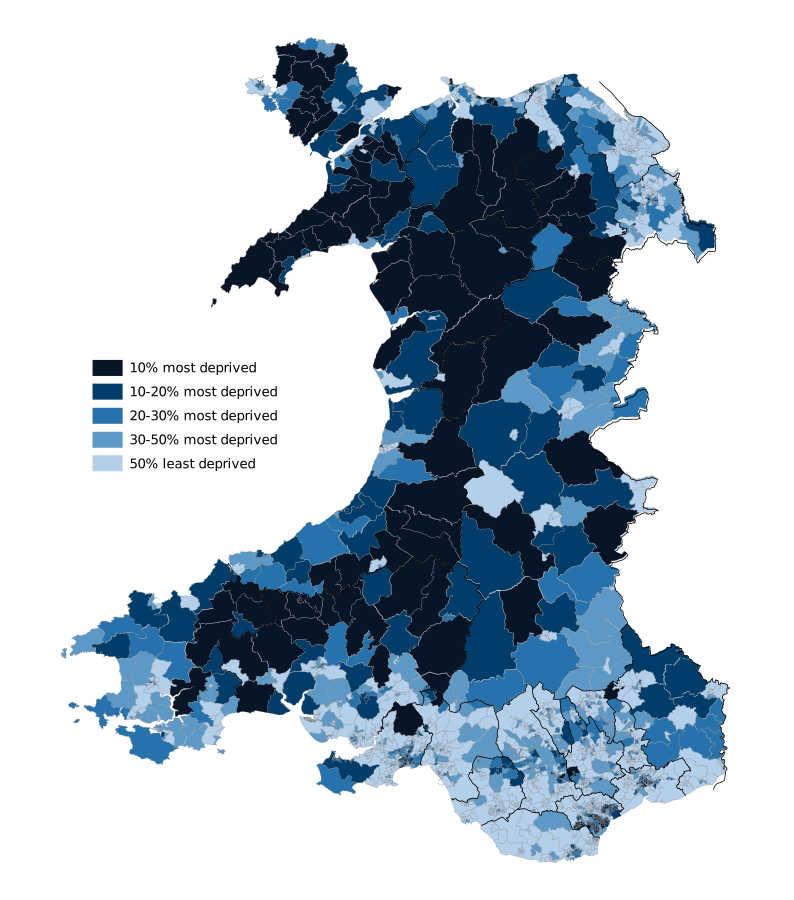
Description of figure 7.2: the map shows that in the WIMD 2025 housing domain, pockets of high housing deprivation tend to cluster in the larger towns and cities (driven by the housing availability aspect), and in more rural areas of West and North Wales (driven by the housing conditions aspect). 

  • The local authorities with the highest proportion of areas in the most deprived 10% in Wales were Gwynedd (38%), followed by Cardiff (33%).
  • Six local authorities had no small areas in the most deprived 10% in Wales: Blaenau Gwent, Bridgend, Flintshire, Merthyr Tydfil, Torfaen and the Vale of Glamorgan.
  • Five of the 10 most housing deprived areas in Wales were in Gwynedd, and 2 of these border 'Uwch Conwy’, an area of Conwy also in the top 10 most deprived.
  • The other 4 of the 10 most housing deprived areas were in Cardiff, in Grangetown and Riverside. 

The most housing deprived area was the same as for WIMD 2019: Grangetown 9 around the North end of Corporation Road. Together with its neighbour Grangetown 6, they are the only areas to appear in the most deprived decile of both the housing conditions and housing availability sub-domains.

There have been some changes in the patterns of housing deprivation seen in WIMD 2025 compared to those seen in WIMD 2019. This is to be expected given the inclusion of the new indicators on energy efficiency and inability to afford to enter owner occupation or the private rental market.

The full set of domain ranks from WIMD 2025 and the underlying indicators can be downloaded from our StatsWales web pages.

Comparison between WIMD 2019 and WIMD 2025

There are two new indicators in this domain, therefore it is not directly comparable with that for WIMD 2019. For full information on how the domain has changed since 2019 see the technical report.

Table 7.1: movement between housing deprivation group between WIMD 2019 and 2025
WIMD 
deprivation 
group
10% 
most 
deprived 
2025
10% to 20% most 
deprived 
2025
20% to 30% most 
deprived 
2025
30% to 50% most 
deprived 
2025
50% 
least 
deprived 
2025
10% 
most 
deprived 
2019
54%19%13%12%3%
10% to 20% 
most 
deprived 
2019
20%24%17%27%12%
20% to 30% 
most 
deprived 
2019
11%16%18%36%19%
30% to 50% 
most 
deprived 
2019
5%13%13%27%41%
50% 
least 
deprived 
2019
1%3%5%14%77%

The table shows the percentage of small areas (LSOAs) in each deprivation group for WIMD 2019 that have stayed or moved group in WIMD 2025. For an explanation of how we have treated the minority of areas that changed boundary, please see the guidance report.

The diagonal (top left to bottom right) shows the percentage of areas which have remained in the same deprivation group. Above the diagonal are percentages of areas which have moved from a more to a less deprived group. Below the diagonal are the percentages of areas which have moved from a less to a more deprived group.

The table shows that:

  • most LSOAs in the most deprived and least deprived deprivation groups remained in the same group between 2019 and 2025
  • of the 10% most deprived areas in 2019, 54% remained in that group in 2025
  • of the 50% least deprived areas in 2019, 77% remained in that group in 2025

Just over 100 LSOAs moved by more than 2 deprivation groups. Below we focus on those that have moved in or out of the most deprived group.

Relatively more deprived

Nine areas have moved from the 50% least deprived group in WIMD 2019 to the 10% most deprived in WIMD 2025, 6 were in Cardiff and ranked high on deprivation of housing availability, and the other 3 were in Gwynedd or Isle of Anglesey and ranked high on housing conditions deprivation.

Relatively less deprived

Five areas moved from the 10% most deprived group in WIMD 2019 to the 50% least deprived group in WIMD 2025. These were areas in or near towns in 5 different local authorities in South and Mid Wales.

Local authority analysis

Figure 7.3: box plot of WIMD 2025 housing domain ranks, by local authority

Image

Description of figure 7.3: the chart shows the spread of housing domain ranks for each local authority. The blue boxes contain half the total number of small areas (LSOAs) in each local authority, centred on the median (middle) rank for each local authority and the ‘whiskers’ show the full range of ranks within the local authority. Deprivation increases with decreasing rank (that is, towards the left-hand side of the plot).

The spread of housing domain ranks is greatest in Newport, Cardiff, Conwy and Swansea and narrowest in Gwynedd and Merthyr Tydfil. Flintshire and Bridgend have the highest median ranks (less deprived) and Gwynedd has the lowest (more deprived).

Concentrations of housing deprived areas, by local authority

One way of considering WIMD data at the local authority level is to look at the proportion of areas within the local authority that are in the most deprived 10% (or 20% etc) of all areas in Wales. This method can be seen as identifying the concentration of the most deprived areas in a local authority, rather than an average level of deprivation.

The WIMD 2025 housing domain results show that:

  • the local authority with the highest proportion of areas in the most deprived 10% in Wales was Gwynedd, with 38% or 27 of its areas in that group, driven by deprivation in housing conditions (but with five of the 27 also in the most deprived 30% on housing availability)
  • this was followed by Cardiff which had 33% or 73 of its areas in the most deprived 10% in Wales, driven by deprivation in housing availability
  • Gwynedd also had the highest percentage of areas in the most deprived 50% in Wales, at 83%
  • 6 local authorities had no small areas in the most deprived 10% in Wales: Blaenau Gwent, Bridgend, Flintshire, Merthyr Tydfil, Torfaen and the Vale of Glamorgan
  • Bridgend and Flintshire were the local authorities with the lowest concentrations of areas in the most deprived half of Wales, at 26% and 25% respectively

Concentrations of WIMD 2025 housing deprived areas, by local authority on StatsWales.

Related information

Homelessness

Homelessness can be the most extreme form of deprivation in relation to access to housing. Data relating to statutory homelessness and those who present to local authorities for housing support are available at local authority level. We are developing a new collection of individual level homelessness data in Wales, and we will explore progress on this ahead of the next index.

Housing Conditions

The Welsh Housing Conditions Survey, which collects information about the condition and energy efficiency of all types and tenures of housing in Wales, was last conducted in financial year April 2017 to March 2018 (displayed as 2017-18). There are plans for a Welsh Hosing Survey in 2027-28. This will include a standard housing conditions survey, as conducted in 2017-18, and a broader social survey element covering various housing related topics. Fieldwork will take place over the financial year 2027-28, with headline results due in December 2028.

Fuel poverty

A household is regarded as being in fuel poverty if they are unable to keep their home warm at a reasonable cost. In Wales, the full income fuel poverty definition states that a household is in fuel poverty if it needs to spend more than 10% of its income (including housing related benefits and net of council tax) on all household fuel use to maintain a satisfactory heating regime. Modelled estimates of fuel poverty for Wales as at October 2024 are available.

Private outdoor space

The natural capital team at ONS have produced and published statistics relating to private gardens (private outdoor space) down to MSOA level for the whole of Great Britain (GB). These statistics were derived from the Ordnance Survey (OS) AddressBase Plus database (and include ‘non-green’ private outdoor spaces at the front, back and side of properties, as well as ‘green’ garden space). 

The Ministry of Housing Communities & Local Government (MHCLG) have used this work as the basis for an indicator for the 2025 English indices of deprivation. We decided not to include such an indicator in WIMD 2025, for reasons set out in our proposals report and subsequent summary of user feedback.

Community safety domain results

Introduction

The purpose of this domain is to measure the proportion of people experiencing deprivation relating to living in a safe community. It covers actual experience of crime and fire, as well as perceptions of safety whilst out and about in the local area. The domain has a relative weight of 5% in the overall index.

Indicators

Figure 8.1: community safety domain indicator, WIMD 2025

Image

Description of figure 8.1: diagram showing that the community safety domain has 9 indicators, of these 7 are based on the rates of various categories of police recorded crime data, one relates to the rate of anti-social behaviour and one relates to the rate of fire incidence compared to the population at risk. The percentage shown next to each indicator is the amount it contributes to the overall domain.

The indicator numerators are the average number of incidents across 6 financial years, April 2018 to March 2019 (2018-19) to 2023-24) for the following categories of police recorded crime: 

  • violence with injury
  • violence without injury
  • public order offences
  • stalking and harassment
  • criminal damage
  • burglary
  • theft

The numerator for the anti-social behaviour indicator is the average number of recorded incidents across two financial years (2022-23 and 2023-24).

The numerator for the fire incidence indicator is the average number of fires attended across three financial years (2021-22 to 2023-24).

We have introduced some changes to the indicators used within the domain since WIMD 2019. These include: 

  • splitting the previous police recorded violent crime indicator into the first four categories of crime listed above
  • a change in the number of years of police recorded crime data from an average of 6 years (from 2 years of data), to avoid the impact of unusual patterns of recorded crime during the years affected by the COVID-19 pandemic
  • changes to  the population at risk of crime in an area to reflect that it is not just those who are resident in an area that might be impacted, and to include prison populations

Full details on the indicators and construction of the domain is available in the WIMD 2025 technical report.

Main points

Figure 8.2: map of LSOAs shaded by community safety deprivation group, WIMD 2025

Image

Crown copyright 2025: Cartographics, Welsh Government, ML/35/25.26, September 2025, OGL.

Description of figure 8.2: the map shows that in the WIMD 2025 community safety domain, there were pockets of high deprivation in the South Wales valleys and large cities, and the coastal and border towns in North Wales. 

  • Monmouthshire was the only local authority to have no LSOAs in the most deprived 10% of areas.
  • The local authorities with the highest proportion of areas in the most deprived 10% were Blaenau Gwent (at 28%) followed by Newport (23% of LSOAs in the local authority).
  • The overall patterns of community safety deprivation in WIMD 2025 are broadly similar to those for WIMD 2019.
  • The most deprived area in Wales was Rhyl West 2 in Denbighshire, (in WIMD 2019 this LSOA was ranked seventh).
  • Of the 10 most deprived areas in WIMD 2025, 3 were also in the 10 most deprived areas in WIMD 2019.
  • Of the 10 most deprived areas in Wales, 3 were in Denbighshire and 2 were located in Conwy. 

The full set of domain ranks from WIMD 2025 and the underlying indicators can be downloaded from our StatsWales web pages.

Comparison between WIMD 2019 and WIMD 2025

One of the police recorded crime indicators from WIMD 2019 has been split into four separate indicators, and there have been several other methodological changes for the domain. Therefore it is not directly comparable with that for WIMD 2019. For full information on how the domain has changed since 2019 see the technical report.

Table 8.1: movement between community safety deprivation group between WIMD 2019 and 2025
WIMD 
deprivation 
group
10% 
most 
deprived 
2025
10% to 20% most 
deprived 
2025
20% to 30% most 
deprived 
2025
30% to 50% most 
deprived 
2025
50% 
least 
deprived 
2025
10% 
most 
deprived 
2019
61%19%5%10%5%
10% to 20% 
most 
deprived 
2019
21%33%18%18%9%
20% to 30% 
most 
deprived 
2019
12%23%29%29%7%
30% to 50% 
most 
deprived 
2019
3%11%19%36%30%
50% 
least 
deprived 
2019
0%1%2%14%84%

The table shows the percentage of small areas (LSOAs) in each deprivation group for WIMD 2019 that have stayed or moved group in WIMD 2025. For an explanation of how we have treated the minority of areas that changed boundary, please see the guidance report.

The diagonal, top left to bottom right, shows the percentage of areas which have remained in the same deprivation group. Above the diagonal are percentages of areas which have moved from a more to a less deprived group. Below the diagonal are the percentages of areas which have moved from a less to a more deprived group.

The table shows that:

  • most LSOAs in the most deprived and least deprived deprivation groups remained in the same group between 2019 and 2025
  • of the 10% most deprived areas in 2019, 61% remained in that group in 2025
  • of the 50% least deprived areas in 2019, 84% remained in that group in 2025

Only 62 LSOAs moved by more than two deprivation groups. The below focusses on areas that have moved most in or out of the more deprived groups.

Relatively more deprived

Five areas moved from the 50% least deprived in WIMD 2019 to the 10% to 20% most deprived in WIMD 2025, 2 were in Monmouthshire, 2 in Rhondda Cynon Taf and one in Ceredigion

Relatively less deprived

Of the areas in the 10% most deprived group in WIMD 2019, 10 have moved to the 50% least deprived group in WIMD 2025, located in Newport, Cardiff, Wrexham, Neath Port Talbot and Swansea. These areas had some of the largest non-resident workplace populations which are now included in the denominators of police recorded crime rates.

Local authority analysis

Figure 8.3: box plot of WIMD 2025 community safety domain ranks, by local authority

Image

Description of figure 8.3: the chart shows the spread of community safety domain ranks for each local authority. The blue boxes contain half the total number of small areas (LSOAs) in each local authority, centred on the median (middle) rank for each local authority and the ‘whiskers’ show the full range of ranks within each local authority. Deprivation increases with decreasing rank (that is, towards the left-hand side of the plot). 

The spread of community safety domain ranks is greatest in Swansea and Cardiff and narrowest in Merthyr Tydfil and Blaenau Gwent. Powys has the highest median rank (less deprived) and Blaenau Gwent has the lowest (more deprived).

Concentrations of community safety deprived areas, by local authority

One way of considering WIMD data at the local authority level is to look at the proportion of areas within the local authority that are in the most deprived 10% (or 20% etc) of all areas in Wales. This method can be seen as identifying the concentration of the most deprived areas in a local authority, rather than an average level of deprivation.

The WIMD 2025 community safety domain results show that:

  • the local authority with the highest proportion of areas in the most deprived 10% in Wales was Blaenau Gwent (28% or 13 areas) followed by Newport (23%) and Torfaen (20%)
  • after Monmouthshire (which had no small areas in the most deprived 10% in Wales) the Vale of Glamorgan and Rhondda Cynon Taf had the smallest proportion of LSOAs in this deprivation group (each with 4% of LSOAs in their areas)
  • Powys and Ceredigion were the local authorities with the lowest concentrations of areas in the most deprived 50% of Wales, at 27% and 31% respectively
  • Blaenau Gwent and Caerphilly had the highest percentage of areas in the most deprived 50% in Wales, at 91% and 74% respectively

Concentrations of WIMD 2025 community safety deprived areas, by local authority on StatsWales.

Related information

Police recorded crime

Since the publication of WIMD 2019, there has continued to be a focus on the quality of crime recording by the police. This follows the inspections of forces by Her Majesty’s Inspectorate of Constabulary (HMIC), the Public Administration Select Committee (PASC) inquiry into crime statistics and the UK Statistics Authority’s (UKSA) decision to remove the National Statistics designation from police recorded crime statistics. More recently the UKSA conducted another quality review and ONS have published an action plan as first steps towards reaccreditation.

It is thought the focus on quality has led to improved compliance with the National Crime Recording Standard (NCRS), leading to the recording of a greater proportion of crimes coming to the attention of the police. It was considered and agreed by the community safety domain group that police recorded crime data remained the best source of crime data available for WIMD 2025 at the small area level.

Crime Survey for England and Wales

The Crime Survey for England and Wales measures the extent of crime by asking people whether they have experienced any crime in the past year. The Crime Survey records crimes that may not have been reported to the police and it is therefore used alongside the police recorded crime figures to show a more accurate picture of the level of crime in the country. 

An additional element that the Crime Survey provides is information on perceptions of crime and anti-social behaviour. This is a key element of community safety deprivation, in terms of feeling safe whilst out and about in your local area. Data and further information on the Crime Survey for England and Wales can be found on the Office for National Statistics' website. These data are not included in WIMD 2025, as the data are not statistically robust below a Wales level. 

National Survey for Wales

The National Survey for Wales asks about feeling unsafe after dark in your local area. Perceptions of safety are included in the definition of community safety deprivation. Further information and data can be found on our website.

Physical environment domain results

Introduction

The purpose of this domain is to measure factors in the local area that may impact on the wellbeing or quality of life of those living in an area. The domain has a relative weight of 5% in the overall index.

Indicators

Figure 9.1: physical environment domain indicators, WIMD 2025

Image

Description of figure 9.1: diagram showing that the physical environment domain has 7 indicators. The indicators are grouped into 4 sub-domains and equally weighted within them. The percentage shown next to each sub-domain is the amount it contributes to the overall domain. 

Air quality indicators (35%)

The air quality sub-domain comprises 3 equally weighted indicators which measure the population weighted average concentration values of the key pollutants Nitrogen dioxide (NO2), particulates less than 10 micrometres (PM10) and particulates less than 2.5 micrometres (PM2.5) respectively. Data relate to 2023. 

Indicator of flood risk (35%)

The flood risk sub-domain score is based on the proportion of households at risk of flooding from rivers, the sea or surface flooding but it does not account for flood defences. Data relate to 2025.

Indicators that capture access and amount of green space (15%)

The green space sub-domain is comprised of 2 equally weighted indicators: 

  • proximity to accessible natural green space indicator which measures the proportion of households in each area that are within 300 metres (an approximate 5 minute walk) of an accessible, natural green space (data relate to 2025)
  • ambient green space score which measures the ambient greenness of an area using the mean household Normalised Difference Vegetation Index (NDVI) score within a 300 metre buffer around each residential dwelling (data relate to 2024)

Indicator that captures exposure to noise pollution (15%)

The noise pollution sub-domain score is based on the proportion of the population exposed to noise pollution from road and rail sources greater than or equal to 55 decibels. This is a new indicator for WIMD 2025. Data relate to 2021.

Full details on the indicator and construction of the domain is available in the WIMD 2025 technical report.

Main points

Figure 9.2: map of LSOAs shaded by physical environment deprivation group, WIMD 2025

Image

© Crown copyright 2025. Cartographics. Welsh Government.

Description of figure 9.2: the map shows that in the WIMD 2025 physical environment domain, there were clusters of high physical environment deprivation in and around the large cities in South East Wales and to a lesser extent, the North East and South Wales valleys. There were also some isolated areas of high physical environment deprivation across West Wales.

  • For the physical environment domain, the most deprived area in Wales was Cathays 12, Cardiff (around Central Cardiff and Cathays Park), this was ranked 13th most deprived in 2019.
  • Three of the 10 most deprived areas in WIMD 2025 were also in the 10 most deprived areas in WIMD 2019.
  • Eight of the 10 most deprived areas are in Cardiff, the other 2 are in Newport and Neath Port Talbot. All 10 are urban areas.
  • The local authority with the highest proportion of areas in the most deprived 10% was Cardiff (39%), followed by Newport (28%) and Neath Port Talbot (21%).
  • Isle of Anglesey, Wrexham and Pembrokeshire local authorities had no LSOAs in the most deprived 10% of areas.

There have been some changes in the patterns of physical environment deprivation seen in WIMD 2025 compared to those seen in WIMD 2019. This is to be expected given the inclusion of the new indicator on noise pollution and methodology change in the ambient green space indicator.

The full set of domain ranks from WIMD 2025 and the underlying indicators can be downloaded from the Welsh Government’s StatsWales web pages.

Comparison between WIMD 2019 and WIMD 2025

There have been several methodological changes to the physical environment domain between WIMD 2019 and WIMD 2025, including a new indicator for noise pollution. Therefore, it is not directly comparable with that for WIMD 2019. For full information on how the domain has changed since 2019 see the technical report.

Table 9.1: movement between physical environment deprivation group between WIMD 2019 and 2025

WIMD 
deprivation 
group
10% 
most 
deprived 
2025
10% to 20% most 
deprived 
2025
20% to 30% most 
deprived 
2025
30% to 50% most 
deprived 
2025
50% 
least 
deprived 
2025
10% 
most 
deprived 
2019
68%23%6%3%2%
10% to 20% 
most 
deprived 
2019
22%36%20%17%5%
20% to 30% 
most 
deprived 
2019
4%23%26%31%15%
30% to 50% 
most 
deprived 
2019
1%4%14%35%46%
50% 
least 
deprived 
2019
0%2%4%16%78%

The table shows the percentage of small areas (LSOAs) in each deprivation group for WIMD 2019 that have stayed or moved group in WIMD 2025. For an explanation of how we have treated the minority of areas that changed boundary, please see the guidance report.

The diagonal (top left to bottom right) shows the percentage of areas which have remained in the same deprivation group. Above the diagonal are percentages of areas which have moved from a more to a less deprived group. Below the diagonal are the percentages of areas which have moved from a less to a more deprived group.

The table shows that:

  • most LSOAs in the most deprived and least deprived deprivation groups remained in the same group between 2019 and 2025
  • of the 10% most deprived areas in 2019, 68% remained in that group in 2025
  • of the 50% least deprived areas in 2019, 78% remained in that group in 2025

Only 39 areas (2%) moved by more than 2 deprivation groups in either direction. Below we focus on the areas that have moved most in or out of the most deprived group.

Relatively more deprived 

Four areas have moved from the 50% least deprived group in WIMD 2019 to the 10% most deprived in WIMD 2025 (note that this does not appear in the above table due to rounding), these were areas in Gwynedd, Denbighshire and 2 in Ceredigion.

Relatively less deprived

Three areas moved from the 10% most deprived group in WIMD 2019 to the 50% least deprived group in WIMD 2025, these were areas in Swansea, Carmarthenshire and Rhondda Cynon Taf.

Flood risk was a key driver of large changes in relative physical environment deprivation for each of those seven areas, whether becoming more or less deprived.

Local authority analysis

Figure 9.3: box plot of WIMD 2025 physical environment domain ranks, by local authority

Image

Description of figure 9.3: the chart shows the spread of physical environment domain ranks for each local authority. The blue boxes contain half the total number of small areas (LSOAs) in each local authority, centred on the median (middle) rank for each local authority and the ‘whiskers’ show the full range of ranks within the local authority.  Deprivation increases with decreasing rank (that is, towards the left-hand side of the plot). 

The spread (inter-quartile range) of physical environment domain ranks is greatest in Merthyr Tydfil and Neath Port Talbot and narrowest in Cardiff, Pembrokeshire and Newport. Pembrokeshire and Isle of Anglesey have the highest median rank (less deprived) and Cardiff and Newport have the lowest (more deprived).

Concentrations of physical environment deprived areas, by local authority

One way of considering WIMD data at the local authority level is to look at the proportion of areas within the local authority that are in the most deprived 10% (or 20% etc) of all areas in Wales. This method can be seen as identifying the concentration of the most deprived areas in a local authority, rather than an average level of deprivation.

The WIMD 2025 physical environment domain results show that:

  • the local authority with the highest proportion of areas in the most deprived 10% in Wales was Cardiff (39%) followed by Newport (28%)
  • Isle of Anglesey, Wrexham and Pembrokeshire local authorities had no LSOAs in the most deprived 10% of areas
  • Powys, Monmouthshire and Denbighshire all only have one LSOA in the most deprived 10% of areas
  • Pembrokeshire and Isle of Anglesey were also the local authorities with the lowest concentrations of areas in the most deprived half of Wales, at 8% and 17% respectively
  • Cardiff and Newport had the highest percentage of areas in the most deprived 50% in Wales, at 94% and 89% respectively

Concentrations of WIMD 2025 physical environment deprived areas, by local authority on StatsWales.

Other relevant sources

Air quality

Further information on the UK Government’s Pollution Climate Mapping (PCM) model which calculates average pollutant concentrations for each square kilometre of the UK can be found on the Department for Environment, Food & Rural Affairs (DEFRA) website. Information on national well-being indicator 5 (Levels of Nitrogen Dioxide pollution in the air) can be found on the Welsh Government Well-being of Wales website.

Flood risk

A range of reports, evidence and data on flooding can be found on the Natural Resources Wales (NRW) website.

Green space

Data on people’s perceptions of and satisfaction with local green space is collected as part of the National Survey for Wales. Headline results can be found in the National Survey for Wales Results Viewer.

A Green Space Index including data for Wales has been published by Fields in Trust.

Noise pollution

Data on people’s satisfaction with traffic noise levels in their local area (2018-19) and whether they have been regularly bothered by noise from outside their home (2021-22) was collected as part of the National Survey for Wales. 

NRW collaborated with Land Use Consultants (LUC) to develop the Tranquillity & Place resource which identifies tranquil places in Wales. Theme 4 of this resource analyses sound environments including road, railway and other sources of sound. Theme 4 results can be found on the Tranquillity and Place storymap.

Background information

Development

User engagement

We will continue to share information with users about WIMD 2025 via our website and emails to subscribers, please contact us at stats.inclusion@gov.wales if you want to subscribe.

Quality information

Official statistics status

Official statistics are sources that have been published by government statisticians, or by other public bodies, under the Code of Practice for Statistics.

The UK Statistics Authority has designated WIMD as an accredited official statistic. This means it has been independently assessed as meeting the highest standards of trustworthiness, quality, and value.

Although not all of the data sources used for WIMD’s 54 indicators are from official statistics, the report itself has been developed and published in accordance with the Code of Practice for Statistics (UK Statistics Authority).

These statistics last underwent a full assessment against the Code of Practice in 2010 (Office for Statistics Regulation, OSR) and a compliance check in 2020 (OSR). 

Statement of compliance with the Code of Practice for Statistics

Our statistical practice is regulated by the OSR. OSR sets the standards of trustworthiness, quality and value in the Code of Practice for Statistics that all producers of official statistics should adhere to.

All of our statistics are produced and published in accordance with a number of statements and protocols to enhance trustworthiness, quality and value. These are set out in our Statement of Compliance.

These accredited official statistics demonstrate the standards expected around trustworthiness, quality and public value in the following ways. 

Trustworthiness

These statistics are compiled by professional analysts and statisticians who work under the supervision of our Chief Statistician to ensure that the statistics, data and explanatory material are presented impartially and objectively and are in accordance with the requirements of the Data Protection Act 2018.

Our proposals summary report outlines the rationale behind the choice of indicators to reflect different aspects of deprivation.

Quality

The published figures provided are compiled by professional analysts using the latest available data and applying methods using their professional judgement and analytical skillset. This included careful and independent validation of all elements of the compiling and drafting process by our statisticians. 

Statistics published by us adhere to the Statistical Quality Management Strategy which supplements the Quality pillar of the Code of Practice for Statistics and the European Statistical System principles of quality for statistical outputs.

Accuracy

WIMD 2025 follows on from the previous iterations of the index and has been designed to ensure the reliability of results. Our proposals report includes a list of the indicator criteria. WIMD 2025 brings together 54 indicators from a wide range of data sources (some official or accredited statistics, others based on administrative datasets) which ensures robustness of the overall results. 

Areas that are very deprived according to WIMD are likely to be very deprived on several of the domains. Due to the variety of data inputs, there is little chance that an area is identified as very deprived due to a bias in any one of the underlying indicators. 

In terms of the accuracy of the processing of the data, the quality assurance plan for WIMD 2025 included several stages of data checks such as:

  • replicating results for any new or changed indicators with different analysis tools
  • expert assurance of data with the domain groups of topic experts, and local authority representatives 
Timeliness 

We used the latest available information for all indicators at the time of data processing (October 2025). 

Some of our indicators use the Office for National Statistics (ONS) Small Area Population Estimates (SAPE) in the denominators. We used the SAPE data published in November 2024 (estimates up to mid-2022) which was available for the WIMD 2025 data processing period in October 2025. Since then, the ONS have published updates and revisions to some of this data on 7 November 2025. We have looked at this and assessed the impact of changes at small area level to be small. 

The list of indicators below and our technical report describe the reference period for each indicator.

Comparability 

Our guidance report provides further information about indices of deprivation for the other three countries of the UK, and why results should not be compared across countries.

Value

In publishing this data, we aim to provide evidence for ministers, policy makers and external stakeholders on deprivation, and to inform the wider public.

This report has been produced as an online report to improve the accessibility, responsiveness, and user experience.

Most data underlying the report, and more detailed breakdowns, are available on StatsWales and through the StatsWales open data services.

We have published results in a range of formats to help different people access and interpret WIMD results. These are signposted in our outputs timetable. 

You are welcome to contact us directly with any comments about how we meet these standards. Alternatively, you can contact OSR by emailing regulation@statistics.gov.uk or via the OSR website.

Well-being of Future Generations Act (WFG)

The Well-being of Future Generations Act 2015 is about improving the social, economic, environmental and cultural wellbeing of Wales. The Act puts in place seven wellbeing goals for Wales. These are for a more equal, prosperous, resilient, healthier and globally responsible Wales, with cohesive communities and a vibrant culture and thriving Welsh language. Under section (10)(1) of the Act, the Welsh Ministers must:

(a) publish indicators (“national indicators”) that must be applied for the purpose of measuring progress towards the achievement of the wellbeing goals 

(b) lay a copy of the national indicators before Senedd Cymru

Under section 10(8) of the Well-being of Future Generations Act, where the Welsh Ministers revise the national indicators, they must as soon as reasonably practicable: 

(a) publish the indicators as revised 

(b) lay a copy of them before the Senedd 

These national indicators were laid before the Senedd in 2021. The indicators laid on 14 December 2021 replace the set laid on 16 March 2016.

WIMD includes one indicator (low birth weight) which is one of the national indicators:

(1) Percentage of live single births with a birth weight of under 2,500g

Several other WIMD indicators are a fairly close match to a national indicator, including:

(4) Levels of nitrogen dioxide (NO2) pollution in the air

(8) Percentage of adults with qualifications at the different levels of the National Qualifications Framework

(18) Percentage of people living in households in income poverty relative to the UK median: measured for children, working age and those of pension age

(32) Number of properties (homes and businesses) at medium or high risk of flooding from rivers and the sea

(33) Percentage of dwellings with adequate energy performance

Information on the indicators, along with narratives for each of the wellbeing goals and associated technical information is available in the Well-being of Wales report.

As a national indicator under the Act they must be referred to in the analyses of local well-being produced by public services boards when they are analysing the state of economic, social, environmental and cultural well-being in their areas. 

The Act states national milestones must be set that “…the Welsh Ministers consider would assist in measuring whether progress is being made towards the achievement of the well-being goals.” In doing so Welsh Ministers must specify how we know that a national milestone has been achieved and the time by which it is to be achieved. 

National milestones are not performance targets for any individual organisation, but are collective measures of success for Wales. 

Further information on the Well-being of Future Generations (Wales) Act 2015.

The statistics included in this release could also provide supporting narrative to the national indicators and be used by public services boards in relation to their local wellbeing assessments and local wellbeing plans.

List of indicators included in WIMD 2025

Indicator descriptions and a summary of reference periods is provided below. Additional details on indicators, including all sources, are provided in the technical report.

Income

  • Percentage of people in income deprivation, March 2024.

Employment

  • Percentage of working age people in employment deprivation, April 2022 to March 2023.

Health

  • Low birth weight, percentage, 2015 to 2024.
  • Children aged 4 to 5 living with obesity, percentage, 5 years combined: 2016/17 (September 2016 to August 2017), 2017/18, 2018/19, 2022/23 and 2023/24.
  • Cancer incidence, rate per 100,000, 2012 to 2021.
  • GP recorded mental health conditions, rate per 100, July 2025.
  • GP recorded chronic conditions, rate per 100, July 2025.
  • Limiting long term illness, rate per 100, 2021.
  • Premature deaths, rate per 100,000, 2015 to 2024.

Education 

  • Key Stage 4 average points score for core subjects, 2-year average based on academic years 2022 to 2023 (2022/23) and 2023/24.
  • Persistent absenteeism rate (per 100) primary, 2-year average based on 2022/23 and 2023/24.
  • Persistent absenteeism rate (per 100) secondary, 2-year average based on 2022/23 and 2023/24.
  • Percentage of Key Stage 4 leavers entering higher education, 4-year average based on pupils who left school between 2016/17 and 2019/20.
  • Percentage of adults aged 25 to 64 with no or low qualifications, 2021.

Access to services

  • Average travel time by public and private transport to a food shop, August 2025.
  • Average travel time by public and private transport to a GP surgery, June 2025.
  • Average travel time by public and private transport to a sports facility, September 2025.
  • Average travel time by public and private transport to a secondary school, March 2025.
  • Average travel time by public and private transport to a pharmacy, March 2025.
  • Average travel time by public and private transport to a post office, December 2024.
  • Average travel time by public and private transport to a primary school, March 2025.
  • Average travel time by public and private transport to a public library, March 2025.
  • Average travel time by public and private transport to childcare services, June 2025.
  • Average travel time by private transport to a petrol station, August 2025.
  • Access to digital services (percentage unavailability of broadband at 30Mb/s), Spring 2025.

Housing

  • Percentage of overcrowded households (bedroom measure), 2021.
  • Likelihood of poor quality housing (being in disrepair or containing serious hazards), 2023.
  • Inability to afford to enter owner occupation or the private rental market (score), 2023.
  • Energy efficiency of dwellings (average score), 2012 to 2024.

Community safety

  • Police recorded crime, burglary (rate per 100 properties), 6 financial years, April 2018 to March 2019 (2018-19) to 2023-24.
  • Police recorded crime, criminal damage (rate per 100), 6 financial years 2018-19 to 2023-24.
  • Police recorded crime, theft (rate per 100), 6 financial years 2018-19 to 2023-24.
  • Police recorded crime, violence without injury (rate per 100), 6 financial years 2018-19 to 2023-24.
  • Police recorded crime, violence with injury (rate per 100), 6 financial years, 2018-19 to 2023-24.
  • Police recorded crime, stalking and harassment (rate per 100), 6 financial years 2018-19 to 2023-24.
  • Police recorded crime, public order offences (rate per 100), 6 financial years 2018-19 to 2023-24.
  • Police recorded anti-social behaviour incidents (rate per 100), two financial years 2022-23 and 2023-24.
  • Fire incidences (rate per 100), three financial years 2021-22 to 2023-24.

Physical environment

  • Population weighted average concentration values of Nitrogen dioxide (NO2), 2023.
  • Population weighted average concentration values of particulates < 10 µm (PM10), 2023.
  • Population weighted average concentration values of particulates < 2.5 µm (PM2.5), 2023.
  • Proximity to accessible, natural green space (percentage of households within 300m), 2025.
  • Ambient green space score (mean household Normalised Difference Vegetation Index or NDVI), 2024.
  • Households at risk of flooding score, 2025.
  • Percentage of population exposed to noise pollution, 2021.