
Outlines important technical information for the Welsh Index of Multiple Deprivation (WIMD) results report.

First published: 11 December 2025
Last updated: 11 December 2025

Introduction

Background

The Welsh Index of Multiple Deprivation (WIMD) is the official measure of relative deprivation for small areas in Wales. It identifies areas with the highest concentrations of several different types of deprivation. WIMD ranks all small areas in Wales from 1 (most deprived) to 1,917 (least deprived). It is an accredited official statistic produced by statisticians at the Welsh Government, working under the Code of Practice for Statistics.

WIMD is calculated from 8 different domains (or types) of deprivation, each compiled from a range of different indicators. This technical report describes how WIMD 2025 was constructed and contains a full list of indicators and information about the indicators. Our WIMD guidance document provides more information on the definition of deprivation, how to interpret and use WIMD. Our WIMD results report also provides examples of applications of WIMD.

How WIMD is constructed

There are 3 main components of the index: 

  • the 54 underlying indicator datasets
  • ranks for the 8 separate domains (or types) of deprivation, created by combining relevant indicators within each domain
  • overall WIMD ranks, created by combining the domain ranks 

All these components are calculated for each of the small areas (Lower layer Super Output Areas or LSOAs) in Wales and published. A full list of the indicators can be found in the results report. 

The way the indicators and domains are combined is designed to reliably distinguish between areas at the most deprived end of the distribution, but not at the least deprived end. This means that differences between the least deprived areas in Wales are less well defined than differences between the more deprived areas.

Changes for WIMD 2025

The methodology is broadly the same as for previous indices, with the same 8 domains or types of deprivation captured. However, some new datasets, methodologies and geographies have been used to produce WIMD 2025, meaning outputs are not directly comparable to previous indices. 

Details of changes to indicators and methodologies are provided in this technical report, and a summary of changes is available in the results report. 

Indicators

The domains are built up from sets of indicators. These are measurable quantities which capture the concept of deprivation for each domain (e.g. the percentage of working age people in receipt of employment-related benefits for the employment domain, and a measure of educational attainment (KS4 average points score) in the education domain). 

All WIMD 2025 indicators have to meet the same criteria as for WIMD 2019 and its predecessors, as listed in the report on our proposed indicators. Indicators must be robust at the small area level and consistent across Wales. In practice, this means that the index is based largely on administrative data, with a limited number of census or modelled variables where appropriate administrative data are not available.

Weightings for indicators within domains are derived in several different ways, summarised as follows and explained in detail in each domain technical report chapter: 

  • for income and employment domains, only one composite indicator exists therefore no weighting is required within the domain
  • for the housing, physical environment and access to services domains, indicators are grouped into 2 or more sub-domains, then the sub-domain ranks are exponentially transformed (see annex 1.1), before being combined in a weighted sum
  • for the education, health, access to services (physical access sub-domain) and community safety domains, the statistical technique of factor analysis is used to calculate factor weights for the indicators (see annex 1.2)

As well as ranks for the overall domains, we will publish ranks for each sub-domain on StatsWales. Some of our indicators use the ONS Small Area Population Estimates (SAPE) in the denominators. We used the SAPE data published in November 2024 (estimates up to mid- 2022) which was available for the WIMD 2025 data processing period in October 2025. Since then, the ONS have published updates and revisions to some of this data on 7 November 2025. We have looked at this and assessed the impact of changes at small area level to be small. 

Domain scores

The overall index and domain ranks are the main output for WIMD. As part of the process for calculating WIMD ranks, deprivation scores (domain and overall) are produced, see the guidance report for further advice on interpreting scores. 

The individual domain ranks, calculated by ranking the weighted sum of domain indicators, are then exponentially transformed (see annex 1.1) to produce domain scores. Areas have scores (transformed ranks) ranging between 0 (least deprived) and 100 (most deprived) on each domain. The scores increase exponentially so that the most deprived areas have more prominence. This reduces the extent to which deprivation in some domains can be cancelled by lack of deprivation in others.

The sets of domain scores are then weighted according to the respective domain weight and added together to produce the overall WIMD score, which is, in turn, ranked to provide the overall WIMD ranks. 

Domain weights

Domain weights control the relative contribution of each domain to overall deprivation. Their values are based upon expert advice and the quality of the indicators available. If a domain has a higher weight, changes in that domain will have a bigger impact on the overall index. 

Table 1: domain weights for WIMD 2025 alongside the weights used in 2019
WIMD domainWIMD 2025 domain weightWIMD 2019 domain weight
Income22%22%
Employment20%22%
Health15%15%
Education14%14%
Access to services10%10%
Housing9%7%
Community safety5%5%
Physical environment5%5%

The addition of 2 new indicators in the housing domain has led to a small increase in its weight from 7% to 9%. To allow for this, the weight for the employment domain has been reduced slightly from 22% to 20%, but this remains the second highest weighted domain because it is a strong determinant of deprivation.

WIMD geographies

Super output areas

Following the 2001 Census, the ONS developed a geographic hierarchy called Super Output Areas (SOAs). They were designed to improve the reporting of small area statistics in England and Wales. The areas were reviewed, and some changes made, following the 2021 Census (ONS). Where possible, official statistics are published at the SOA geography.

There are three layers of SOA: Lower layer, Middle layer, and Upper layer. This is because disclosure requirements mean that some sets of data can be released for much smaller areas than others. To support a range of potential data requirements, it was decided to create these three SOA layers.

  • A Lower layer SOA (known as an LSOA) must have a minimum population of around 1,000.
  • The mean size of all the LSOAs is around 1,600.
  • LSOAs are built from groups of Census Output Areas (usually between 4 and 6).
  • A Middle layer SOA (MSOA) must have a minimum population of around 5,000.
  • The mean size of all the MSOAs is around 8,200.

Geographic unit for WIMD

The geographic areas used in the calculation of WIMD 2025 are the 1,917 LSOAs in Wales. LSOAs were used as the geographic unit in WIMD 2005, 2008, 2011, 2014 and 2019. The ONS reviewed LSOA boundaries after the release of Census 2021 data, and there are now 1,917 LSOAs instead of the previous 1,909 for WIMD 2019.

Although the overall WIMD ranks are only calculated at LSOA level, we will make deprivation profiles for larger areas (like local authorities, local health boards, MSOAs and Senedd Constituency areas) available on StatsWales. These look at the proportion of small areas within a larger area that are very deprived. Individual indicator data will also be published at a range of geographies on StatsWales. For most domains, indicator data are allocated to an LSOA by the data suppliers as part of the collection process. However, data is provided at a lower geographical level for some indicators in the access to services, education and community safety domains. An explanation of how data were allocated to LSOAs for these domains is provided in annex 1.3.

Acknowledgements

We are grateful for the contributions of many people and organisations who have provided data and advice for WIMD 2025. We especially wish to thank the following for the development work or tailored support they provided: 

  • Building Research Establishment (BRE), who produced an updated version of the poor quality housing indicator
  • Care Inspectorate Wales, who provided location data for childcare providers
  • Caroline Thomas and Mark Corbin, CGI, who developed travel times calculations
  • Department for Education, who provided data for the education domain
  • Deprivation.org, Oxford Consultants for Social Inclusion (OCSI), and the Ministry of Housing, Communities & Local Government, who provided several indicator datasets
  • Digital Health and Care Wales, who provided data on GP-recorded health conditions
  • Noise Consultants Ltd, who produced noise exposure data
  • Office for National Statistics, who provided data for the health domain and population estimates
  • Professor Glen Bramley, Heriot-Watt University, who produced the housing affordability indicator
  • Professor Rich Fry and Oliver Thwaites, Population Data Science, Swansea University, who provided data on ambient greenness
  • Public Health Wales, who provided data from cancer registrations and the Child Measurement Programme
  • Welsh Police Forces, who contributed to the community safety domain

Annex 1.1: exponential transformation of the domain ranks

The exponential transformation of ranks reduces the extent to which deprivation in some domains can be cancelled by lack of deprivation in others. The transformation 'draws out' the ranks of the most deprived areas so that spaces are introduced between areas that reflect the actual distributions, and emphasise the most deprived 'tail' of the distribution.

The precise transformation involved is as follows. For any LSOA, denote its rank on the domain, scaled to the range (0,1], by R (with R=1/1917 for the least deprived, R=1917/1917=1 for the most deprived). The transformed domain score equals:

Image
-23 x log{1 - R x [1- exp(-100/23)]}


where log denotes natural logarithm and exp the exponential or antilog transformation. This formula is straightforward to calculate and simpler than the commonly-used transformation to a normal curve, which requires the use of a look-up table. 

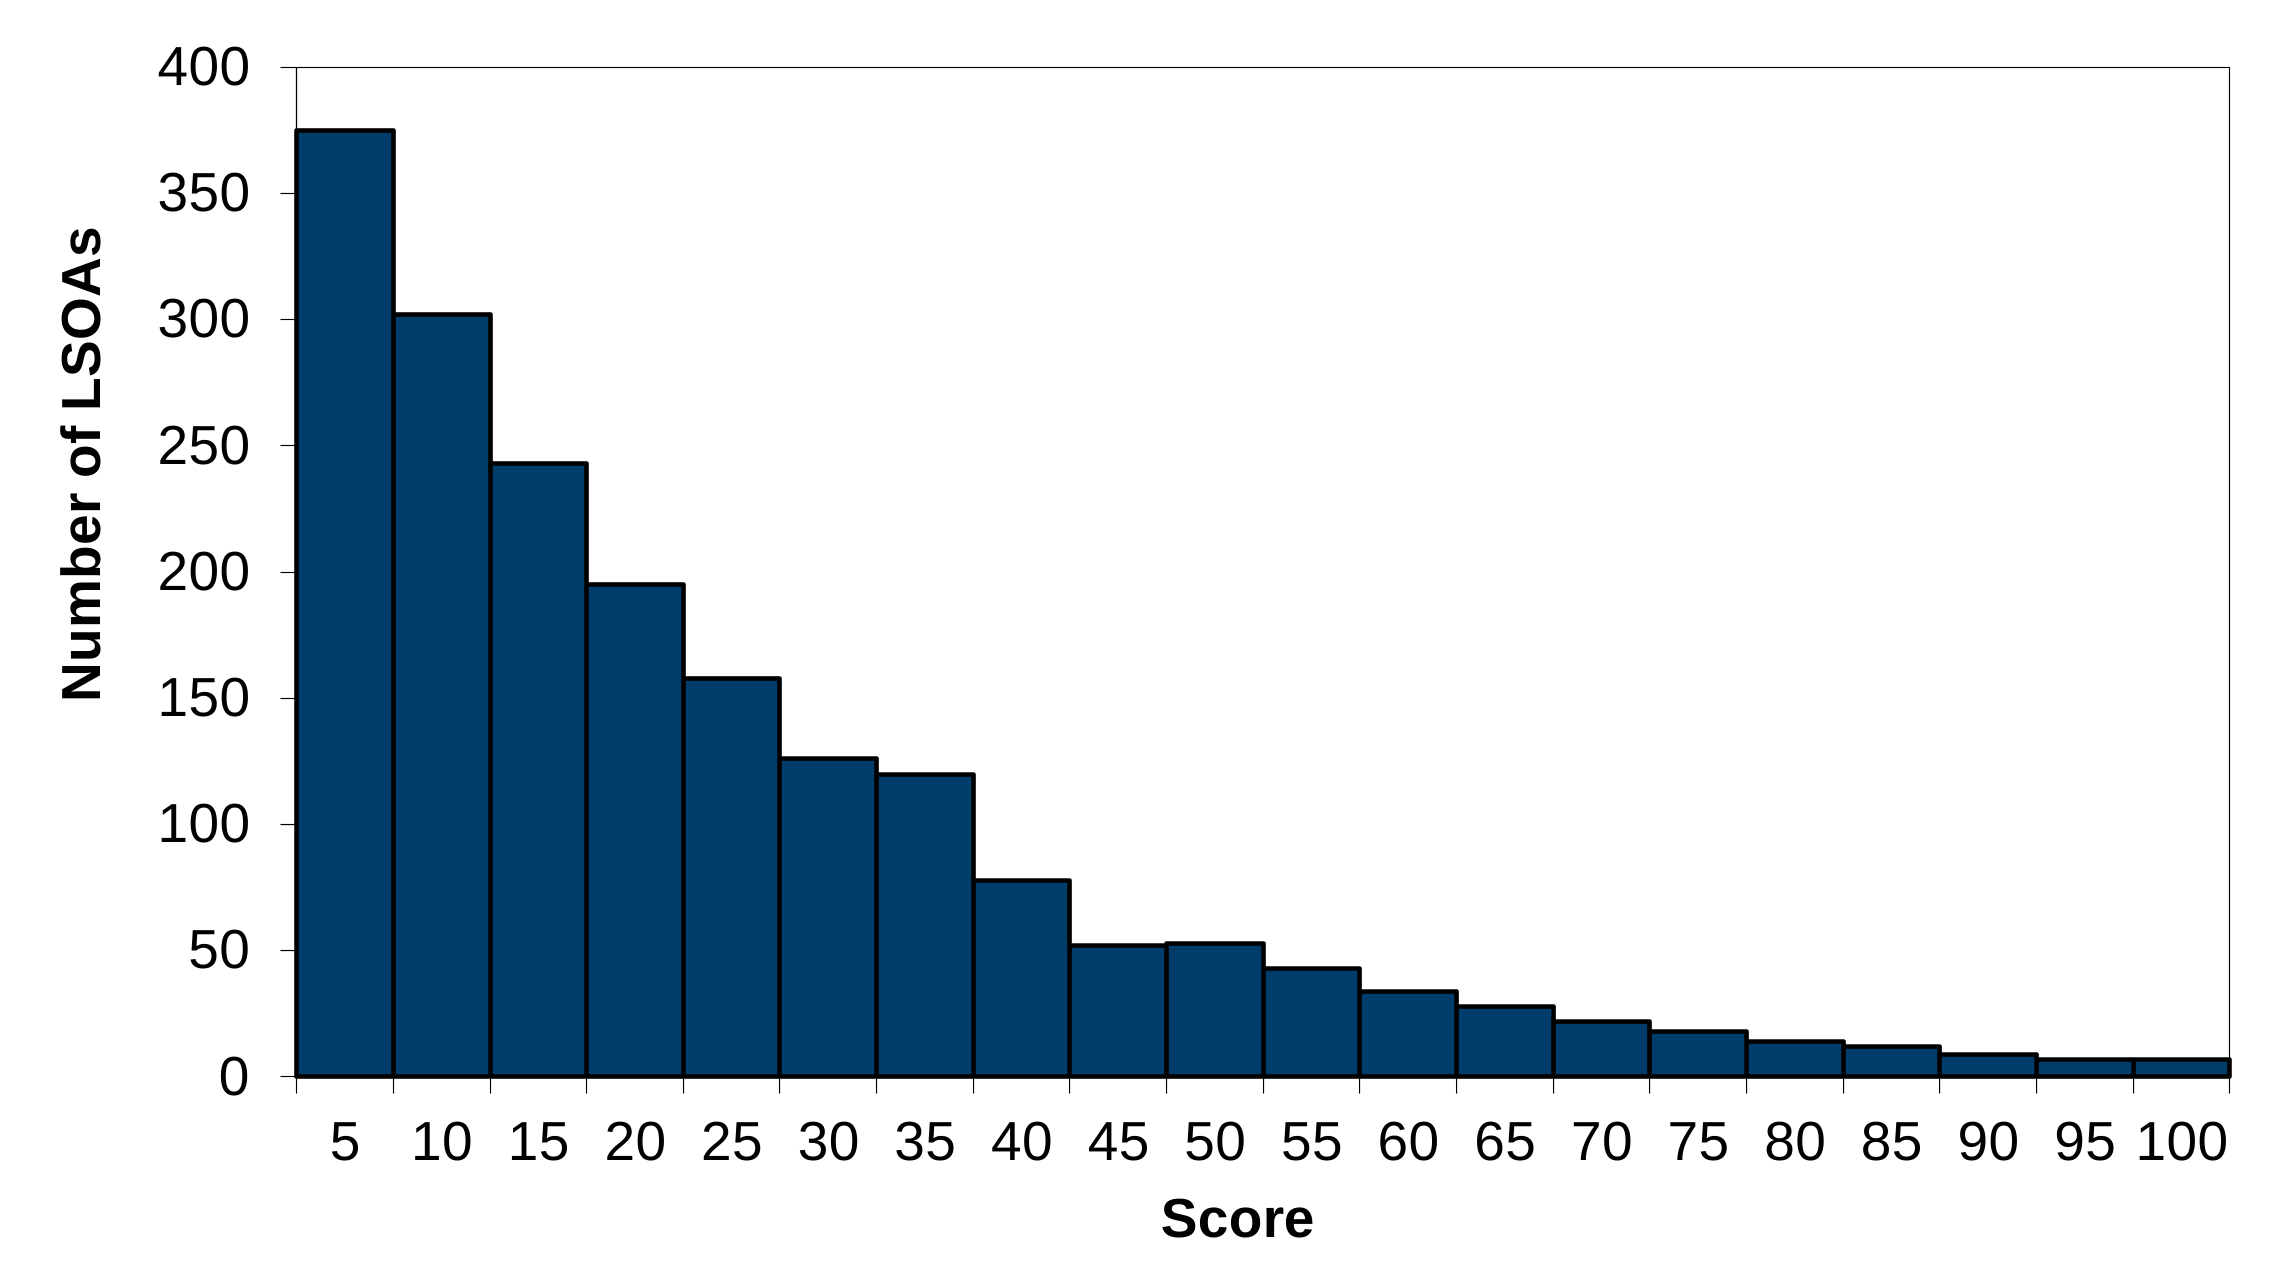
Figure 1.1: histogram of a transformed domain
Image

Description of figure 1.1: this shows the distribution of the transformed ranks, called scores. Each transformed domain has a range of 0 to 100, with a score of 100 for the most deprived LSOA. The least deprived LSOA (R = 1/1917) has a domain score of approximately 0.01. 

The constant -23 gives a 10% cancellation property. This means that 10% of LSOAs have a score higher than 50 (the most deprived), and the remaining 90% of LSOAs have scores between 0 and 50. When transformed scores from different domains are combined by averaging them, the skewness of the distribution reduces the extent to which deprivation in one domain can be cancelled by lack of deprivation in another. For example, if the transformed scores on two domains are simply averaged, with equal weights, a (hypothetical) LSOA that scored 100 on one domain and 0 on the other would have a combined score of 50 and would thus be ranked at the 90th percentile. Averaging the untransformed ranks, or after transformation to a normal distribution, would result in such a LSOA being ranked at the 50th percentile; the high deprivation in one domain would have been fully cancelled by the low deprivation in the other. 

This means the index methodology is designed to reliably distinguish between areas at the most deprived end of the distribution, but differences between the least deprived areas in Wales are less well defined.

As well as being used to combine domain ranks to produce overall index ranks, this transformation is applied to sub-domain ranks to produce domain ranks for the access to services, housing and physical environment domains.

While each LSOA was given a distinct rank for most WIMD 2025 indicators, a small number of indicators had a large number of tied “0-values” at the least deprived tail of the distribution. For example, within the access to services domain there were 955 LSOAs with 0% of properties unable to receive superfast broadband. This pattern was observed in the digital access sub-domain within access to services and the flood risk sub-domain within physical environment. For the purposes of the exponential transformation, these LSOAs were assigned subdomain ranks of 1917 to minimise their contributions to overall domain scores.

Annex 1.2: factor analysis

Factor analysis overview

Factor analysis is a method for assessing the extent to which a set of indicators may be measuring the same underlying construct or factor. The premise behind a one-common-factor model is that the underlying factor is imperfectly measured by each of the indicators in the dataset but that indicators that are most highly correlated with the underlying factor will also be highly correlated with each other. By analysing the correlation between indicators it is therefore possible to make inferences about the common factor and as a result estimate a ‘factor score’ for each LSOA. This score is derived from a set of weights for each of the indicators in the data set that is generated by the process of factor analysis. This factor score can then be used as the domain index. 

Factor analysis has only been applied to four domains: health, education, access to services and community safety. Within the access to services domain, factor analysis is used to calculate weights within the physical access sub-domain. The main reasons why factor analysis has been used are: 

  • the indicators are on different metrics and have different levels of accuracy and so cannot simply be summed
  • to ascertain the factor that underlies the indicators within the domain
  • to help take into account the problem of ‘double counting’ within a domain

In the employment and income domains, we can identify individuals who are or are not deprived in terms of the domain definition. The number of deprived people can then simply be summed and divided by a suitable denominator to create an area rate. 

This is not possible in the other 6 domains, where forms of deprivation tend to present themselves in different ways at different times. For example, an individual is ‘health deprived’ if they die prematurely or are long-term sick. While the long-term sick may be more likely to die prematurely than others, these events do not occur to the same people at the same time. 

Typically, such domains include data on people at different ages and stages. For example, in the education domain, lack of qualifications in the adult population as well as poor results at school level were assessed. 

We hypothesise that there is an underlying factor at the local area level (e.g. health deprivation) that makes these different states likely to exist together in the same area. This underlying factor cannot be measured directly but can be identified through its effects on specific individual measures (e.g. premature death, long-term illness, low birth-weight children etc.). 

We have, therefore, collected several indicators that measure, with different levels of accuracy, the effects of this underlying factor. By looking at the relationship between all these indicators the underlying factor can be identified and quantified. 

Factor analysis also takes some account of the problem of ‘double-counting’ within domains that potentially contain indicators that overlap with each other. For example, in the health domain, it is possible for an individual to have had cancer and be included in the limiting long-term illness indicator. Combining data using other methods such as ‘z scores’ more directly double-weights these cases by taking them all into account. Factor analysis, however, takes some account of this overlap because an indicator may have a lower weight if the contribution it makes has already been taken into account. 

Maximum likelihood estimation 

WIMD 2025 follows the methodology of recent iterations and that applied by Oxford University for WIMD 2000, as well as the indices for the other 3 UK countries. 

Maximum Likelihood (ML) Factor Analysis was chosen as the method of estimation because it is: 

  • scale-invariant (unlike Principal Factoring)
  • accounts for measurement error (unlike Principal Components Analysis)
  • treats data as sampled from a super-population, which is consistent with project assumptions

Communality

This is the proportion of a variable's variance explained by a factor structure. A variable's communality must be estimated prior to performing a factor analysis. A communality does not have to be estimated prior to performing a principal component analysis. Communality estimates are estimates of the proportion of common variance in a variable. Prior communality estimates are those which are estimated prior to the factor analysis. Common methods of prior communality estimation include: 

  • an independent reliability estimate
  • the squared multiple correlation between each variable and the other variables
  • the highest off-diagonal correlation for each variable
  • iteration by performing a sequence of factor analyses using the final communality estimates from one analysis as prior communality estimates for the next analysis 

Final communality estimates are the sum of squared loadings for a variable in an orthogonal factor matrix. 

The default setting for communality prior estimates, Square Multiple Correlation, was used for WIMD 2025 calculations.

Calculation process

The indicators were first transformed to the standard normal distribution. The transformed indicators were then entered into a ‘one common factor Maximum Likelihood factor analysis’ using the fa function from the R package Psych (Rdocumentation.org). 

The weights component of the resultant factor analysis was extracted and used to produce the domain scores for the community safety, education, and health domains and the physical access sub-domain score within the access to services domain.

Annex 1.3: allocation of data to Lower layer Super Output Areas (LSOAs)

For most domains, indicator data are allocated to LSOAs by the data suppliers as part of the collection process. However, data is provided at a lower geographical level for some indicators in the access to services domain and for most indicators in the education and community safety domains. An explanation of how indicator data in these domains were allocated to LSOAs is provided below.

Education domain

Except for the indicator on adults with no or low qualifications all new and updated indicator data in the education domain was provided at the postcode level. As many postcodes do not sit wholly within one LSOA, a method of apportioning postcode-level data to multiple LSOAs was used. 

In this apportionment method, data are weighted by the proportion of the dwellings in a postcode that sit within each intersecting LSOA. It is assumed that the proportions of dwellings in each intersecting LSOA will be broadly equivalent to the proportions of the postcode population living in each intersecting LSOA. Finally, where postcodes do sit wholly within one LSOA, data are given a weighting of 1. 

To apply this method, a postcode-to-LSOA lookup (with calculated dwelling weights) was developed by the Welsh Government Data and Geography team and initially used to match as many postcodes to LSOAs as possible.

Any non-matched postcodes were then subsequently matched using an ONS lookup that assigned postcodes to LSOAs based on the nearest geographical centre of an LSOA. This lookup was not weighted so a default weight of 1 was assigned to all matched data. 

Any data still unmatched at this point was excluded from indicator calculations.

Access to services domain

Service point location information (such as for schools, post offices) used in the travel time indicators were geocoded and allocated to LSOAs using a Graphic Information System (GIS). 

Ofcom data on ability to receive superfast broadband is publicly available at Output Area (OA) level from Ofcom’s Connected Nations reports. The spring 2025 dataset was aggregated to LSOA using an ONS geography lookup.

Community safety domain

Data on recorded crimes and incidents of anti-social behaviour were made available at microdata level by the four police forces in Wales. These datasets included information on the geographical location of occurrence (postcode and/or grid reference) which were assigned to LSOAs using a spatial smoothing method. Specifically, a 10m buffer was drawn around a crime/incident location and that crime/incident was shared equally by all LSOAs intersecting with the 10m buffer. This process was undertaken separately for every crime and incident record in the base microdata to account for known issues with the police data geocoding.

Data on the grid references of fire incidents were sourced from the Incident Recording System (IRS) and mapped to LSOAs by the Welsh Government Data and geography team.
Income domain

The purpose of this domain is to measure the proportion of people experiencing deprivation relating to low income. The income domain has a relative weight of 22% in the overall WIMD 2025 index.

Indicators

The income domain has one indicator made up of several components, a cross-sectional snapshot of people in receipt of income-related benefits and tax credits and supported asylum seekers.

It involves non-overlapping counts of means-tested claimants: both those that are out-of-work, and those that are in work but who have low income. The summed counts are then expressed as a percentage of the estimated total population for the LSOA.

Percentage of people in income deprivation

Type of indicator

Percentage

Numerator

The domain numerator captures the following categories of claimant, their dependent partners and children, as of end March 2024: 

  • ‘Legacy’ out-of-work means-tested benefits
    • income support
    • income-based Jobseeker’s Allowance
    • income-related Employment and Support Allowance
  • Pension Credit (Guarantee)
  • Universal Credit (UC) ‘out of work’ conditionality groups
    • no work requirements
    • planning for Work
    • preparing for work
    • searching for work
  • UC ‘in work’ conditionality groups, with equivalised income below 70% UK median threshold (after housing costs, AHC)
    • working with requirements
    • working, no requirements
  • Housing Benefit, with estimated equivalised income below a 70% UK median threshold (AHC)
  • Tax Credit, with estimated equivalised income below a 70% UK median threshold (AHC)
  • Asylum seekers in dispersed accommodation in receipt of support

Denominator

The overall (de-duplicated) count is then expressed as a proportion of the total population of the LSOA. The denominators are the mid-2022 small area population estimates (SAPE) published by the Office for National Statistics (ONS) on 25 November 2024.

Source and time period

  • The Department for Work and Pensions (DWP): income-related benefit claimants, and people on UC as at end March 2024
  • His Majesty’s Revenue and Customs (HMRC): tax credit recipients as at end March 2024
  • Home Office: Supported Asylum Seekers as at March 2024
  • ONS: mid-2022 small area population estimates

The choice of snapshot at end of March 2024 captures the point at which managed migration of Tax Credit-only to UC claimants is complete, but before the migration of Housing Benefit-only to UC claimants.

Additional notes

Using DWP’s Registration and Population Interaction Database (RAPID), Single Housing Benefit Extract (SHBE) and UC monthly database, different groups (certain claimants, their dependent partners and children) are identified according to specific criteria across a range of benefits, ensuring that all relevant individuals are captured for the domain as of the end of March 2024. A full description of the criteria and data sources is included in the English indices of deprivation 2025 technical report (Ministry of Housing, Communities and Local Government, MHCLG), with some further detail below.

The income-deprived population is divided into two groups: out-of-work and in-work benefit units (claimants, along with any partners and dependent children). All out-of-work units are classified as income deprived. Any in-work units with income below a certain threshold are classified as income deprived. The threshold is 70% of median after housing costs (AHC) income, equivalised using the Modified OECD scale, and was derived using Family Resources Survey (FRS) data underpinning the Households Below Average Income (HBAI) publication.

UC ‘in-work’ conditionality groups with equivalised income below 70% UK median threshold (AHC)

These are benefit units in receipt of UC where one or more working age adult is in work, but where the equivalised household income is below the specified threshold. Income was calculated for March 2024 using UC assessment data, including earnings and UC payments but excluding health or caring-related entitlements and disability benefits. Actual housing costs reported to UC were deducted to produce an AHC income figure.

Housing Benefit claimants with estimated equivalised income below 70% UK median threshold (AHC)

This includes Housing Benefit claimants, partners and dependent children who do not receive out-of-work legacy benefits, Pension Credit Guarantee, or UC, and whose equivalised income is below the specified threshold. Income is calculated from employment, self-employment, State Pension, Tax Credit, Child Benefit, Pension Credit Savings Credit, and Housing Benefit, excluding disability benefits and actual housing costs. Housing costs were sourced from the Single Housing Benefit Extract (SHBE).

Tax Credit claimants with estimated equivalised income below 70% UK median threshold (AHC)

This includes Tax Credit claimants, partners and dependent children who do not receive out-of-work legacy benefits, UC or Housing Benefit, and whose equivalised income is below the specified threshold. Income is composed of estimated income from employment, self-employment and Tax Credit, excluding disability benefits and estimated housing costs.

As actual housing costs are not available for Tax Credit benefit units, an imputed value is used. This is calculated by averaging the housing costs of similar UC families (by family type and LSOA), providing a geographically and demographically sensitive estimate.

Asylum seekers in dispersed accommodation in receipt of support

The numerator includes the number of asylum seekers (adults and children) in an LSOA who were in dispersed accommodation and in receipt of any of the following support:

  • Section 95, for those awaiting a decision, providing accommodation and living expenses
  • Section 98, temporary support for those awaiting a Section 95 decision
  • Section 4, for those who have been refused asylum but have not left the UK 

Comparability with WIMD 2019

The income deprivation indicator is not directly comparable with that for WIMD 2019. Some of the reasons for this are:

  • a change in coverage to include those claiming only Housing Benefit below an income threshold
  • a change to the income threshold applied to working families (previously 60% of median before housing costs (BHC)), to better align with DWP deprivation measurement work and to reflect that administrative microdata now enables a direct AHC approach
  • a change in the underlying welfare system with rollout of UC replacing several other benefits (known as legacy benefits) and using different eligibility criteria and thresholds
  • an underlying increase in working age benefit claimants (DWP) during the pandemic that had not returned to the pre-pandemic baseline in this data
  • updated definitions for asylum seekers in dispersed accommodation receiving support
  • prisoners are now included in the denominator, as some benefits (e.g., Housing Benefit or UC housing element) may apply during initial custody periods

For the 2025 indicator, non-claiming partners of claimants were included in numerators, and claimants of both DWP benefits and HMRC tax credits were removed, to avoid double counting. These are both improvements to the previous Welsh income domain, which cancel each other out to some extent. The net impact of these two changes on the absolute and relative positions of small areas within Wales has been found to be very small.

Domain construction

The indicator values are ranked, then ranks exponentially transformed to form domain scores for use in the calculation of WIMD 2025. The domain has a relative weight of 22% in the overall index.

Changes since WIMD 2019

The introduction of UC, and other policy and data developments have had a significant impact on the measurement of the income domain of WIMD. The English indices of deprivation team at the MHCLG have worked with the key data suppliers, DWP, to develop a new income deprivation indicator for small areas that incorporates both UC and legacy benefits. This work has been undertaken both for small areas in England and in Wales.

Previously, for WIMD 2019 reference periods, most UC claimants were single jobseekers, so all UC claimants (except those in the “working no requirements” group) were included without applying an income threshold. Since that time UC has become the default for all new means-tested benefit claims, replacing legacy benefits and Tax Credits. Although full migration to UC is scheduled for March 2026, many claimants remain on legacy benefits, leading to a combined approach for 2025.

For 2025, the population is divided into two groups: out-of-work and in-work benefit units. All out-of-work units are included in the domain, as in previous indices, covering UC and legacy benefits. For in-work units, an income threshold determines inclusion, continuing the approach used previously but with major enhancements.

The new method provides a comprehensive, methodologically robust approach and improves accuracy by reflecting real living conditions. Future indices are expected to build on these improvements, continuing the goal of providing the most robust measure of income deprivation possible.

We have adopted the approach recommended by DWP and MHCLG and support better comparability between indices for different nations of the UK, where appropriate.

Income and housing costs changes

The key change is the shift from before housing costs (BHC) to after housing costs (AHC) for assessing in-work benefit units. This provides a more accurate measure of deprivation by accounting for actual housing costs, which may exceed housing-related benefits, reducing disposable income.

The change was enabled by improved data integration through RAPID, which consolidates UC, legacy benefits, and Tax Credits, and links to the Single Housing Benefit Extract (SHBE) and UC monthly datasets.

These linkages allow reliable calculation of income and housing costs, grouping individuals into benefit units and supporting income equivalisation. For the first time, Housing Benefit families are included in the numerator if their incomes fall below the deprivation threshold. Previously, technical difficulties in avoiding double counting prevented inclusion of this data. The use of RAPID now resolves this.

Additional information

Two additional indicators were created, which are subsets of the income deprivation indicator. These are income deprivation for children (aged 0 to 15) and income deprivation for older people (aged 60 or over).

Employment domain

The purpose of this domain is to measure the proportion of working-age people involuntarily excluded from the labour market. This includes people who may want to work but are unable to do so due to unemployment, sickness or disability, or caring responsibilities. The domain has a relative weight of 20% in the overall index. 

Indicators

The domain has one indicator made up of several components, a cross-sectional snapshot of working age people in receipt of unemployment-related benefits, expressed as a percentage of the estimated population aged 18 to 66 in an LSOA.

Percentage of working age people in receipt of employment-related benefits

Type of indicator

Percentage

Numerator

The numerator is a count of individuals aged 18 to 66, averaged over 12 separate monthly timepoints from April 2022 to March 2023, who were entitled to:

  • Jobseeker’s Allowance (both contribution-based and income-based)
  • New Style Jobseeker’s Allowance
  • Employment and Support Allowance (both contribution-based and income-related)
  • New Style Employment and Support Allowance
  • Incapacity Benefit
  • Severe Disablement Allowance
  • Carer’s Allowance
  • Income Support
  • Universal Credit (UC) claimants in the following conditionality groups:
    • no work requirements
    • planning for work
    • preparing for work
    • searching for work

Denominator

The overall (de-duplicated) count is then expressed as a proportion of the working age population of the LSOA. The denominators are the mid-2022 small area population estimates (SAPE) published by the Office for National Statistics (ONS) on 25 November 2024.

Source and time period

  • Department for Work and Pensions (DWP), April 2022 to March 2023
  • ONS: mid-2022 small area population estimates

Additional notes

A full description of the criteria and data sources is included in the English indices of deprivation 2025 technical report (Ministry of Housing, Communities and Local Government, MHCLG), with some further detail here.

DWP analysts used the Registration and Population Interaction Database (RAPID) to identify the caseload receiving at least one of the benefits listed above at each timepoint, and merged this with the DWP Customer Information System (CIS) to identify the geographic location of the claimant at each timepoint.

To account for seasonal variations in employment deprivation, 12 separate sequential monthly timepoints from April 2022 to March 2023 were taken and the average number of claimants across the 12 monthly cuts calculated.

Comparability with WIMD 2019

The employment deprivation rates are not directly comparable with those for WIMD 2019. Some of the reasons for this are:

  • a change in coverage of the Welsh indicator to include those involuntarily excluded from the labour market due to caring responsibilities (those on carer-related benefits and UC conditionality groups covering carers and parents of young children)
  • a change in the underlying welfare system with rollout of UC replacing several other benefits (known as legacy benefits) and using different eligibility criteria
  • an underlying increase in the number of claimants for health related reasons (DWP), and a sharp increase in unemployment claimants during the pandemic that had not returned to the pre-pandemic baseline in this data
  • a different definition of ‘working age’ as 18 to 66 (it was 16 to 64 for WIMD 2019) to reflect the change in retirement age, and for comparability with England
  • prisoners are now included in the denominator, as some benefits (e.g. UC) may apply during initial custody periods 

Domain construction

The indicator values are ranked, then ranks exponentially transformed to form domain scores for use in the calculation of WIMD 2025. The domain has a relative weight of 20% in the overall index.

Changes since WIMD 2019

The introduction of Universal Credit (UC) has a significant impact on the way WIMD's employment domain is measured.

The main policy change since WIMD 2019 is the expansion of UC, replacing most means-tested benefits except New Style JSA and ESA. Between 2023 and 2026 the remaining legacy benefit claimants are being moved onto UC in a process called Managed Migration. This created challenges for the domain, including:

  • difficulty identifying claimants involuntarily excluded from the labour market (i.e. it’s not easy to directly match legacy benefits to their UC equivalents), which could lead to some UC claimants being missed and others being incorrectly included
  • inconsistent geographic rollout impacting consistency of data
  • complications producing a non-overlapping claimant count because of multiple DWP databases with differing coding structures 

The English indices of deprivation team at the MHCLG have worked with the key data suppliers, DWP, to develop a new employment deprivation indicator for small areas in both England and Wales that incorporates both UC and legacy benefits. 

To mitigate the UC rollout issue, the indicator uses data from April 2022 to March 2023, predating Managed Migration, ensuring more consistent national coverage. 

We have adopted the approach recommended by DWP and MHCLG and support better comparability between indices for different nations of the UK, where appropriate.

The addition of two new indicators in the housing domain has led to a small increase in its weight from 7% to 9%. To allow for this, the weight for the employment domain has been reduced slightly from 22% to 20%, but this remains the second highest weighted domain.

Health domain

The purpose of this domain is to measure lack of good health in all people, and to capture predictors of future health based on deprivation experienced in childhood. Some indicators in this domain are age-sex standardised to account for population differences across small areas. The domain has a relative weight of 15% in the overall index.

Indicators

Limiting long term illness

Type of indicator

Rate per 100, indirectly standardised for the age and sex profile of the population.

Numerator

Number of people with any long-term illness, health problem or disability that limits daily activities or work.

Denominator

All usual residents.

Source and time period

Census 2021, Office for National Statistics (ONS).

Comparability with WIMD 2019

Comparable.

Premature death rate

Type of indicator

Rate per 100,000, indirectly standardised for the age and sex profile of the population.

Numerator

Number of deaths of those under the age of 75.

Denominator

All people under the age of 75.

Source and time period

Numerator: ONS death registrations, 2015 to 2024.

Denominator: Small Area Population Estimates (SAPE), ONS, mid-2013 to 2022

Additional notes

Poor health can manifest itself in lower life expectancy, which can be captured through age and sex standardised death rates.

Comparability with WIMD 2019

Comparable.

Chronic conditions diagnosed by GPs

Type of indicator

Rate per 100, indirectly standardised for the age and sex profile of the population.

Numerator

Number of people with a diagnosis for conditions from a defined list of chronic health conditions (see the additional notes for details).

Denominator

All people.

Source and time period

Numerator: Digital Health and Care Wales (DHCW), 1 July 2025.

Denominator: SAPE mid-2022, ONS; minus prisoner numbers, Ministry of Justice via ONS. 

Additional notes

The numerator was based on counts of people with diagnoses for conditions from a defined list of disease registers and sub-indicators obtained from GP practices in Wales. It measures the number of people with a current diagnosis of one or more of the conditions listed below:

  • Coronary Heart Disease
  • Chronic Obstructive Pulmonary Disease
  • Stroke and Transient Ischaemic Attack
  • Peripheral Arterial Disease
  • Chronic Kidney Disease
  • Diabetes Mellitus (type 1 for all ages, type 2 and other types for people aged 17 and above)
  • Epilepsy

These counts were de-duplicated so that patients with more than one condition were not counted twice. Patient level data was aggregated to small areas, according to patient addresses, so that prevalence is based on where people live rather than where they are registered with a GP. 

See annex 4.1 for more detail on this indicator. 

Comparability with WIMD 2019

Comparable.

Mental health conditions diagnosed by GPs

Type of indicator

Rate per 100, indirectly standardised for the age and sex profile of the population.

Numerator

Number of people with a diagnosis for conditions from a defined list of mental health conditions (see the additional notes for details).

Denominator

All people.

Source and time period

Numerator: Digital Health and Care Wales (DHCW), July 2025.

Denominator: SAPE mid-2022, ONS; minus prisoner numbers, Ministry of Justice via ONS. 

Additional notes

The numerator was based on counts of people with diagnoses from a defined list of disease registers and sub-indicators obtained from GP practices in Wales. It measures the number of people with a current diagnosis of one or more of the conditions listed below:

  • Depression
  • Low mood (patients with record of low mood and an active repeat prescription for an anti-depressant)
  • Anxiety disorder (including panic disorders)
  • Dementia
  • Severe mental illnesses (schizophrenia, bipolar affective disorder and other psychoses)

These counts were de-duplicated so that patients with more than one condition were not counted twice. Patient level data was aggregated to small areas (LSOAs), according to patient addresses, so that prevalence is based on where people live rather than where they are registered with a GP.

See annex 4.1 for more detail on this indicator.

Comparability with WIMD 2019

Comparable.

Cancer incidence

Type of indicator

Rate per 100,000, indirectly standardised for the age and sex profile of the population.

Numerator

Count of all cases of cancer includes all malignancies, excluding non-melanoma skin cancer.

Denominator

All people.

Source and time period

Numerator: Welsh Cancer Intelligence & Surveillance Unit (WCISU), PHW, 2012 to 2021.

Denominator: SAPE, mid-2012 to 2021, ONS.

Comparability with WIMD 2019

Comparable.

Low birth weight

Type of indicator

Percentage.

Numerator

Number of live single births less than 2.5 kg (5.5lb), which is classified as a low birth weight.

Denominator

Number of singleton live births.

Source and time period

ONS birth registrations, 2015 to 2024.

Comparability with WIMD 2019

Comparable.

Children aged 4 to 5 living with obesity

Type of indicator

Percentage.

Numerator

Number of children attending reception class aged 4 to 5 living with obesity.

Denominator

Total number of children attending reception class aged 4 to 5.

Source and time period

Child Measurement Programme (CMP), Public Health Wales (PHW), 2016/17 to 2018/19, combined with 2022/23 to 2023/24 (5 years in total, but see below for explanation of the gap in the middle).

Additional notes

Pupil’s home addresses were used to identify the LSOA in which children live rather than the LSOA of their school. Data for previous years also included in the WIMD 2019 indicator (2016/17 and 2017/18) has been retrospectively updated to allocate 2021 LSOAs to the records.

Obesity is calculated using the age and sex-specific body mass index (BMI) centiles (which includes height information) calculated using the British 1990 growth reference (UK90) (from a method proposed by Cole et al (1995)). Children living with obesity are those who fall in the 95th centile or above.

Due to COVID-19 pandemic impacts on data collection the CMP datasets were not available across all of Wales between 2019/20 and 2021/22. Five years of data were combined to provide robust LSOA level estimates, consisting of three years pre-pandemic and two years post-pandemic data.

The smallest level at which PHW have published CMP data since the pandemic is Primary Care Cluster level. This is because of concerns around the possible misuse of data to identify specific areas where the highest percentage of children living with obesity live and the possibility of identifying individuals when drilling down to small numbers. For these reasons, whilst LSOA level rates are used in the domain and index calculations, we do not publish them as part of WIMD indicator datasets.

Users can access data for MSOAs from PHW with the latest available for 2014/15 to 2018/19 (due to the impact of the pandemic and requirement for 5 years of data). Data for larger geographies including primary care clusters, local authorities and local health boards are available on an annual basis in CMP reports and data (PHW).

Comparability with WIMD 2019

Broadly comparable.

Domain construction

There are 7 indicators in the health domain, weighted as follows. Factor analysis was used to calculate the indicator weights.

  • 32% Limiting long term illness
  • 28% Premature deaths
  • 20% Chronic conditions diagnosed by GPs
  • 8% Mental health conditions diagnosed by GPs
  • 5% Cancer incidence
  • 4% Children aged 4 to 5 with obesity
  • 4%(r) Low birth weight

(r) Revised on 9 September 2026.

The domain has a relative weight of 15% in the overall index.

Indirect standardisation for the age and sex profile of the population was applied to five of the indicators, to adjust for different age and sex distributions between small areas. For example, we should expect to observe a higher rate of deaths in an area with an older population compared to an area of mainly young families. Standardisation attempts to adjust for these differences in population (see annex 4.2).

For every indicator, each area was ranked in order, with the most deprived area ranked 1 and the least deprived area ranked 1,917. These ranks were assigned to a normal distribution, with low ranks receiving a low normalised value. Factor analysis was then used to calculate the indicator weights. As with all domains, the final domain ranks were exponentially transformed, to form domain scores for use in the calculation of the overall WIMD 2025.

Changes since WIMD 2019

There have been some small methodological changes to the health domain between WIMD 2019 and WIMD 2025.

Limiting long term illness

The wording of the Census question was updated between 2011 and 2021 to better align with the social model of disability. However an analysis of the data shows a high degree of correlation between 2011 and 2021 data suggesting this has not significantly changed the nature of the indicator.

Due to suppression of some 2021 Census data at LSOA level the age groups used as part of the indirect standardisation process for this indicator were changed slightly for WIMD 2025.

Chronic conditions and mental health conditions diagnosed by GPs

These indicators are calculated on a similar basis as before. Data for these indicators were drawn together from GP practice systems by DHCW. During 2024 and 2025 some GP practices were migrating data systems, and changes were also being made to the data extraction tool. Although this may have had some impact on data quality in some areas, overall the indicator data trends were found to be well correlated with those for WIMD 2019 so we have no reason to suspect a significant impact.

Additional information

See annex 4.2 for more information on indirect age-sex standardisation applied to some of the health indicators.

COVID-19 pandemic

The data for each indicator has been investigated to assess the impact of the COVID-19 pandemic on trends and data quality. 

The data for one indicator, children with obesity, was interrupted by the pandemic meaning no data for 2019/20 to 2021/22 across the whole of Wales was available.

Limiting long term illness was self-reported during March 2021, just over a year since the pandemic was declared. However data was found to be well correlated with Census 2011 trends used in WIMD 2019.

Two other indicators, cancer incidence and premature deaths, have ten year rolling timespans extending beyond the early phase of the pandemic (ending in 2021 and 2024 respectively). Some longer-term effects of the COVID pandemic are likely to be present in the data (albeit combined with a longer run of pre-pandemic data) and we make no adjustments for this, apart from the standardisation for age and sex profiles described above.

Annex 4.1: conditions diagnosed by GPs

Overview

Disease registers are lists of patients registered at general practices who have been formally diagnosed with a disease. Since 1 October 2023, practices in Wales have been required to maintain disease registers as part of the core General Medical Services core contract.

The types of diseases for which there are formal registers are the same as those originally specified in the Quality and Outcome Framework (QOF) in 2007, which was later replaced by the Quality Assurance and Improvement Framework (QAIF) in 2019. While not part of contractual arrangements, practices also record patients who are diagnosed with underlying conditions through ‘read codes’ and SNOMED codes.

There may be some small variations in how patients are diagnosed and recorded at practice level; however, all practices are contractually responsible for maintaining high quality registers, and therefore data quality is thought to be broadly very high.

Digital Health and Care Wales (DHCW) are responsible for hosting the ‘Audit +’ system which allows access to disease register and underlying read code/SNOMED code data. Following a formal request which was approved by DHCW’s data quality system group, Welsh Government was provided access to this data at the patient LSOAs level, for inclusion in WIMD.

Data specification

DHCW provided us with counts of patients with current diagnoses (as at 1 July 2025) for one or more selected conditions, separately for mental health and chronic health conditions. This included patients who had a diagnosis at any time period prior to July 2025, as long as they were still on the register. 

Data was received from all general practices that were active on the reference date in Wales, then aggregated to the Welsh Lower Layer Super Output Areas (LSOAs), according to patient’s home address. 

The specification for the conditions included was unchanged from WIMD 2019. It aims to include conditions that are:

  • less able to be managed by controls or treatment which allow the individual to lead a normal life, and
  • more likely to cause substantial pain and severe disability, and are associated with decreased life expectancy.

Mental health conditions

  • Depression
  • Low mood (patients with record of low mood and an active repeat prescription for an anti-depressant)
  • Anxiety disorder (including panic disorders)
  • Dementia
  • Severe mental illnesses (schizophrenia, bipolar affective disorder and other psychoses)

Chronic health conditions

  • Coronary Heart Disease
  • Chronic Obstructive Pulmonary Disease
  • Stroke and Transient Ischaemic Attack
  • Peripheral Arterial Disease
  • Chronic Kidney Disease
  • Diabetes Mellitus (for 0 to 16 year olds this only included diagnosis for Type 1 diabetes, due to suspected under-reporting of other types of diabetes for children; for those aged 17 and above this includes any diagnosis for diabetes)
  • Epilepsy

Our WIMD 2019 technical report provides further details on investigation of conditions, and we will review the list of disease registers and sub-indicators included in future indexes.

Data quality

The way in which certain conditions are recorded across general practices may vary. How promptly patients are removed from registers when conditions are resolved may also vary between practices, and impact on our data. Broadly, a patient will be removed from the disease register by a GP when they are determined not to have the conditions anymore. However, many of the conditions in both the chronic and mental health conditions indicators are long-term and are unlikely to fully resolve.

Given the possible variation in recording practices, we compared trends against the WIMD 2019 indicator data, analysis by local authority and local health board. This revealed unsurprising patterns, with high correlation between the rates of diagnosis.

Some areas have high absolute rates of diagnosed chronic or mental health conditions, and care should be taken in interpreting this data. However, for the WIMD domain and overall index ranks, it is only the relative rank of areas on the indicator that matters. Since comparison of the ranks with previous data showed high correlation, as expected, no immediate areas of concern were identified.

General practices in Wales are in the process of periodically moving to a single software supplier for the system which records patient diagnosis data. This meant that a small number of practices were actively switching systems when the data for WIMD was extracted. This may have impacted slightly on data quality for these practices; however, when quality assurance processes were performed on the data, indicator data trends were found to be well correlated with those for WIMD 2019 and therefore we have no reason to suspect a significant impact.

Denominator (population) data

The indicators within the health domain of WIMD are indirectly age-sex standardised to adjust for the expected prevalence of disease within the underlying population. This allows the index to identify areas where health deprivations exists beyond the effect of age and sex.

For the denominator, we have used the latest available Small Area Population Estimates (mid-2022) downloaded at the time of processing (October 2025), minus the prison population (2022). This allows for the breakdowns required to standardise rates for the effect of different age and sex profiles in different areas. It is also broadly consistent with denominators used in the income, employment and community safety deprivation domains of WIMD.

Another option might have been to use the patient register data, however the data available to use would not allow us to undertake age-sex standardisation using this source. Also, the ONS have published an assessment of the quality of the NHS patient register data. This explains that the patient register has a number of issues when used for statistical purposes. The source has a number of both under- and over-coverage issues, limited audit and potential for distortive effects because of its role in GP finance. The effect of these issues will vary by geography, age and sex.

Data adjustments

There are some Welsh residents with diagnosed health conditions who would not be captured in the data recorded by Welsh GPs, and we have adjusted for these in two ways.

  • There are over 13,000 Welsh residents registered with primary care providers in England. We have adjusted the rates for the 23 small areas with over a 100 residents registered in England, which account for over 12,000 of the 13,000 people affected. The standardised rates were adjusted by scaling them up to reflect the volume of residents for whom we are missing data, since we do not have information on any diagnoses made across the border.
  • Prisoners are likely to remain registered with a GP at their home address rather than a GP local to their prison for the duration of their sentence. Therefore we have subtracted prisoner numbers from the population estimates (denominator) before our calculation of standardised rates.

Annex 4.2: indirect age-sex standardisation

Indirect standardisation involves applying age-sex specific rates observed at national level to the population structure of each LSOA. The reason for using age-sex standardisation for the WIMD health indicators is to adjust the indicators to allow for different age and sex distributions amongst LSOA populations. For example, one might expect to observe a higher rate of deaths in an aging population than in one consisting predominantly of young families. Standardisation attempts to adjust for these differences in population. 

The number of expected incidences (for WIMD these are limiting long-term illness, cancer, chronic and mental health conditions, and premature death) for each age-sex group in an LSOA is estimated by multiplying the number of people in the given age-sex group in the LSOA by the age-sex specific rate observed for Wales as a whole for that age-sex group. The total number of expected incidences for the LSOA is calculated by totalling the number of expected incidences for each age-sex group. The standardised ratio (e.g. of cancer incidence) for each LSOA is the number of observed incidences in the LSOA divided by the number of expected incidences. 

Standardization ratio = observed incidence / expected incidence

An indirectly age-sex standardised rate can be obtained by multiplying the standardised ratio for the LSOA by the crude rate for all of Wales. The Welsh crude rate is the number of incidences observed in Wales divided by the total Welsh population. The result is expressed as a rate per 100,000 people. 

Indirectly standardised rate = standardised ratio x Welsh crude rate x 100,000

Education domain

The purpose of this domain is to capture the extent of deprivation relating to education, training and skills. It is designed to reflect educational disadvantage within an area in terms of lack of qualifications or skills. The domain has a relative weight of 14% in the overall index.

Indicators

Key Stage 4 average points score for core subjects

Type of indicator

Points score

Numerator

The average points score of year 11 pupils based on the grades achieved in GCSEs in the core subjects of English or Welsh first language, mathematics and science (or equivalent qualifications). 

Postcode data from PLASC is matched to LSOAs, using a postcode to LSOA look-up. A 2-year average is used to reduce the impact of having small numbers of pupils at LSOA level. 

Table 5.1: points score awarded for each GCSE grade (letter-based system, Wales)
GCSE GradePoints
A*58
A       52
B       46
C       40
D       34
E       28
F       22
G      16
U0

Results data for pupils domiciled in Wales but attending a school in England was provided by the Department for Education (DfE) and included in the calculation of this indicator. 

Table 5.2: points score awarded for each GCSE grade (numerical grading system, England)
GCSE GradePoints
958
855
752
648
544
440
332
224
116

Denominator 

Total number of pupils in national curriculum year group 11.

Source and time period 

Pupil Level Annual School Census (PLASC), and Welsh Examinations Database (WED).

Two-year average for academic years 2022 to 2023 and 2023 to 2024.

Comparability with WIMD 2019

Comparable.

Persistent absenteeism primary

Type of indicator

Percentage

Numerator

The number of primary school aged pupils in maintained primary, middle and special schools missing 10% or more of school sessions. 

Postcode data from PLASC is matched to LSOAs, using a postcode to LSOA look-up. Data are based on all pupils of statutory school age attending a maintained school. Data on pupils domiciled in Wales but attending a school in England has been provided by the Department for Education (DfE) and included in the calculation of this indicator. 

Denominator 

Total number of primary school aged pupils in maintained primary, middle and special schools.

Source and time period 

PLASC, Attendance Data Collection, and DfE.

Two year average for academic years 2022 to 2023 and 2023 to 2024.

Additional information

Further definitions and quality information can be found in reports for our statistical series on attendance and absence from schools.

Comparability with WIMD 2019

New indicator.

Persistent absenteeism secondary

Type of indicator

Percentage

Numerator

The number of secondary school aged pupils in maintained secondary, middle and special schoolsmissing 10% or more of school sessions. 

Postcode data from PLASC is matched to LSOAs, using a postcode to LSOA look-up. Data is based on all pupils of statutory school age attending a maintained school. Data on pupils domiciled in Wales but attending a school in England has been provided by the Department for Education (DfE) and included in the calculation of this indicator. 

Denominator 

Total number of secondary school aged pupils in maintained secondary, middle and special schools.

Source and time period 

PLASC, Attendance Data Collection, and DfE.

Two year average for academic years 2022 to 2023 and 2023 to 2024.

Additional information

Further definitions and quality information can be found in reports for our statistical series on attendance and absence from schools.

Comparability with WIMD 2019

New indicator.

Key Stage 4 leavers entering higher education

Type of indicator

Percentage

Numerator

Number of KS4 pupils who, at some point in the subsequent 4 years after leaving year 11, entered Higher Education. 

Higher Education provision is defined for the purposes of this indicator as any programme of learning above level 3. This includes undergraduate degrees and higher level apprenticeships.

Denominator 

Total number of pupils in national curriculum year group 11.

Source and time period 

Pupil level data from PLASC matched to Higher Education Statistics Authority (HESA) Record and Lifelong Learning Wales Record (LLWR) data.

Four-year average based on pupils who left school between academic years 2016 to 2017 and 2019 to 2020.

Comparability with WIMD 2019

Indicator values not comparable due to change in period from 3 years to 4 years after leaving year 11.

Adults aged 25 to 64 with no or low qualifications

Type of indicator

Percentage

Numerator

Number of adults aged 25 to 64 with no qualifications or level one qualifications.

Denominator 

Total number of adults aged 25 to 64.

Source and time period 

2021 Census, Office for National Statistics (ONS).

Comparability with WIMD 2019

Not comparable due to the addition of low qualifications in numerator.

Domain construction

There are 5 indicators in the education domain, weighted as follows. Factor analysis was used to calculate the indicator weights. 

  • Key Stage 4 average points score (21%)
  • Persistent absenteeism primary (16%)
  • Persistent absenteeism secondary (20%)
  • Key Stage 4 leavers entering higher education (15%)
  • Adults aged 25 to 64 with no or low qualifications (28%)

The domain has a relative weight of 14% in the overall index.

Changes since WIMD 2019 

KS4 average points score for core subjects

The 2019 indicator used a 3-year average, in 2025 a 2-year average has been used. An exploratory analysis of the data showed that there were sufficient pupil numbers for a 2-year average to give robust results.

Primary and secondary persistent absenteeism

WIMD 2019 included an indicator for repeat absenteeism which combined primary and secondary school attendance data to form one indicator. For WIMD 2025 there are separate indicators for primary and secondary. 

The threshold for the repeat absenteeism indicator in 2019 was missing more than 15% of half day school sessions. For 2025, the threshold is 10% or more of half day sessions. This brings WIMD in line with the Welsh Government’s official definition of ‘persistent absenteeism’. The name of the indicator has been updated from ‘repeat absenteeism’ to ‘persistent absenteeism’ to reflect this. An analysis of existing repeat absenteeism data taken at a 10% and 15% threshold showed a high degree of correlation. 

The 2019 indicator used a 3-year average, in 2025 a 2-year average has been used. An exploratory analysis of the data showed that there were sufficient pupil numbers for a 2-year average to give robust results.

Foundation phase Average Point Score (APS)

This indicator was included in WIMD 2019 but not in WIMD 2025. 

For primary education, the regular collection of attainment data (at foundation phase and KS2) ceased after 2018/19 with a pause in collecting this data during the pandemic being immediately followed by the introduction of the new Curriculum for Wales in 2022. This means there is not sufficiently consistent or robust data to update the primary school attainment indicators used in 2019.

KS2 APS

This indicator was included in WIMD 2019 but not in WIMD 2025 for the same reasons as above.

Additional information

Key Stage 4 attainment 

WIMD 2025 used the average point score for the core subjects (APS) when assessing achievement at KS4 (the same approach was taken for WIMD 2019). This is not the same as the ‘capped-9’ score that has been used by Welsh Government since 2019 to measure achievement at KS4. This decision to use the APS rather than capped-9 scores was made in order to limit the impact of the pandemic on the indicator. The rationale being that the core subjects would be less affected by variation in assessment practice during the pandemic period due to higher numbers of learners being entered for these qualifications. 

Covid-19 pandemic and changes to curriculum arrangements

Since WIMD 2019, schools in Wales were impacted by the pandemic and also started the transition to new curriculum arrangements. Because of this some of the schools-related indicators used previously are not available or where data is available it is limited. 

Data collected from schools during the pandemic was adapted to meet the challenges of the pandemic. For example, attendance data was collected weekly using different definitions of absence and there were variations in examination and awarding arrangements for public examination, including where grades were awarded based on a centre determined or centre assessed grade model. Data collected during this time may not be representative of deprivation relating to impacts on educational outcomes more generally due to the pandemic conditions. For this reason we have not used data collected during the height of the pandemic for the school-related indicators in WIMD 2025. Instead, for the three relevant indicators (KS4 attainment and both absenteeism indicators) we have used two years’ worth of post-pandemic data.

The level of qualifications of the working age population was collected via the Census during March 2021, just over a year since the pandemic was declared. However, data was found to be well correlated with Census 2011 trends used in WIMD 2019.

The remaining indicator considers KS4 pupils who, at some point in the subsequent 4 years after leaving Year 11, entered Higher Education. It is a four-year average based on pupils who left school between academic years 2016 to 2017 and 2019 to 2020. We can expect the pandemic to have had some impact both on the attainment of those leaving school in 2020, and on entry to HE for potentially all of these cohorts. This would be a real effect that is captured in the data, and we make no adjustment for this.

Access to services domain

The purpose of this domain is to capture deprivation as a result of a household's inability to access a range of services considered necessary for day-to-day living, both physically and online.

This covers both material deprivation (for example not being able to get food) and social aspects of deprivation (for example not being able to attend after-school activities). 

The domain has a relative weight of 10% in the overall index.

Indicators

Travel times by public and private travel (19 indicators)

Type of indicator

Average return travel time (in minutes) from residential dwellings to the nearest service point. The service types included are:

  • childcare provider
  • food shop
  • general practitioner (GP) surgery
  • petrol station
  • pharmacy
  • primary school
  • post office
  • public library
  • secondary school
  • sports facility

Each of the 10 service types has a private travel time indicator and 9 (excluding petrol stations) have a public travel time indicator.

Numerator

N/A

Denominator 

N/A

Source and time period

The sources used for the access point locations were:

  • GP surgeries: DataMapWales and NHS England, June 2025
  • primary schools, secondary schools, public libraries: DataMapWales, March 2025
  • childcare provider: Care Inspectorate Wales (CIW), June 2025
  • post offices: Post Office branch locations FOIA, December 2024
  • pharmacies: NHS Wales Shared Services Partnership, March 2025
  • sports facilities: OS AddressBase, September 2025
  • food shops, petrol stations: Points of Interest ®, August 2025

Public transport travel times (walking and using a public bus, public train or national coach) to the nearest access point for a given service were calculated using R5 routing engine, using timetable data from the Bus Open Data Service and Network Rail as at 9 September 2025. 

Private transport travel times to the nearest access point for a given service were calculated using the pgRouting library within PostGIS. The vehicular network was captured in the form of Ordnance Survey National Geographic Database Transport data, including average vehicular speed.

See annex 6.1 for further information on travel times sources.

Additional notes

See annex 6.1 for information on the methodology used to calculate the travel times indicators.

Comparability with WIMD 2019

Not comparable due to differences in travel time calculation methodology.

Inability to receive superfast broadband

Type of indicator

Percentage of residential premises unable to receive superfast broadband (30Mbit/s)

Numerator

Number of residential premises unable to receive superfast broadband (30Mbit/s)

Denominator 

Total number of residential premises.

Source and time period 

Ofcom Connected Nations update: Spring 2025 fixed coverage, output areas dataset

Additional notes

Ofcom collects and analyses data from over 50 fixed broadband internet service providers on addresses covered by their service. The Ofcom Connected Nations Update: Spring 2025 collected coverage data as a snapshot in January 2025. 

The Connected Nations 2024 Methodology Report (Ofcom) explains how operators were asked to provide data for each address where a service can be provided. Specific information on the Spring 2025 update can be found in the About this data - fixed coverage and full fibre take-up (Ofcom) document. 

Comparability with WIMD 2019

Broadly comparable. In September 2019, Ofcom changed the definition of the premise base used in the Connected Nations reports. More information can be found in the Connected Nations 2019 methodology report (Ofcom). 

Domain construction

There are 20 indicators in the access to services domain, split into a physical access subdomain and a digital access subdomain. The domain score is weighted 90% physical access and 10% digital access. 

The 19 travel times indicators form the physical access subdomain. For each service type, combined public and private travel times scores were produced for each LSOA. These combined scores weighted public and private transport travel times for each LSOA using data from the 2021 Census on car ownership and the number of adults aged 17 and over. Factor analysis was then applied to these combined scores to calculate the service weights, which are:

  • 20.6% pharmacies
  • 14.6% GP surgeries
  • 12.7% food shops
  • 8.6% childcare providers
  • 7.7% public libraries
  • 6.5% post offices
  • 6.2% primary schools
  • 5.7% sports facilities
  • 3.7% petrol stations
  • 3.7% secondary schools

The combined travel time scores were then weighted, summed and ranked to produce physical access ranks, before being exponentially transformed to produce the physical access sub-domain score.

The digital access sub-domain consists of the single indicator measuring inability to access superfast broadband. Data for this indicator was ranked and exponentially transformed to produce the digital access sub-domain score.

Finally, to produce the access to services domain ranks, the two sub-domain scores were weighted (90% physical access and 10% digital access), summed and ranked.

The domain has a relative weight of 10% in the overall index.

Changes since WIMD 2019 

The methodology used to calculate all travel times indicators has been updated since WIMD 2019. Full details of the new methodology can be found in annex 6.1.

‘Childcare provider’ has been added as a service type to the physical access subdomain for WIMD 2025. There are 2 new indicators measuring the average return travel time to the nearest childcare provider by public and private transport. Unique Property Reference Numbers (UPRNs) for all registered service providers in Wales were supplied by Care Inspectorate Wales (CIW), the independent regulator of social care and childcare services in Wales. The types of childcare provision included are:

  • children’s day care
  • full day care including day nurseries
  • sessional day care (e.g. playgroups)
  • crèche
  • out of school care
  • open access provision
  • childminder

There have also been changes to the data sources for some of the service types included, compared to WIMD 2019.

Only public libraries which meet the 13 core entitlements in the seventh quality framework of Welsh public library standards 2025 to 2028 have been included in the travel times to public libraries indicators. As a result, some community libraries included in WIMD 2019 are not included in WIMD 2025.

Post office locations data was sourced from a dataset published in response to an Freedom of Information (FOI) request in December 2024 (Post Office Corporate). This was previously sourced from Points of Interest ® in WIMD 2019. 

Ordnance Survey (OS) data was used to obtain sports facility locations. The data was filtered to match as closely as possible the SportWales data used in WIMD 2019. Although the positional accuracy is greater, the OS data has a lower granularity, and some sites are missed due to being located within a higher-level classification of site. The definition of “commercial” was too broad to match the filtering of the SportWales dataset.

Additional information

In addition to domain ranks and indicator values, we have published travel times sub-domain ranks. 

Annex 6.1: Travel times indicators methodology

Travel times to local services are used to calculate 19 indicators in the physical access sub-domain of the access to services domain. There are 10 indicators measuring travel times by public transport and 9 indicators measuring travel times by private transport. Public transport includes travel by public bus, public train, foot and national coach. Private transport is transport by private car.

Services

There are 10 service types included in the WIMD 2025 physical access sub-domain. 

Where possible, the most authoritative data set has been used. A citizen’s ability to use any of the services included in this domain is independent of their geography (i.e. being a Welsh resident). This exercise, therefore, acknowledges that a citizen’s nearest service may fall beyond the border of Wales. To accommodate this, service locations falling within a 10-kilometre buffer of the Welsh border were included where possible. Consequently, some data sets have a substitute source to cover England in cases where the primary and preferred Welsh source is unavailable for that geography. Not all service types include locations in England.

Pharmacies are stores where medicinal drugs are dispensed and sold. This includes pharmacies within a larger complex or supermarket. There are 792 pharmacy locations included in WIMD 2025.

Food shops are stores that sell everyday essential such as bread and milk. This includes convenience stores, newsagents, independent supermarkets, frozen food retailers and supermarkets. There are 3,692 pharmacy locations included in WIMD 2025.

General practitioner (GP) surgeries are facilities where NHS GPs are registered to practice including branch surgeries. There are 578 GP surgery locations included in WIMD 2025.

Childcare providers are those registered with Care Inspectorate Wales (CIW) to provide childcare. This includes full and sessional daycare, crèches, open access play provision and childminders. There are 2,789 childcare provider locations included in WIMD 2025. Services in England are not included.

Public libraries are libraries that are open to the public. Community libraries which do not meet all 13 of the core entitlements in the seventh quality framework of Welsh public library standards 2025 to 2028 are not included. Mobile libraries are also not included due to a lack of geographical data. There are 230 public library locations included in WIMD 2025. Services in England are not included.

Post offices include all static post offices. There are 1,069 post office locations included in WIMD 2025.

Primary schools are schools that deliver education to children aged 5 to 11. Travel times included in the calculation were limited to those where a child within the postcode was enrolled at a primary school. School enrolment data were sourced from PLASC. There are 1,230 primary school locations included in WIMD 2025, including 31 middle schools. Services in England are not included.

Sports facilities are a non-private (i.e. free or pay-for-play) site containing one of the following: Sports Hall, Studio, Grass Pitch, Synthetic Turf Pitch, Sports ground (Participation), Swimming Pool, Health and Fitness Suite, Squash Court, Outdoor Tennis Court, Outdoor Bowling Green, Indoor Tennis Centre, and Indoor Bowls. There are 2,742 sports facility locations included in WIMD 2025. Services in England are not included.

Petrol stations are stores selling fuel for personal vehicles. This service type is only included in the private transport element of the sub-domain. There are 688 petrol station locations included in WIMD 2025.

Secondary schools are schools that deliver education to children aged 11 to 16. Travel times included in the calculation were limited to those where a child within the postcode was enrolled at a secondary school. School enrolment data were sourced from PLASC. There are 205 secondary school locations included in WIMD 2025, including 31 middle schools. Services in England are not included.

Residential addresses

The location of residential addresses for Wales were captured using an agreed definition from the NGD Built Address dataset, obtained under the Public Sector Geospatial Agreement. 

For the purposes of the access to services domain, a residential address is included in the analyses if the address is an active record and a valid domestic council tax record or adheres to one of the following classifications:

  • residential
  • residential dwelling
  • caravan (and has a valid domestic council tax record)
  • detached
  • semi-detached
  • terraced
  • self-contained flat (includes maisonette or apartment)
  • house boat (and has a valid domestic council tax record)
  • sheltered accommodation
  • House in Multiple Occupation (HMO)
  • HMO parent
  • HMO bedsit or other non self-contained accommodation

There are 1,462,468 residential dwellings in Wales in the origins dataset.

Travel times

The journey to a service from a residential dwelling is defined as the journey to the service. The journey to a residential dwelling from a service is defined as the journey to the residential dwelling. The combination of these one-way single journeys is defined as the return journey.

The travel time for a journey is defined as the time taken in minutes to travel from a residential dwelling to a service access point or vice versa. Travel times are calculated for a one-way single journey over a specific time window which varies by service type and transport mode. 

The maximum specified travel time for a single journey will be 90 minutes (1.5 hours) and any travel times over 90 minutes will be given the value of 90 minutes.

The private travel time and public travel times may refer to different services of the same type (i.e. an individual using public transport may go to a different GP than an individual using private transport).

Each indicator in the sub-domain is the average return journey time (in minutes) to the nearest access point for the given service type and travel mode. 

Public transport

The public transport methodology has been refined to calculate travel time to the doorstep of every residential address, rather than the 5-minute isochrones used in WIMD 2019. For 2019, trips were run at 3 set departure and arrival times. For 2025, a departure window was used to calculate travel time for trips leaving every minute over a 2 to 3 hour period and the median value across all trips was used to more accurately reflect accessibility.

For public transport routing, R5, an open-source, multi-modal routing engine, was used. R5 was developed from OpenTripPlanner (OTP), used for public transport routing in WIMD 2019. R5 focuses on performance for large-scale analysis, while OTP v2 has tightened its focus on passenger information. More information can be found in OpenTripPlanner’s Travel Time Analysis guidance. 

The R5 network is built using timetable data in General Transit Feed Specification (GTFS) format. GTFS allows public transit agencies to publish their transit data in a format that can be consumed by a wide variety of software applications. It includes information surrounding the geometry of the stops, as well as the route information and times of each service. 

Bus timetable data was obtained from the Bus Open Data Service in GTFS format. Downloads are available as a national (GB) dataset or per-region. For WIMD 2025, data from Wales, South West England, West Midlands and North West England was used. The English regions’ data was clipped to the 10km border area using UK2GTFS

Data for rail journeys across Wales was sourced from the Rail Delivery Group and was downloaded in CIF format. Registration is required for access. UK2GTFS was used to convert the CIF data to GTFS. 

R5 uses the following assumptions:

  • the default walking speed is 1.25 m/s
  • walking speeds are irrespective of terrain and obstacles, but walking is not permitted on roads deemed non-pedestrian in OpenStreetMap (e.g. motorways)
  • a maximum walking time of 20 minutes was set, applied to each leg of the trip
  • this could mean walking up to 20 minutes walking to a stop/station (ingress), between stops/stations (transfer) or from a stop/station to the destination (egress)
  • public transport can be provided in England or Wales, where cross border travel is required to a citizen’s nearest service
  • travel times are taken from the median result across the departure window
  • any residential addresses exceeding a 90-minute travel time from a service is automatically set to 90 minutes
  • inbound (residential property to service) trips are calculated from all properties reachable on the outbound trip
  • return trip time is calculated from the fastest inbound/outbound pair for every property to a single service 

For each residential dwelling, one journey per minute across the specified departure window was calculated for both the journey to the service and the journey to the residential dwelling. 

Departure time windows for journeys to the service by public transport are as follows:

  • primary school, secondary school, childcare service: 8:00 to 9:00
  • food shop, GP, pharmacy, public library, post office: 9:00 to 11:00
  • sports facility: 16:00 to 18:00

Departure time windows for journeys to the residential dwelling by public transport are as follows:

  • primary school, secondary school, childcare service: 15:00 to 16:30
  • food shop, GP, pharmacy, public library, post office: 11:00 to 13:00
  • sports facility: 18:00 to 20:00

Petrol stations are not included in public transport travel times.

The average (median) travel time of all journeys to the service were added to the average travel time of all journeys to the residential dwelling. Calculating the average of all journeys in both directions reflects the service frequency for a particular journey.

When a median return journey travel time had been calculated for all dwellings, each LSOA was assigned the median of these values for dwellings in that LSOA to produce the public transport travel time indicator.

Private transport

Private transport travel times to the nearest access point for a given service were calculated using the pgRouting library within PostGIS. 

Journey times were calculated from every service origin to every residential address within Wales. The shortest of all travel times per indicator (in decimal minutes) equals the shortest journey time to the nearest service.

The vehicular network was captured in the form of Ordnance Survey (OS) National Geographic Database (NGD) Transport data which Welsh Government access from OS under the Public Sector Geospatial Agreement (PSGA). NGD Transport is the most complete, detailed and accurate navigable road network dataset for Great Britain. 

For the purposes of Access to Services private transport calculations, NGD Transport RoadLink geometry was broken up into smaller links to create a new node in front of every residential address at their closest point on the road associated (by Unique Street Reference Number (USRN)) to that property. This ensured time travel calculations per dwelling were not falsified with an additional distance to the nearest node in the standard link-node data structure. 

Average vehicle speeds were applied to every road link within the network. The speed is based on Trafficmaster data sourced from Basemap, made available as part of the NGD Transport theme under the PSGA. This data identifies the average speed travelled across all roads in Great Britain at different times of day. The average speed is calculated based on detailed historical speed information, which is collected every 6 months by in vehicle telematics devices and mapped to each unique OS NGD Transport RoadLink ID. The average speed value is provided in both directions.

More information on the average and indicative speed data can be found in the NGD Transport documentation.

A singular journey from every service to all residential dwellings was calculated, using average speed data for the appropriate time window. Travel time windows for journeys by private transport are as follows:

  • primary school, secondary school, childcare service: 7:00 to 9:00 (peak AM)
  • food shop, GP, petrol station, pharmacy, public library, post office: 10:00 to 16:00 (off peak)
  • sports facility: 16:00 to 19:00 (peak PM)

Where average speed data was not available for any given road link, indicative speed data was used instead. For every residential address, the smallest travel time was therefore taken as the quickest travel time. This journey was doubled to represent a return journey to and from the service.

This has the same effect as averaging the two values and then doubling to take into account the return journey. Doubling the single journey time as the journey to and from the dwelling will show very little difference by private transport. This wouldn’t be the case by public transport.

When a median return journey travel time had been calculated for all dwellings, each LSOA was assigned the median of these values for dwellings in that LSOA to produce the private transport travel time indicator.

Quality assurance 

Data were quality assured by the Data and Geography department and CGI, as well as the WIMD team.

The Digital and Geography department and CGI quality assured the calculation of the travel times indicators by:

  • quality assuring all UPRNs whose travel time exceeded 90 minutes qualitatively sense checking all indicators across Wales by visualising the travel times as a heat map
  • conducting randomised checks of individual routes against bus and train timetable information to ensure services are accurately reflected and being modelled (public transport indicators)
  • conducting network level checks through sampling of the OS NGD Transport Network geometry and average speed data to ensure no anomalous links or obstructions with the routing graph (private transport)
  • comparing results to Google Maps routing platform for a sub-set of services against all indicators (private transport)

The WIMD team then undertook statistical quality assurance checks for both public and private travel times for each of the indicators, by checking LSOA travel times for WIMD 2025 relative to WIMD 2019. This involved:

  • sense-checking data by observing maximum, mean and median absolute changes in indicator times for LSOAs between 2019 and 2025
  • sense-checking travel times in outlying LSOAs, and in those in which a decile had shifted by 4 or more deciles in either direction
  • sense-checking the distribution of travel times across all LSOAs, local authorities, and settlement types
  • investigating LSOAs with large absolute changes in return travel time compared to WIMD 2019 for new or closed services
  • using the Google Maps routing platform to verify 2025 travel times for LSOAs with large absolute changes

Housing domain

Conceptually, the purpose of the housing domain is to identify inadequate housing, in terms of physical and living conditions and availability. Here, living condition means the suitability of the housing for its inhabitant(s), for example in terms of health and safety, and necessary adaptations. The domain has a relative weight of 9% in the overall index.

Indicators

Conceptually, the purpose of the housing domain is to identify inadequate housing, in terms of physical and living conditions and availability. Here, living condition means the suitability of the housing for its inhabitant(s), for example in terms of health and safety, and necessary adaptations. The domain has a relative weight of 9% in the overall index.

Indicators

The housing domain has two equally weighted sub-domains, housing availability and housing conditions, with two equally weighted indicators each. 

The housing availability sub-domain contains indicators of:

  • overcrowding: the percentage of households that are overcrowded (bedroom measure)
  • inability to afford to enter owner occupation or the private rental market

The housing conditions sub-domain contains indicators of:

  • poor quality: the likelihood of housing being in disrepair or containing serious hazards (for example, risk of falls or cold housing)
  • energy efficiency

Overcrowding 

Type of indicator

Percentage.

Numerator

Number of households that are overcrowded (bedroom measure).

Denominator 

Number of households.

Source and time period 

2021 Census, Office for National Statistics (ONS).

Additional notes

This indicator provides a measure of whether a household is overcrowded. The definitions of overcrowding are fully explained on the ONS website (Census 2021 metadata).

Comparability with WIMD 2019

Not directly comparable.

WIMD 2025 measures overcrowding as the percentage of households that are overcrowded, where as WIMD 2019 it was measure as the percentage of people in overcrowded households. 

Updated data are available based on Census 2021, however the breakdowns needed for WIMD are only available on a household basis and no longer on a resident basis, i.e. there is data on the percentage of households that are overcrowded, rather than the percentage of people in overcrowded households. 

We have compared overcrowding data for LSOAs on a household vs resident basis using Census 2011 outputs (which include both definitions) and found there to be a high level of correlation, so changing between these definitions has little impact on ranks for the housing domain.

This change to the indicator has the advantages of increased transparency and accessibility (being based on data already published by ONS), comparability with the approach for England, and potential for added value in terms of allowing users to access additional breakdowns of the indicator data from Census 2021 custom tables on the ONS website.

Inability to afford to enter owner occupation or the private rental market 

Type of indicator

Overall indicator is a score (indicator sub-components are rates, see additional notes).

Numerator

For the indicator sub-components: the number of relevant households estimated to be unable to afford to enter owner occupation or the private rental market for the relevant cohort.

Denominator

For the indicator sub-components: the total number of relevant households.

Source and time period 

The main data sources are:

  • the Family Resources Survey (FRS) for household incomes and composition, financial years ending 2024, 2023, 2022 and 2020
  • the ONS House Price Index (formerly Land Registry) for house prices, 2023
  • data from Rent Officers Wales (equivalent to administrative data collected in England by the Valuation Office Agency) for rents, 2023 

Other sources used included a range of Census 2021 and other published or official data at LSOA level, including ONS 2021-based classifications of LSOAs and local authorities, ONS populations for LSOAs, NOMIS claimant counts, and some other indicators at local authority level including from the Annual Population Survey and the Annual Survey of Hours and Earnings.

Private rent data from Rent Officers Wales reflects achieved rents across tenancies of varying lengths. This may not accurately represent the cost of securing a new tenancy today, as advertised rental prices are dictated by the current market conditions, which are generally higher than existing tenancies.

Additional notes

 We have introduced a new indicator on inability to afford to enter owner occupation or the private rental market produced by Heriot-Watt University. This indicator has been used in several iterations of the English indices of deprivation (MHCLG), for younger households with head of household aged under 40. Our measure also considers older private renters with a head of household aged 40 to 65. 

The indicator is modelled in several stages, starting with microdata from the FRS, then applying predictive functions to Census and other small-area data, and finally controlling for consistency at the Wales level. 

Affordability is assessed using two main criteria: the ratio of lower quartile house price or rent (by bedroom size) to income, and the ratio of residual income after housing costs to a standard based on basic household requirements. To derive house price and rent thresholds relevant to a given household, the approach uses housing market areas defined via research into commuting and migration patterns, recognising that people search for housing across larger geographies. 

The overall indicator score is based on 4 sub-components, which are estimated proportions of:

  • difficulty of access to owner-occupation for households where the head is aged under 40
  • difficulty of access to the private rental market where the household head is under 40
  • difficulty of access to owner-occupation for older private renters (with household head aged 40 to 65)
  • difficulty of access to the private rental market for older private renters (with household head aged 40 to 65)

We have published the data for each component (by age and tenure) separately as part of the WIMD indicator datasets. These may be more meaningful to users than the overall indicator score which is calculated as follows from the 4 sub-components:

  • for the 2 age groups separately, the proportions unable to buy or rent are standardised and combined with equal weight
  • these 2 measures are combined into an overall indicator score by standardising and combining them with 75% weighting for the younger group and 25% for older private renters

Please see annex 7.1 for further details.

Comparability with WIMD 2019

New indicator.

Likelihood of poor quality housing (being in disrepair or containing serious hazards)

Type of indicator

Percentage.

Numerator

Estimated number of dwellings that: 

Denominator 

Numbers of residential dwellings. 

Source and time period 

Building Research Establishment, using various survey and administrative data sources, 2023.

Additional notes

A dwelling is determined to have a Category 1 hazard as a result of excess cold if there is a severe threat from sub-optimal indoor temperatures. A dwelling is assessed as having a Category 1 hazard in terms of falls if there is determined to be a serious risk of falling on stairs, between levels, level surfaces or falling associated with a bath, shower or similar facility. A dwelling is said to be in disrepair if at least one of the key building components is old and needs replacing or major repair due to its condition; or more than one of the other building components are old and need replacing or major repair. Further details on the modelling process are provided in annex 7.2.

Comparability with WIMD 2019

The update was based on a similar approach to that used for 2019 WIMD and includes the use of more recent data sets where available. The 2025 modelling work also includes the integration of two data sets provided by the Welsh Government; Rent Smart Wales and Welsh Housing Quality Standard (WHQS) to help identify private rented and social stock, respectively.

For the 2019 indicators, data from the Welsh Housing Condition Survey (WHCS) was used to benchmark the modelled data; however, there has not yet been an update to the WHCS. Instead, notional 2023 benchmarks were estimated by comparing changes in each indicator for the West Midlands region between 2017 and 2023 and applying this change to the WHCS 2017 totals to create adjusted likelihoods.

Energy efficiency 

Type of indicator

Average score.

Numerator

Total value of final (observed and imputed) energy performance certificate (EPC) scores.

Denominator 

Total number of residential properties.

Source and time period 

Numerator: EPC data for assessments undertaken between January 2012 and December 2024 (MHCLG open data).

Denominator: Ordnance Survey National Geographic Database.

Additional notes

We have introduced a new measure of energy efficiency, based on average Standard Assessment Procedure (SAP) scores for residential properties in the area, using data from Energy Performance Certificate (EPC) records. MHCLG have developed this indicator for residential dwellings in England and Wales, imputing estimated EPC scores for all dwellings that do not currently have a valid EPC. 

Since around 55% of properties in Wales do not have a valid EPC, the measure imputes estimated EPC scores for all dwellings that do not currently have a valid EPC. EPC open data was linked to Ordnance Survey data including building-level characteristics (such as building type and age) to inform the imputation, based on an average (median) EPC score for nearby properties of similar type, as described below.  

Nearest-neighbour imputation methodology process:

  • only EPC records from 2012 onwards were used, as data quality prior to this date was less reliable
  • each property without an EPC was matched to similar dwellings (based on dwelling type, build period, and construction material) within its own or directly contiguous LSOAs
  • an EPC score was estimated for each property using the mean score of its five closest neighbouring properties of similar type (generating estimates for 98% of properties lacking valid EPC ratings)
  • for unresolved properties, the imputation was re-run using relaxed matching criteria: first removing construction material as a criterion, then allowing matches across the local authority

Before calculating mean (of observed and imputed) EPC scores for each LSOA, a final adjustment was made to address potential distortion caused by holiday caravan parks. In affected LSOAs, the number of caravans (and their associated scores) were scaled to align with Census 2021 counts of households resident in caravan accommodation.

Please see the English indices of deprivation 2025 technical report (MHCLG) for further details on the approach. 

Separately, the WG data science unit (DSU) have used machine learning to build a virtual EPC dataset for all homes in Wales which has been used to quality assure the data used in WIMD. We have used the simpler MHCLG model for WIMD 2025 as this will provide consistency with the approach for England, and since the impact of the choice of data on WIMD was small. This choice of data source will be reviewed ahead of the next index as the DSU project develops.

Comparability with WIMD 2019

New indicator.

Domain construction

There are 4 indicators in the housing domain, split into two sub-domains and weighted as follows.

  • Housing availability.
    • Overcrowding 25%.
    • Inability to afford to enter owner occupation or the private rental market 25%.
  • Housing conditions.
    • Poor quality 25%.
    • Energy efficiency 25%.

The relevant indicators within each of the sub-domains are standardised by ranking and transforming to a normal distribution and combined using equal weights. 

Sub-domain scores are then standardised through being ranked, which gives us the sub-domain ranks for availability and conditions. These two sets of ranks are then transformed to exponential distributions and combined with equal weights to create the overall domain score.

The domain has a relative weight of 9% in the overall index. This has increased from 7% in the 2019 index, due to the addition of new indicators on energy efficiency and the inability to afford suitable housing.

Changes since WIMD 2019 

In WIMD 2025, two new indicators have been introduced into the housing domain: 

  • inability to afford to enter owner occupation or the private rental market (part of the housing availability sub-domain)
  • energy efficiency (part of the housing conditions sub-domain)

These additions reflect feedback received during the 2025 WIMD proposals survey, where respondents supported their inclusion to better capture housing deprivation. 

The domain continues to include an indicator on overcrowding, now based on Census 2021, which captures aspects of both housing availability and living conditions. As explained in a previous section, the indicator now reflects the percentage of households that are overcrowded, rather than the percentage of people living in overcrowded households (used for WIMD 2019).

As a result of the indicator changes that better capture housing deprivation, the housing domain has been given an increased weight in the overall index in WIMD 2025. The domain now has a relative weight of 9% in the overall index, increasing from 7% in the 2019 index.

Additional information

Due to a lack of robust alternatives at small area level, modelled data are now used in 3 of the 4 indicators in the housing domain. Our quality assurance process suggests that relative trends shown in the data remain reasonably accurate. However, modelled data may have limitations in reflecting the impact of recent housing interventions or other changes. Where decisions are being informed, modelled data should be used alongside robust, up-to-date local intelligence wherever possible.

In addition to domain ranks and indicator values, we have published housing sub-domain ranks on StatsWales.

Annex 7.1: inability to afford to enter owner-occupation or the private rental market

Overview

A new indicator developed for WIMD 2025 by Heriot-Watt University measures the difficulty of accessing owner-occupation or the private rental market. It primarily focuses on younger households (with a head aged under 40), assessing their ability to afford to buy or rent a suitably sized home at local threshold prices and rents in 2023. The indicator incorporates a secondary element for older private renters (aged 40 to 65), reflecting the growing vulnerability of this group. 

These indicators are comparable to those provided to the Ministry of Housing Communities and Local Government (MHCLG) to update the English indices of deprivation. 

Indicator description

The indicator is based primarily on the estimated proportions of younger (aged under 40) households able to:

  • afford to buy a home of appropriate size (based on household composition) at the local threshold price level in 2023
  • afford to rent a home of appropriate size in the private market at the local threshold rent level in 2023

This aims to capture the cohort of households entering the housing market, recognising that most first-time buyers are in the younger adult age group. 

The indicator also considers an additional group in potential need, by including estimates for the proportion of ‘older private renters’ (with household head aged 40 to 65) able to afford buying or market renting in the local area. This group has grown in size and remains relatively more vulnerable in terms of affordability, security and dwelling quality and hence potential candidates for more affordable alternatives.

The rationale for focusing on these groups is that they are the main target for local housing and planning policies for the provision of additional social and affordable housing.

All indicators are model-based estimates available down to the lower super output area (LSOA) level. The methodology broadly follows that used in the 2015 and 2019 indices of deprivation for England, but with some detailed methodological changes and the extension to older private renters.

Using these four sets of estimated proportions, we calculate a ‘housing affordability’ measure of the difficulty of access to housing for the two age groups separately, by inverting, standardising and combining the ‘buying’ and ‘renting’ elements with equal weight. These two measures are then combined into an overall housing affordability indicator measuring the inability to afford to enter owner-occupation or the private rental market. This is done by standardising and combining the measures for the two age groups with 75% weighting for the younger group and 25% for older private renters. This reflects the relative size of these populations and arguably provides a reasonable representation of their relative importance for housing and planning policies.

Methods and data sources

Data sources

The main data sources are the Family Resources Survey (FRS) for household incomes and composition, the ONS House Price Index (formerly Land Registry) for house prices, and data from Rent Officers Wales (equivalent to administrative data collected in England by the Valuation Office Agency) for rents. Other sources used included a range of Census 2021 and other published or official data at LSOA level, including ONS 2021-based classifications of LSOAs and local authorities, ONS populations for LSOAs, NOMIS claimant counts, and some other indicators at local authority level including from the Annual Population Survey and the Annual Survey of Hours and Earnings.

Private rent data from Rent Officers Wales reflects achieved rents across tenancies of varying lengths. This may not accurately represent the cost of securing a new tenancy today, as advertised rental prices are dictated by the current market conditions, which are generally higher than existing tenancies.

Income

Income is defined as the income of the ‘first benefit unit’ in the household, excluding income from means-tested benefits and from benefits intended to cover the additional costs associated with disability (DLA, PIP, AA). The first benefit unit is defined as the main householder and any partner where the household reference person is aged under 40. Other adults present in any ‘complex’ household are separate benefit units, and their income is not included because these would not be considered reckonable income for the purposes of obtaining a mortgage and because it is assumed that it is the core benefit unit that would be seeking to buy or rent an appropriate housing unit. This means that ‘concealed households’ (such as adult children or other adults living within a larger household) are not included in the measure, even though they may also be trying to access housing independently.

Housing market areas

As far as assumptions about where a particular family may be looking to live, the approach uses “housing market area” (HMA) geographies rather than LSOAs, as people are likely to reach wider than an LSOA boundary when looking to buy or rent. There would also likely be insufficient price and rent data at small area level to derive reliable threshold costs for different sized accommodation to input to this model.

The threshold house prices and rents for England in preceding work were calculated for HMAs derived from the 2010 study of The Geography of Housing Market Areas in England (Jones, Coombes and Wong, 2010), undertaken for the former National Housing and Planning Advice Unit and published by the Department for Local Government and Communities.

This work aimed to identify the optimal areas within which planning for housing should be carried out, using Census data about commuting and migration patterns. The lower tier of local market areas (LHMAs) was used for this purpose, with small area price data and local authority level rent data apportioned to LHMAs. The same approach is followed for Wales.

Figure 7.1: map of local housing market areas in Wales used in WIMD 2025
Image

Description of figure 7.1: the map shows that the 35 resultant LHMAs are close to the current local authority areas, with subdivisions in several cases. Examination of 2001 ward level information on the LHMAs for Wales suggested that there was only one pair of authorities (Neath-Port Talbot and Bridgend) where there were substantial areas crossing LA boundaries, plus three larger ‘valleys’ type authorities where smaller HMAs representing different valleys were part of the system. In addition three large rural authorities were also split into more than one HMA.

Rental data for local authorities was used to approximate rental data for LHMAs using evidence on the relationship between rents and prices: variation in rents between areas was found to be in proportion to the variation in house prices raised to the power of 0.7. Mapping LHMAs onto LSOAs involved some approximation, since LHMAs were built from wards and some originally crossed the border with England.

The measure does not aim to capture variation in house prices between small areas within a given authority or city, nor does it attempt to capture the availability or supply of suitable housing. Instead, it reflects likely variation in household income and bedroom requirements at the small area level, alongside a threshold housing cost based on the wider housing market area. The aim is to estimate how likely it is that households in a small area can reasonably afford to buy or rent a suitable home within the broader market area. 

While other datasets, such as House price statistics for small areas in England and Wales (ONS), focus on local price variation, this measure takes account of household circumstances and assumes that people may move a reasonable distance to find affordable housing.

For example, a household living in a relatively low-income neighbourhood may not be able to afford housing in their immediate area, but could potentially afford a suitable property in a nearby part of the wider housing market area. The measure reflects this by combining local income and household composition data with housing cost thresholds set at the broader market level, rather than attempting to capture fine-grained price differences between adjacent neighbourhoods.

Affordability thresholds and criteria

Whether for buying or renting, a household must pass two ratio-based affordability thresholds, one relating the ratio of house price or rent to income, and the other based on the ratio of residual net income after housing costs to a standard based on household basic requirements allowing for household composition. Criteria used in previous work were updated to account for academic analyses, market practices, and recent evidence on housing choices of key target groups. 

Price/rent thresholds: The threshold price is based on the lower quartile of all sales within size groups (1, 2, 3 and 4+ bedroom) at Housing Market Area level, and similarly the lower quartile private market rent within size groups. The size criteria for affordability to buy includes a spare bedroom. For affordability to rent in the market the lowest size category included was one-bedroom.

Ratio of price/rent to income: For buying the ratio is a lending multiplier from gross income to maximum mortgage (4.0 for one earner 3.6 for 2 earners), whereas for renters it would be a ratio rent to net income of 30%. 

For house purchase, it is assumed that a 95% mortgage would be taken out but allowance is also made for ‘excess’ savings (over £12,000) already held by the household to be contributed. Some households are enabled to buy thanks to large wealth transfers from parents or other relatives; the indicator makes no allowance for this. The chosen lending multipliers reflect recent practice and are consistent with the ratio of payment to net income of 30% with interest rates at around 4% and mortgage term of 30 years (different terms and multipliers would apply to older renters depending on age).

Ratio of residual income to basic requirement: For both tenures the residual income ratio is set at 1.4 times an amount derived from 90% of selected core budget items from the Minimum Income Standard (MIS).

Modelling sequence

The indicator is modelled using FRS data, as this has a large sample (with pooling of four years of data) and contains the most authoritative income and benefits data. The years of data used were financial years ending 2024, 2023, 2022 and 2020. Data for financial year ending 2021 is not considered sufficiently complete or reliable owing to Covid restrictions on survey fieldwork.

Estimation of incomes and affordability measures occurs in stages. First a model is built using certain variables in the FRS sample survey data to predict the measures of income and affordability. Then a dataset of equivalent predictor variables is created using Census and other sources. The predictive model parameters from the FRS analysis are then applied to generate predicted values for the incomes and affordability measures at LSOA level. These LSOA estimates are then adjusted for consistency using control values based on area types (whether in higher or lower priced regions) and local authority categories, applying an iterative fitting method. 

At the final stage the individual LSOA controlled predicted values were checked for outliers or missing cases. In these cases, an alternative estimate would be generated using ‘affordability elasticities’ (generated within the FRS analysis) applied to price or rent differences from group averages. 

The approach involves modelling incomes and affordability across England and Wales as a whole, with the same predictive functions applying to both as FRS sample numbers for Wales are not adequate to enable effective modelling for Wales alone. However, at the stage of controlling the estimates, predicted affordability rates are checked for consistency with the FRS micro estimates at the Wales level.

Limitations and considerations 

Concealed households

The measure focuses on the income of the ‘first benefit unit’ in a household and excludes other adults in complex households. This means that concealed households (such as adult children or unrelated individuals living within a larger household) are not captured, even though they may face affordability barriers. Most new household formation takes place within the age range up to 40, so it is assumed that this group provides a broad representation of new households entering and becoming established in the housing system.

Private rent data 

The rental data used is sourced at the local authority level, which limits the ability to reflect finer-grained variation in rents within authorities (and some of the LHMAs in use are smaller sub-divisions of local authorities). Reflecting wider evidence, rents are assumed to vary between HMAs within local authorities, proportional to the variation in house prices to a power of 0.7 Additionally, the data may underrepresent smaller landlords and exclude tenancies involving housing benefit, potentially skewing results away from the lower end of the market.

Housing market areas 

Affordability thresholds for each LSOA are based on wider housing market areas (rather than individual neighbourhoods). This reflects the assumption that households may move a reasonable distance to access desired housing, but it means the measure does not capture very localised price differences.

Tenure and age focus 

The indicators target younger households (under 40) and older private renters (aged 40 to 65), based on their relevance to housing policy. However, affordability challenges may also affect other groups not directly covered. The overall indicator does not account for variations in age distribution across areas of Wales, that is, the two indicators are combined into an overall measure using the same weighting for all small areas, 75% weighting for the younger group and 25% for older private renters. However, we will publish the indicator data for each component (by age and tenure) separately, allowing for further analysis if required.

Affordability thresholds

The measure uses two criteria: housing cost-to-income ratio and residual income after housing costs, based on updated evidence and modelling. While robust, these thresholds are still simplifications of complex household circumstances.

Sample size constraints

For older private renters, sample sizes in the FRS are relatively small, which limits the precision of estimates and required further grouping of areas to meet minimum reporting thresholds.

Annex 7.2: poor quality housing indicator

Overview

We commissioned the Building Research Establishment (BRE) to construct a poor quality housing indicator for WIMD 2025, at small area (LSOA) level. BRE used a similar methodology to that they used for WIMD 2019 when the indicator was first created. The indicator is calculated using a model built from survey data, which makes probabilistic predictions about individual level dwellings in Wales, using a range of administrative datasets as inputs.

Indicator description

Conceptually, the purpose of the housing domain is to identify inadequate housing, in terms of physical and living conditions and availability. The poor quality housing indicator estimates the likelihood that dwellings in a given area: 

  • contain a Category 1 hazard for excess cold, falls or other hazards under the Housing Health and Safety Rating System (HHSRS)
  • or are in a state of disrepair 

These two measures are useful and well-established indicators of housing deprivation, also used for the 2025 update of the English indices of deprivation (MHCLG).

Hazards

The Housing Health and Safety Rating System (HHSRS) is used by Welsh Government as an evidence based risk assessment procedure for residential properties. The HHSRS is a means of identifying defects in dwellings and of evaluating the potential effect of any defects on the health and safety of occupants, visitors, neighbours and passers-by. The system provides a means of rating the seriousness of any hazard so it is possible to differentiate between minor hazards and those where there is an imminent threat of major harm or even death. The emphasis is placed on the potential effect of any defects on the health and safety of occupants, visitors, and particularly vulnerable people. The HHSRS assesses 29 types of hazards. For the purposes of this modelling, hazards were grouped into the following three categories:

1. excess cold

2. falls (comprising of falls on stairs, falls on the level, and falls associated with baths)

3. other (all other hazards)

Dwellings where at least one Category 1 hazard (hazards with potential extreme harm outcome) was present were reported as failing the assessment. A dwelling is determined to have a Category 1 hazard as a result of excess cold if there is a severe threat from sub-optimal indoor temperatures. A dwelling is assessed as having a Category 1 hazard in terms of falls if there is determined to be a serious risk of falling on stairs, between levels, level surfaces or falling associated with a bath, shower or similar facility.

Disrepair

The same disrepair criterion as used in the Decent Homes Standard (England) was used, (the same as that used for the 2025 update of the English indices of deprivation). A dwelling failing the disrepair criterion means that certain building components are in poor condition, defined as either:

1. one or more key building components are old and, because of their condition, need replacing or major repair

2. two or more other building components are old and, because of their condition, need replacement or major repair

Key building components are those which, if in poor condition, could have an immediate impact on the integrity of the building and cause further deterioration in other components. They are the external components plus internal components that have potential safety implications and include:

  • external walls
  • roof structure and covering
  • windows/doors
  • chimneys
  • central heating boilers
  • gas fires
  • storage heaters
  • plumbing
  • electrics

Other building components are those that have a less immediate impact on the integrity of the dwelling. Their combined effect is therefore considered, with a dwelling failing the disrepair standard if two or more elements are old and need replacing, or require immediate major repair.

Methods and data sources

The approach that was used to create the modelled data involved:

  • using data from housing condition surveys where experienced surveyors carried out physical inspections of a sample of properties from all tenures (including measurement of disrepair and risks of hazards across all types of dwellings)
  • building a model from this data to predict the likelihood of poor quality housing based on a range of predictors (such as the age, type, size, tenure, construction and energy variables such as heating and fuel type)
  • applying this model to all dwellings in Wales, using data from a range of sources (including Ordnance Survey, Land Registry, EPC data) to provide the required predictors
  • benchmarking the results to national estimates of poor housing quality 

The modelling process above is carried out separately for the aspects of poor quality housing listed below (and defined further in following sub-sections), at a dwelling level:

  • the presence of a Category 1 hazard for excess cold (using SAP ratings as a proxy measure)
  • the presence of a Category 1 hazard for falls
  • the presence of a Category 1 hazard for a hazard other than excess cold or falls
  • being in disrepair 

A dwelling is classed as being of poor quality housing if it is predicted to have any of the above features. Estimated data for individual dwellings are then aggregated to LSOA level to provide a rate of dwellings which are classed as poor quality housing for each LSOA.

Developing a housing stock model for Wales 

BRE have developed and used BRE housing stock models for many years. These dwelling level models are used to estimate the likelihood of a particular dwelling meeting the criteria of interest. These outputs can then be mapped to provide a geographical distribution of each of the indicators. The process itself is made up of a variety of data sources, calculations and models. 

The housing stock model developed for Wales consists of the following datasets: 

  • Ordnance Survey geographic data
  • Experian dwelling-level data
  • Xoserve data 

Other datasets were then integrated into this base model to provide enhanced information relating to dwelling tenure and dwelling energy data: 

  • Rent Smart Wales data
  • Welsh Housing Quality Standard (WHQS)
  • Land Registry Commercial and Corporate Ownership Data (CCOD)
  • Energy Performance Certificate (EPC) data

The Welsh address list was used as the spine to link the other datasets and to form the base data for the model. The dwelling level data for Wales was then used to produce the model for dwellings in disrepair and dwellings where at least one HHSRS Category 1 hazard was present. 

Determining HHSRS Category 1 hazards 

BRE have developed a method for determining whether a dwelling fails the HHSRS Excess cold hazard: the BRE SimpleCO2 simplified energy model is designed to approximate SAP scores using a minimal level of data. This is an ideal tool for situations where dwellings have not been surveyed in detail but a measure of their energy efficiency is needed. For the remaining HHSRS hazards, BRE’s standard logistic regression analysis was used. 

Determining disrepair 

To determine dwellings in disrepair, logistic regression analysis was used to establish relationships between disrepair and various dwelling and social characteristics. Once these relationships were established, they were used to create a regression model which calculates the probability of a dwelling failing the disrepair criterion. 

Determining the poor housing indicator 

For the 2019 indicators, data from the Welsh Housing Condition Survey (WHCS) was used to benchmark the modelled data; however, there has not yet been an update to the WHCS. Instead, notional 2023 benchmarks were estimated by comparing changes in each indicator for the West Midlands region between 2017 and 2023 and applying this change to the WHCS 2017 totals to create adjusted likelihoods.

A review of the latest English Housing Survey data indicated that regional housing characteristics had not changed significantly since the previous modelling exercise, and as such, the West Midlands was selected as the comparator region for Wales, consistent with the approach taken in the previous analysis.

Once the benchmarked model based on the disrepair and HHSRS components had been created, they were combined to make an overall poor quality housing Indicator. If a dwelling failed one or more of the components, then it failed the poor quality housing Indicator. The dwelling level outputs for Wales were then aggregated to LSOA level.

Community safety domain

The purpose of this domain is to measure deprivation relating to living in a safe community. It covers actual experience of crime and fire, as well as perceptions of safety whilst out and about in the local area. The domain has a relative weight of 5% in the overall index.

Indicators

Violence with injury

Type of indicator

Rate per 100 at risk population.

Numerator

Number of police recorded incidents in all sub-categories of ‘violence with injury’, plus all categories of ‘homicide’.

Denominator

Total resident population plus an estimate of the non-resident workplace population.

Source and time period

Police Recorded Crime collected by the Home Office; six years of financial year data from April 2018 to March 2024.

Total resident population (ONS), mid-year estimates 2018 to 2022.

Non-resident population: for the two ‘pre-pandemic’ financial years of 2018 to 2019 and 2019 to 2020, the non-resident workplace population was taken from the 2011 Census; for the two ‘pandemic’ financial years of 2020 to 2021 and 2021 to 2022, the non-resident workplace population was taken from the 2021 Census; and for the two ‘post-pandemic’ financial years of 2022 to 2023 and 2023 to 2024, the non-resident workplace population was constructed as the average of the 2011 and 2021 Census values. 

Additional notes

A full list of offence codes included in the indicator is provided in annex 8.1.

Comparability with WIMD 2019

Not comparable. This is a new indicator and one of four which replace the violence indicator from WIMD 2019.

Violence without injury

Type of indicator

Rate per 100 at risk population.

Numerator

Number of police recorded incidents in all sub-categories of ‘violence without injury’.

Denominator

Total resident population plus an estimate of the non-resident workplace population.

Source and time period

Police Recorded Crime collected by the Home Office; six years of financial year data from April 2018 to March 2024.

Total resident population, (ONS), mid-year estimates 2018 to 2022.

Non-resident population: for the two ‘pre-pandemic’ financial years of 2018 to 2019 and 2019 to 2020, the non-resident workplace population was taken from the 2011 Census; for the two ‘pandemic’ financial years of 2020 to 2021 and 2021 to 2022, the non-resident workplace population was taken from the 2021 Census; and for the two ‘post-pandemic’ financial years of 2022 to 2023 and 2023 to 2024, the non-resident workplace population was constructed as the average of the 2011 and 2021 Census values. 

Additional notes

A full list of offence codes included in the indicator is provided in annex 8.1.

Comparability with WIMD 2019

Not comparable. This is a new indicator and one of four which replace the violence indicator in WIMD 2019.

Stalking and harassment

Type of indicator

Rate per 100 at risk population.

Numerator

Number of police recorded incidents in all sub-categories of ‘stalking and harassment’.

Denominator

Total resident population plus an estimate of the non-resident workplace population.    

Source and time period

Police Recorded Crime collected by the Home Office; six years of financial year data from April 2018 to March 2024.

Total resident population, (ONS), mid-year estimates 2018 to 2022.

Non-resident population: For the two ‘pre-pandemic’ financial years of 2018 to 2019 and 2019 to 2020, the non-resident workplace population was taken from the 2011 Census; for the two ‘pandemic’ financial years of 2020 to 2021 and 2021 to 2022, the non-resident workplace population was taken from the 2021 Census; and for the two ‘post-pandemic’ financial years of 2022 to 2023 and 2023 to 2024, the non-resident workplace population was constructed as the average of the 2011 and 2021 Census values. 

Additional notes

A full list of offence codes included in the indicator is provided in annex 8.1.

Comparability with WIMD 2019

Not comparable. This is a new indicator and one of four which replace the violence indicator in WIMD 2019.

Public order offences

Type of indicator

Rate per 100 at risk population.

Numerator

Number of police recorded incidents in all sub-categories of ‘public order’ and ‘possession of weapon offences’.

Denominator

Total resident population plus an estimate of the non-resident workplace population.

Source and time period

Police Recorded Crime collected by the Home Office; six years of financial year data from April 2018 to March 2024.

Total resident population, (ONS), mid-year estimates 2018 to 2022.

Non-resident population: for the two ‘pre-pandemic’ financial years of 2018 to 2019 and 2019 to 2020, the non-resident workplace population was taken from the 2011 Census; for the two ‘pandemic’ financial years of 2020 to 2021 and 2021 to 2022, the non-resident workplace population was taken from the 2021 Census; and for the two ‘post-pandemic’ financial years of 2022 to 2023 and 2023 to 2024, the non-resident workplace population was constructed as the average of the 2011 and 2021 Census values. 

Additional notes

A full list of offence codes included in the indicator is provided in annex 8.1.

Comparability with WIMD 2019

Not comparable. This is a new indicator and one of four which replace the violence indicator in WIMD 2019.

Burglary

Type of indicator

Rate per 100 at risk properties.

Numerator

Number of police recorded incidents in all sub-categories of ‘burglary’.

Denominator

Residential dwellings at LSOA level from the 2021 Census plus non-residential properties at LSOA level from Ordnance Survey’s Address Base.

Source and time period

Police Recorded Crime data collected by the Home Office; six years of financial year data from April 2018 to March 2024.

Residential dwellings from the 2021 Census plus non-domestic properties from Ordnance Survey’s AddressBase Plus.

Additional notes

A full list of offence codes included in the indicator is provided in annex 8.1.

Comparability with WIMD 2019

Broadly comparable.

Theft

Type of indicator

Rate per 100 at risk population.

Numerator

Number of police recorded incidents in all sub-categories of ‘theft’ and ‘robbery’, except ‘shoplifting’.

Denominator

Total resident population plus an estimate of the non-resident workplace population.

Source and time period

Police Recorded Crime collected by the Home Office; six years of financial year data from April 2018 to March 2024.

Total resident population, (ONS), mid-year estimates 2018 to 2022.

Non-resident population: for the two ‘pre-pandemic’ financial years of 2018 to 2019 and 2019 to 2020, the non-resident workplace population was taken from the 2011 Census; for the two ‘pandemic’ financial years of 2020 to 2021 and 2021 to 2022, the non-resident workplace population was taken from the 2021 Census; and for the two ‘post-pandemic’ financial years of 2022 to 2023 and 2023 to 2024, the non-resident workplace population was constructed as the average of the 2011 and 2021 Census values. 

Additional notes

A full list of offence codes included in the indicator is provided in annex 8.1.

Comparability with WIMD 2019

Not comparable, there is likely to be a noticeable impact in urban areas with large numbers of those classed as ‘non-resident workplace population’ being included in the denominator for the first time, making these areas relatively less deprived. Consequently more rural areas (which will see little change in denominator) may move up the deprivation ranks as a result of the urban areas moving down.

Criminal damage

Type of indicator

Rate per 100 at risk population.

Numerator

Number of police recorded incidents all sub-categories of ‘criminal damage’ and ‘arson’.

Denominator

Total resident population plus an estimate of the non-resident workplace population.

Source and time period

Police Recorded Crime collected by the Home Office; six years of financial year data from April 2018 to March 2024.

Total resident population, (ONS), mid-year estimates 2018 to 2022.

Non-resident population: for the two ‘pre-pandemic’ financial years of 2018 to 2019 and 2019 to 2020, the non-resident workplace population was taken from the 2011 Census; for the two ‘pandemic’ financial years of 2020 to 2021 and 2021 to 2022, the non-resident workplace population was taken from the 2021 Census; and for the two ‘post-pandemic’ financial years of 2022 to 2023 and 2023 to 2024, the non-resident workplace population was constructed as the average of the 2011 and 2021 Census values. 

Additional notes

A full list of offence codes included in the indicator is provided in annex 8.1.

Comparability with WIMD 2019

Not comparable, there is likely to be a noticeable impact in urban areas with large numbers of those classed as ‘non-resident workplace population’ being included in the denominator for the first time, making these areas relatively less deprived. Consequently more rural areas (which will see little change in denominator) may move up the deprivation ranks as a result of the urban areas moving down.

Anti-social behaviour

Type of indicator

Rate per 100 at risk population.

Numerator

Number of incidents in all sub-categories of anti-social behaviour (ASB) that are reported to the police and are recorded as police incidents, which consists of incidents of ‘personal’, ‘environmental’ and ‘nuisance’ anti-social behaviour.

Denominator

Total resident population plus an estimate of the non-resident workplace population.

Source and time period

National Police Chiefs Council, Welsh police forces; two years of financial year data from April 2022 to March 2024.

Total resident population, (ONS), mid-year estimates 2018 to 2022.

Non-resident workplace component constructed as the average of the 2011 and 2021 Census values.

Additional notes

Incidents of ASB were provided for two financial years, April 2022 to March 2023 and April 2023 to March 2024. Although data for ASB were also reviewed for the April 2021 to March 2022 financial year, data for April 2021 to March 2022 were rejected due to concerns about geographical inconsistency of policing practices and recording practices relating to restriction ‘breaches’ during the pandemic period. To avoid introducing geographical biases, ASB data were therefore only included for the post-pandemic period.

A full list of offence codes included in the indicator is provided in annex 8.1.

Comparability with WIMD 2019

Not comparable, there is likely to be a noticeable impact in urban areas with large numbers of those classed as ‘non-resident workplace population’ being included in the denominator for the first time, making these areas relatively less deprived. Consequently more rural areas (which will see little change in denominator) may move up the deprivation ranks as a result of the urban areas moving down.

Fire incidents

Type of indicator

Rate per 100 at risk population.

Numerator

Number of fires attended by the fire and rescue services in Wales.

Denominator

Total resident population excluding prison population.

Source and time period

Home Office’s Incident Recording System; three years of financial year data April 2021 to March 2024.

Total resident population (ONS), mid-year estimates 2021 to 2022.

Prison population, Ministry of Justice.

Additional notes

This indicator captures actual experiences of fire. Incidents of all primary, secondary and chimney fires were collected as counts by LSOA. 

Incidents requiring call out of fire and rescue services are related to deprivation and more likely within disadvantaged groups. 

Primary fires comprise all fires in buildings, vehicles and outdoor structures or any fire involving casualties, rescues, or fires attended by five or more appliances. 

Secondary fires are the majority of outdoor fires including grassland and refuse fires unless they involve casualties or rescues, property loss or five or more appliances attend.

Chimney fires are reportable fires in occupied buildings where the fire was confined within the chimney structure and did not involve casualties or rescues or was attended by 5 or more appliances.

Comparability with WIMD 2019

Broadly comparable.

Domain construction

There are nine indicators in the community safety domain, weighted as follows. Factor analysis was used to calculate the indicator weights. 

  • 22% violence with injury
  • 22% public order offences
  • 18% criminal damage
  • 13% violence without injury
  • 8% stalking and harassment
  • 4% theft
  • 3% burglary
  • 8% anti-social behaviour
  • 2% fire incidents

The domain has a relative weight of 5% in the overall index.

Changes since WIMD 2019

There have been several methodological changes to the community safety domain between WIMD 2019 and WIMD 2025. 

The community safety domain now consists of 9 indicators, increased from 6 in WIMD 2019 (which were: violence, burglary, theft, criminal damage anti-social behaviour and fire incidents). For WIMD 2025 the violence indicator has been split into 3 separate violence-related indicators and a further indicator of public order and possession of weapons offences. These violence indicators better reflect the higher volume of violent crime relative to the other categories at national and sub-national levels. 

The domain now contains a more comprehensive suite of notifiable offences: whereas the WIMD 2019 violence and theft indicators were composed of selected subsets of overall violence and theft-related notifiable offences, the WIMD 2025 indicators are based on the full set of notifiable offence categories (with the exception of the exclusion of shoplifting from the theft indicator). 

The data period for the 7 indicators based on recorded crime have been extended from 2 years to 6. This extended time series increases the robustness of the data by reducing the effects of small number volatility that can be observed year-on-year in LSOA crime statistics, to better reflect underlying risk of victimisation. 

The data period for fire incidents has been extended from 2 years to 3 years. Numbers of fire incidents can be volatile and are often linked to weather conditions. Extending to a 3-year period means areas which are vulnerable to fires outdoors are more likely to be captured in the data. 

The denominators for 6 of the 7 crime indicators and the anti-social behaviour indicator now incorporate a calculation for the ‘non-resident workplace population’ to produce a derived estimate of ‘at-risk population’. This was deemed a better denominator than simply using resident population as it aims to account for the larger population at risk of victimisation in areas such as town and city centres (reflecting, for instance, the night-time economy and associated risk factors for victimisation). 

Prison populations are now included in this denominator, as concentrations of violent crime were found at prison locations, which suggests that the prison populations should be retained in the denominator as prisoners are at risk of victimisation.

Additional information

Methodology for police recorded data in this domain

Data on recorded crimes and ASB were collected and processed by deprivation.org on our behalf, using a method aligned with the English indices of deprivation 2025. Further details on the methodology can be found in the English indices of deprivation 2025 technical report (MHCLG).

The domain uses geocoded microdata on police recorded crime and ASB incidents, sourced from the Home Office Data Hub, Police.uk raw data, and bespoke police force extracts. Unlike anonymised public data, these datasets include full location details, enabling precise mapping. Due to sensitivity, all data processing occurred in secure police environments under National Police Chiefs’ Council (NPCC) agreements.

Individual crime and ASB records were aggregated to LSOAs using a bespoke mapping tool. Crimes within 10 metres of boundaries were apportioned across adjacent LSOAs, replacing the previous 100m buffer used in 2019 to reflect improved geocoding accuracy. 

Quality assurance included checks against aggregate police statistics and removal of anomalies, such as records outside force boundaries. Counts were constrained to Police Force Area totals to address unmapped records and avoid distortions from crimes geocoded to police premises.

Annex 8.1: categories of recorded crime and incidents of anti-social behaviour

Violence with injury

The WIMD 2025 ‘violence with injury’ indicator includes all Home Office sub-categories of homicide and violence with injury. All codes are available for financial years 2018 to 2019, to 2023 to 2024.

Table 8.1: Home Office offence codes used for the ‘violence with injury’ indicator
Offence codeOffence name
1Murder
4.1Manslaughter
4.1Corporate manslaughter
4.2Infanticide
2Attempted murder
4.3Intentional destruction of viable unborn child
5DAssault with intent to cause serious harm
5EEndangering life
4.7Causing or allowing death or serious physical harm of child or vulnerable person
8NAssault with injury
8PRacially or religiously aggravated assault with injury
8SAssault with injury on a constable
8TAssault with injury on an emergency worker (other than constable)

Violence without injury

The WIMD 2025 ‘violence without injury’ indicator includes all Home Office sub-categories of violence without injury. All codes are available for financial years 2018 to 2019, to 2023 to 2024.

Table 8.2: Home Office offence codes used for the ‘violence without injury’ indicator
Offence codeOffence name
3AConspiracy to murder
3BThreats to kill
11ACruelty to children/young persons
13Child abduction
14Procuring illegal abortion
36Kidnapping
104Assault without injury on a constable
105AAssault without Injury
105BRacially or religiously aggravated assault without injury
106Modern Slavery

Stalking and harassment

The WIMD 2025 ‘stalking and harassment’ indicator includes all Home Office sub-categories of stalking and harassment. All codes are available for financial years 2018 to 2019, to 2023 to 2024.

Table 8.3: Home Office offence codes used for the ‘stalking and harassment’ indicator
Offence codeOffence name
8LHarassment
8MRacially or religiously aggravated harassment
8QStalking
8RMalicious communication
8UControlling or Coercive behaviour

Burglary

The WIMD 2025 ‘burglary’ indicator includes all Home Office sub-categories of burglary.

Table 8.4: Home Office offence codes used for the ‘burglary’ indicator
Offence codeOffence nameApplicable years (financial years)
28EBurglary - Residential2018-19 to 2022-23
28FAttempted burglary - Residential2018-19 to 2022-23
28GDistraction burglary - Residential2018-19 to 2022-23
28HAttempted distraction burglary - Residential2018-19 to 2022-23
28IResidential burglary of a home2023-24
28JAttempted residential burglary of a home2023-24
28KDistraction burglary - residential (home)2023-24
28LAttempted distraction burglary - residential (home)2023-24
28MResidential burglary of unconnected building2023-24
28NAttempted residential burglary of unconnected building2023-24
28ODistraction burglary - residential (unconnected building)2023-24
28PAttempted distraction burglary - residential (unconnected building)2023-24
29AAggravated burglary -Residential2018-19 to 2022-23
29BAggravated burglary - residential (home)2023-24
29CAggravated burglary - residential (unconnected building)2023-24
30CBurglary - business and community2018-19 to 2023-24
30DAttempted burglary - business and community2018-19 to 2023-24
31AAggravated burglary - business and community2018-19 to 2023-24

Theft                 

The WIMD 2025 ‘theft’ indicator includes all Home Office sub-categories of robbery and theft, except shoplifting. All codes are available for financial years 2018 to 2019, to 2023 to 2024.

Table 8.5: Home Office offence codes used for the ‘theft’ indicator
Offence codeOffence name
34ARobbery of business property
34BRobbery of personal property
37.2Aggravated vehicle taking
45Theft from a vehicle
48Theft or unauthorised taking of a motor vehicle
126Vehicle interference
39Theft from the person
44Theft or unauthorised taking of a pedal cycle
35Blackmail
40Theft in a dwelling other than from an automatic machine or meter
41Theft by an employee
42Theft of mail
43Dishonest use of electricity
47Theft from automatic machine or meter
49Other theft
49AMaking off without payment

Criminal damage

The WIMD 2025 ‘criminal damage’ indicator includes all Home Office sub-categories of criminal damage and arson. All codes are available for financial years 2018 to 2019, to 2023 to 2024.

Table 8.6: Home Office offence codes used for the ‘criminal damage’ indicator
Offence codeOffence name
56AArson endangering life
56BArson not endangering life
58ACriminal damage to a dwelling
58BCriminal damage to a building other than a dwelling
58CCriminal damage to a vehicle
58DOther criminal damage
58JRacially or religiously aggravated criminal damage

Public order and possession of weapons

The WIMD 2025 ‘public order and possession of weapons’ indicator includes all Home Office sub-categories of public order and possession of weapons offences. All codes are available for financial years 2018 to 2019, to 2023 to 2024.

Table 8.7: Home Office offence codes used for the ‘public order and possession of weapons’ indicator
Offence codeOffence name
9APublic fear, alarm or distress
9BRacially or religiously aggravated public fear, alarm or distress
62AViolent disorder
66Other offences against the State or public order
10APossession of firearms with intent
10BPossession of firearms offences
10CPossession of other weapons
10DPossession of article with blade or point
81Other firearms offences
90Other knives offences

Anti-social behaviour

The WIMD 2025 ‘anti-social behaviour’ indicator includes all Home Office sub-categories of anti-social behaviour. All categories are available for financial years 2022 to 2023, and 2023 to 2024.

Home Office offence flags used for the ‘anti-social behaviour’ indicator

  • Personal
  • Environmental
  • Nuisance

Physical environment domain

The purpose of this domain is to measure factors in the local area that may impact on the wellbeing or quality of life of those living in an area. The domain has a relative weight of 5% in the overall index.

Indicators

Air quality score

The air quality sub-domain comprises three indicators based on the population weighted average concentration values of the following key pollutants:

  • Nitrogen dioxide (NO2)
  • Particulates less than 10 µm in diameter (PM10)
  • Particulates less than 2.5 µm in diameter (PM2.5)

NO2 is a gas that is mainly produced during the combustion of fossil fuels with a variety of negative health and environmental impacts.

Particulate matter (PM) is everything in the air that is not a gas and therefore consists of a huge variety of chemical compounds and materials. Some of these can be toxic. Depending on particulate size, they can enter the blood stream and become lodged in vital organs such as the heart or brain. 

More information on why NO2 and PM are measured can be found in their respective reports in DEFRA’s air quality statistical releases (GOV.UK). 

The indicators in the air quality sub-domain are created using measurements of pollutants that could have negative effects on human health and/or the environment, based on the best medical and scientific understanding, and are proposed as a proxy measure of the quality of the surrounding environment. Poor air quality suggests proximity to certain activities such as traffic, domestic combustion and industrial sites: activities that could have a negative impact on quality of life, the local environment and health. 

Type of indicator

The three separate indicators that form the air quality sub-domain are:

  • Population weighted average concentration value of NO2
  • Population weighted average concentration value of PM10
  • Population weighted average concentration value of PM2.5

The average concentration values are measured in micrograms per cubic metre (µg/m3).

Numerator

N/A

Denominator

N/A

Source and time period

The sources used to form the air quality indicators are:

  • pollutants data: Department for Environment, Food & Rural Affairs (DEFRA), 2023
  • Small Area Population Estimates (SAPE): Office for National Statistics, 2022
  • dwellings data: OS AddressBase, 2025 

Additional notes

Each year the UK Government’s Pollution Climate Mapping (PCM) model calculates average pollutant concentrations for each square kilometre of the UK. The model is calibrated against measurements taken from the UK’s national air quality monitoring network.

This data is combined with small area population estimates and dwelling data to provide population weighted data.

For each census output area (statistical geographic units comprising around 150 properties), the pollutant concentrations are weighted by the number of dwellings in each square kilometre to give an average NO2, PM2.5 and PM10 concentration across the census output area.

For each Lower layer Super Output Area (LSOA), a population-weighted average over its constituent census output areas were calculated to give an average NO2, PM2.5 and PM10 concentration.

Comparability with WIMD 2019

Broadly comparable. From the 2022 update of the air quality national well-being indicators onwards, a methodological improvement was implemented to the way in which the dwelling weights are calculated, as the original process used for estimating the air quality indicators (prior to 2022, including WIMD 2019 indicators) was not calculating the weights in the way intended. An assessment of the impact on the historic data has been undertaken and the impact is small. Given that the air pollution data is modelled and the population estimates are subject to rebasing following the Census, there is existing uncertainty associated with these estimates. Due to this uncertainty, the lack of detailed historic dwelling data and the small impact of the methodological change, the historic data has not been revised.

Flood risk score

Type of indicator

The flood risk indicator considers the proportion of households at risk of flooding from rivers, the sea and surface water flooding but it does not account for flood defences. A flood risk score between 1 and 100 is generated for each LSOA (see below for further information).

Numerator

N/A

Denominator 

N/A

Source and time period 

Flood Risk Assessment Wales (FRAW) data, Natural Resources Wales (NRW), 2025

Additional notes

The flood risk indicator considers the proportion of households at risk of flooding from rivers, the sea and surface water flooding but it does not account for flood defences. The risk is based on predicted frequency, rather than the level of damage caused by flooding.

The risk categories used are as follows:

  • low risk - less than 1 in 100 (1%) chance in any given year
  • medium risk - less than 1 in 30 (3.3%) but greater than or equal to 1 in 100 (1%) chance in any given year
  • high risk - greater than or equal to 1 in 30 (3.3%) chance of flooding in any given year 

To ensure the areas at risk of more severe flooding rank as more deprived than areas at risk of less severe flooding, the following weighting was given: 

  • the number of households in an area at high risk was multiplied by 24
  • the number of households in an area at medium risk was multiplied by 4
  • the number of households in an area at low risk was multiplied by 1

More information on the methodology for deriving the above weights is available at annex 9.1.

Note that, in cases where households were at different levels of risk from different types of flooding, the highest risk level was given priority. Each of these numbers is calculated for each LSOA and then added together to give total normalised number of households at a risk of flooding per LSOA. This number is then divided by the total number of households in the LSOA to give the proportion of households at risk of flooding. These values are then ranked and exponentially transformed to produce an overall flood risk score.

Comparability with WIMD 2019

Broadly comparable.

Proximity to accessible natural green space

Type of indicator

Proximity to accessible natural green space is the percentage of households in each LSOA that are within 300 metres (an approximate 5 minute walk) of an accessible natural green space.

Numerator

Counts of residential dwellings at an LSOA level within 300 metres of an accessible, natural green space.

Denominator 

Number of residential dwellings in LSOA.

Source and time period

The following sources were used to form this indicator:

  • properties in scope: Ordnance Survey's National Geographic Database (NGD) Built Address, September 2025
  • OS MasterMap Topography Layer®, September 2025
  • OS Open Greenspace, September 2025
  • National Trails: NRW, accessed October 2025 (publication date 18 June 2025)
  • NRW Open Access, accessed September 2025
    • Open Country
    • Other Statutory Access Land
    • Registered Common Land
    • Other Dedicated Land
    • Dedicated Forests

Additional notes

This indicator measures the proportion of households in each LSOA that are within 300 metres (an approximate 5 minute walk) of an accessible natural green space. To calculate this indicator, Greenspace footprints were derived from OS MasterMap Topography Layer®, scope defined by OS Open Greenspace combined with NRW’s recognised natural greenspace typologies, National Trails and typologies containing Open Access from the Countryside Rights of Way Act 2000. The output highlights sites that could confidently be described as natural feeling places to which the public have right of access. Sites such as golf courses, allotments and cemeteries were excluded from the list. To approximate a 5 minute walk, polygons with a radius of 300 metres around the green space sites were created. All in scope residential dwellings (sourced from OS NGD Built Address) were then intersected with these polygons and flagged if they were within 300 metres of an accessible, natural green space. Counts of dwellings were then aggregated to an LSOA level to calculate the proportion of dwellings within 300 metres of an accessible, natural green space. Further detail on the derivation of this indicator can be found in annex 9.2.

Comparability with WIMD 2019

Somewhat comparable. This indicator is an updated version of the 2019 indicator and now includes the addition of National Trails.

Ambient green space score

Type of indicator

This indicator measures the ambient greenness within each LSOA. A Mean Normalised Difference Vegetation Index (NDVI) is generated for each LSOA.

Numerator

N/A

Denominator 

N/A

Source and time period

The indicator was generated by Population Data Science, Swansea University. To generate the indicator the following sources were used:

  • NDVI values for this indicator, 3m surface reflectance satellite imagery from Planet, 2024
  • residential dwellings were sourced from AddressBase® Plus, 2025

Additional notes

This indicator measures the ambient greenness within each LSOA. It is calculated as the NDVI within a 300 metre Euclidean buffer around each residential dwelling. Euclidean buffers are not bound to the boundary of an LSOA as it is recognised that an LSOA’s geography does not necessarily represent human behaviour. This removes any edging effect whereby a household may be located within a particular LSOA but their Euclidean buffer overlaps another. The NDVI calculates the normalised difference between the red and infrared bands for quantitative and standardised measurement of vegetation presence and health. Healthy vegetation has a high reflectance of Near-Infrared wavelengths and greater absorption of red wavelengths due to a greater chlorophyll composition. The Near-Infrared (NIR) and red (R) spectral channels of an image are used to calculate an index value, using the following equation:

NDVI=(NIR-R)

(NIR+R)

To calculate NDVI values for this indicator, we sourced 3m surface reflectance satellite imagery from Planet. Residential dwellings were sourced from AddressBase® Plus.

Comparability with WIMD 2019

Somewhat comparable. In 2019 NDVI scores were generated using aerial photography (with a 50 cm resolution), for WIMD 2025 satellite imagery (with a 3m resolution) was used. Therefore, we would expect some natural variation as a result of the change in image source.

Noise pollution

Type of indicator

Proportion of population exposed to a combined road and rail Lden greater than or equal to 55dB. Lden stands for Day-Evening-Night Level, and is used to describe average noise exposure over a 24-hour period, with penalties applied for evening and night-time noise.

Numerator

Population within LSOA exposed to a combined road and rail Lden greater than or equal to 55dB.

Denominator

Population of LSOA.

Source and time period 

Round 4 strategic noise maps, Noise Modelling System (NMS), Department for Environment, Food and Rural Affairs (DEFRA). Data relates to 2021.

Population: Census 2021, ONS.

Additional notes

Further detail on the derivation of this indicator can be found in annex 9.3.

Comparability with WIMD 2019

Not comparable as it is a new indicator.

Domain construction

There are 7 indicators split into 4 sub-domains that form the physical environment domain, weighted as follows. The sub-domain weights were agreed with the expert domain group, and 5% of each WIMD 2019 sub-domain weight is allocated to the new noise pollution sub-domain. 

  • Air quality, 35%, formed of the following indicators that contribute equally to the sub-domain:
    • Nitrogen dioxide (NO2)
    • Particulates less than 10 µm (PM10)
    • Particulates less than 2.5 µm (PM2.5)
  • Flood risk, 35%
  • Green space, 15%, formed of the following indicators that contribute equally to the sub-domain:
    • Proximity to accessible, natural green space
    • Ambient green space score
  • Noise pollution, 15%

The domain has a relative weight of 5% in the overall index.

Air Quality sub-domain

To calculate the overall air quality sub-domain score, each indicator value was adjusted (via transformation) using a factor based on the objective, standard or risk factor for that specific pollutant and statistic. This method was developed to take into account air quality standards for each substance, which are based on the best medical and scientific understanding of their effects on health and/or the environment. The method also ensures that areas which have high prevalence of certain pollutants, but not others, are ranked as highly deprived; low levels of one pollutant will not cancel out the effect of a high level of another pollutant. 

The standards used to normalise the concentrations of these pollutants in WIMD 2025 are the World Health Organization (WHO) final interim targets for each pollutant:

  • NO2: 20µg/m3 annual average concentration
  • PM10: 20µg/m3 annual average concentration
  • PM2.5: 10µg/m3 annual average concentration

The transformed indicator values for each LSOA were averaged and ranked. These ranks were then exponentially transformed to produce a sub-domain score for each LSOA.

Green Space sub-domain

To calculate the overall green space sub-domain score, each set of indicator values was ranked and normalised. The normalised values were then combined using the following weighting:

  • 50% proximity to accessible, natural green space
  • 50% ambient green space score 

The combined values were then re-ranked and exponentially transformed to produce a sub-domain score for each LSOA.

Changes since WIMD 2019

There have been several methodological changes to the physical environment domain between WIMD 2019 and WIMD 2025. A full list of the changes is outlined below.

Noise pollution has been added as a new indicator; it is based on the proportion of the population exposed to noise pollution from road and rail sources greater than or equal to 55dB.

In the proximity to accessible natural green space indicator, national trails have now been included in this indicator, further detail of this is in the indicator section.

For the ambient green space indicator, the data source has changed for WIMD 2025 compared to WIMD 2019. In 2019 NDVI scores were generated using aerial photography (with a 50 cm resolution), for WIMD 2025 satellite imagery (with a 3m resolution) was used.

The weightings of the sub-domains have been updated for WIMD 2025 to account for the addition of the noise pollution indicator. In WIMD 2019 the sub-domains were weighted as follows:

  • 40% air quality (3 equally weighted pollutant indicators)
  • 40% flood risk
  • 20% green space (of which half came from each of ambient green space and proximity to green space)

For WIMD 2025 the sub-domains are weighted as follows:

  • 35% air quality (3 equally weighted pollutant indicators)
  • 35% flood risk
  • 15% green space (of which half came from each of ambient green space and proximity to green space)
  • 15% noise pollution

Additional information

In addition to domain ranks and indicator values, physical environment sub-domain ranks are also published on StatsWales.

Annex 9.1: flood risk category weightings

The flood risk indicator considers the proportion of households at risk of flooding from rivers, the sea and surface water flooding. The risk is based on predicted frequency rather than the level of damage caused by flooding. The numbers of households at significant risk of flooding are given higher weighting than those at lower risk. Due to variability in the availability of data flood defences have not been taken into account when assigning flood risk categories.

The weighting methodology outlined in this annex was developed in partnership with Natural Resources Wales.

The weighting factors use the below risk categories, the same were used for WIMD 2019 as outlined in the 2019 technical report.

Table 9.1 weighting factor risk categories for calculating flood risk
NaFRA CategoryDefinition (chance of flooding in any given year)% of residential properties at risk of floodingWeighting
HighGreater than or equal to 1 in 300.60%0.06 (or 24)
MediumLess than 1 in 30 but greater than or equal to 1 in 1001.30%0.01 (or 4)
LowLess than 1 in 100 but greater than or equal to 1 in 10005.60%0.0025 (or 1)
Very LowLess than 1 in 1000.0.05%0.0025 (or 1)

In WIMD 2025, the flood risk indicator is produced from Flooding Risk Assessment Wales (FRAW) data provided by Natural Resources Wales. The FRAW data uses the same risk categories as the NaFRA data (with the exception of the ‘very low’ risk category) and therefore we have used the same flood risk weightings that were derived for WIMD 2019.

Methodology for determining weights

As for the previous two indices, we use information on average flooding damages as produced by the Middlesex University Flood Hazard Research Centre in their Multi Colour Manual. 

The underlying assumption is that the impact on quality of life increases as potential flood damage rises. 

The Weighted Annual Average Damage (WAAD) represents the expected annualised economic damage from flooding, weighted by the probability of different flood events occurring. It is calculated as the area under the curve when plotting flood damage values against exceedance probability (the reciprocal of the return period in years). This approach accounts for both the severity and likelihood of flooding events.

  • Damage values are derived from modelled events for specific return periods (e.g., 5, 10, 25, 50, 100 years).
  • No differentiation is made between residential property types.
  • WAAD calculations are based on properties within Flood Zone 2 (greater than 0.1% annual chance of flooding).
  • For extreme events, more properties are affected, but average flood depths tend to remain below 1 metre.

The WAAD Estimation Tool, provided in the Multi-Coloured Manual, is designed to estimate potential benefits from reducing flood risk to properties. These benefits are expressed as economic damages avoided over a standard 50-year appraisal period.

Table 9.2: example damage values (Economic Appraisal Manual, 2013)
Flood FrequencyDamage (£)
59,500
1017,847
2519,716
5027,776
10030,877

WAAD ratios are then used to derive WIMD weights.

Table 9.3 summary of assumptions to derive WIMD weights
Return PeriodExceedance ProbabilityWAAD ValueWAAD RatioWIMD ValueWIMD Ratio
300.0333497623.50.0624
1000.017673.60.014
10000.00121110.00251

This ensures that areas with higher expected flood damages receive proportionately higher weights in the deprivation index.

Annex 9.2: proximity to accessible, natural green space calculation

Definition of accessible, natural green space

The definition for accessible, natural green space closely follows Natural Resource Wales’ (NRW) Greenspace toolkit.

The data set compiled to calculate the proximity to accessible, natural green space indicator in WIMD 2025 comprises, and builds on, a series of rules for accessibility and naturalness that can confidently be said to be natural-feeling places to which the public have a legal right of access.

NRW and Welsh Government recognise that this definition is not all encompassing and that citizens may perceive many more spaces (including urban parks) as natural. Further, there are many more accessible spaces than are defined by law. Therefore, to enhance this definition, urban and coastal coverage (polygons representing urban and coastal green and blue spaces) have been used to supplement data gaps. Note that these additional polygons are ‘likely’ to be accessible but do not strictly indicate legal right of access.

This definition serves to show all land and water in Wales that are not covered in man-made surfaces and could therefore potentially deliver health or well-being benefits. 

We are aware that this data set excludes some polygons which deliver ecosystem services (e.g. cycle paths, man-made play areas), but because the focus of this data set is on spaces which deliver health and well-being benefits by virtue of the natural nature of their surfaces we have deliberately excluded these.

NRW tested this rule-base by undertaking comparisons with aerial imagery as well as creating maps of familiar urban and rural areas to compare and verify the rule base delivered the intended result.

Data sources

Definition of accessible, natural greenspaces
  • All polygons from Ordnance Survey MasterMap Topography Layer® that satisfy the ‘natural’, ‘multiple’ and ‘unknown’ make classification. For these polygons to pass through to the final inclusion stage they must geographically intersect with.
  • All polygons detailing Open Access from the Countryside Rights of Way Act 2000. The Act gives a right of access on foot for the purpose of open-air recreation and, in Wales, the right given under the Act commenced in May 2005. Layers included are:
    • Dedicated Forests
    • Other Dedicated Land
    • Open Country
    • Other Statutory Access Land
    • Registered Common Land

Supplementary green spaces to account for urban and coastal accessibility follow the definition of:

  • all polygons from Ordnance Survey MasterMap Topography Layer® whose descriptive group satisfies the ‘tidal water’ classification
  • all ‘natural’, ‘multiple’ or ‘unknown’ polygons from Ordnance Survey MasterMap Topography Layer® that intersect within the extent of OS Open Greenspace polygons, that adhere to the following typologies:
    • public parks or garden
    • playing field
    • play space
    • other sports facilities

Certain national trails follow roads which are not one of the above descriptions to include. The approach has been taken to buffer the trail by 300 metres and find the properties that intersect this buffer.

Routing methodology

Both network analysis and Euclidean distances (an ‘as the crow flies’ approach) were considered for modelling the travel-time for a residential dwelling’s degree of proximity to accessible natural green spaces. However, whilst network analysis is highly representative of real-world behaviours and the favoured approach, Welsh Government recognise inconsistencies and significant data gaps in both greenspace polygon access point data and a nationally consistent path network. Therefore, applying network analysis would be nationally inconsistent and unfit for WIMD at this present time.

Although Euclidean distances do not take into account real-world obstacles, their production can be nationally consistent and provide a statistically robust method to calculate the areas of accessibility around greenspaces. Therefore, Euclidean distances were used to produce the travel-time polygons around the green space data set for the purposes of WIMD 2019. 

It is widely accepted that residential dwellings are classified as having sufficient access to accessible natural greenspaces if they can reach sites within a 5-minute walk. In a study undertaken by the University of Manchester for the formerly known Countryside Council of Wales, (now NRW) there is clear evidence to show that, generally, citizens are highly unlikely to walk beyond the 5-minute threshold to access local green infrastructure. 

On average, a 5-minute walk roughly covers approximately 400 metres in distance. To account for the shortcomings of a Euclidean distance methodology, time-travel polygons were produced with a 300-metre radius to account for real-world obstacles in green space access.

All in scope residential dwellings (as sourced from OS NGD Built Address) were then intersected with time-travel polygons to flag whether they were within a 5-minute walk to an accessible natural greenspace according to the definition. 

Dwellings were then aggregated to Lower Super Output Area (LSOA) and the percentage of total dwellings within proximity of an accessible natural greenspace calculated.

Annex 9.3: noise pollution

Scope and background

Noise Consultants Limited (NCL) were appointed by the Welsh Government Environmental Protection Division in 2021 to prepare the Round 4 strategic noise maps and associated noise exposure statistics in Wales. NCL partnered with Mott MacDonald, Oden Systems, Acustica and Stapelfeldt (the ‘Project Team’) to develop the model and provide the required outputs. The maps and models were delivered to Welsh Government in 2023.

The requirement to produce strategic noise maps is due to the Environmental Noise (Wales) Regulations 2006. The Regulations require the following to be mapped:

  • major roads (those with over 3 million annual movements)
  • major railways (those with over 30,000 annual train passages)
  • major airports (those with over 50,000 annual movements)
  • sources in agglomerations (industry, road and rail sources)

The Regulations require that noise mapping is undertaken every 5 years. To date, there have been four rounds of strategic noise mapping, with the most recent round (Round 4) based on the situation in 2021. 

The model data and associated results used for the derivation of LSOA noise exposure statistics are taken from the Round 4 strategic noise mapping model and results. The noise mapping results therefore relate to the year 2021.

Following completion of the mapping, Welsh Government contacted NCL seeking to understand the feasibility of providing noise exposure statistics based on the results of the road and rail noise mapping for Wales at LSOA level, to factor into WIMD 2025. 

NCL had already completed and delivered LSOA-level noise exposure statistics to Deprivation.org to factor into the English Indices of Deprivation 2025, therefore to ensure consistency, the approach adopted for the Welsh LSOA noise-exposure statistics was similar.

Derivation of noise exposure statistics

Statistical boundary dataset

To produce the noise exposure statistics at LSOA level, the LSOA boundary dataset was sourced from the Office for National Statistics Open Geography Portal.

Noise metrics

Noise exposure statistics were produced from the noise mapping results for the Lden noise metric. The Lden noise metric, also referred to as the ‘day-evening-night level’, represents the annual average long-term noise over 24 hours, and includes the application of a 5 dB(A) penalty for noise within the evening period (19:00-23:00) and 10 dB(A) penalty for noise within the night time period (23:00-07:00). 

The penalties are applied to account for the increased sensitivity to noise levels within these periods.

The Lden noise metric is widely used in health effect studies, linking long term noise exposure to the risk of ischaemic heart disease (IHD), hypertension, stroke and annoyance. This metric is therefore considered appropriate for the WIMD. More information can be found in the World Health Organization’s Environmental Noise Guidelines for the European Region.

Noise sources included

The LSOA noise exposure statistics uses the Round 4 noise mapping results from road traffic and railway noise sources, where every public road and railway in Wales has been modelled and mapped. Industry noise in Round 4 has been modelled at a relatively high-level in comparison to road and rail, and is only modelled within agglomerations. Industry noise was therefore considered inappropriate for inclusion within the LSOA noise exposure statistics, and combined exposure data is based on the Round 4 road and railway sources only.

Overview of processing steps

This section provides a summary of the processing steps undertaken to generate the LSOA noise exposure statistics. A more detailed overview of the process undertaken to produce the LSOA-level noise exposure statistics is presented in Appendix A1.

Create road and rail building level results

The calculation of noise exposure at building level for road and railway sources requires associating modelling results for building façade receivers with the number of dwellings within buildings, as well as the assignment of the number of people to each dwelling. 

The approach to assigning calculated levels at the façade receivers to dwellings and people in dwellings is set out in CNOSSOS-EU. Three methods are available, summarised below:

Method 1: the location of individual dwellings is known

Where the location of individual dwellings is known (such as with detached, semi-detached, terraced houses, or apartment buildings where the internal division of the buildings is known), the dwelling and number of people within the dwelling is assigned to the façade receiver point at the most exposed façade of the dwelling. 

Method 2: information is available showing that dwellings are arranged within an apartment such that they have a single façade exposed to noise 

Method 2 applies to apartment blocks that have all windows within each apartment only facing one direction. Under this method, the dwellings and people in dwellings are assigned to all façade receivers associated with the building, weighted by the façade length that each façade receiver represents, resulting in the dwellings and number people within the dwellings being assigned the lowest, median, and highest calculated noise levels around the building façade.

Method 3: information is available showing that dwellings are arranged within an apartment building such that they have more than one façade exposed to noise

Method 3 applies to apartment buildings that have dwellings with windows facing more than one direction. This approach is also to be considered the default in situations where the layout of dwellings within a building is unknown. Under this method, the dwellings and people within dwellings are assigned noise levels above the median of all building façade receivers.

It has not been possible to consider Method 2, given that the layout of dwellings within the buildings considered in the Round 4 maps is unknown. Therefore:

  • method 1 has been applied to buildings with one dwelling; and
  • method 3 has been applied to all other multi-dwelling residential buildings.

Noise levels were assigned to population and dwellings using the methods described above by merging attribute data from the building’s dataset, façade receiver dataset, and all required information within the model results files. The estimated exposure results were output at each building for each representative receptor and each 1 dB noise exposure band for all calculated noise metrics, including Lden.

Assign LSOA code to extracted road and rail results

Spatial analysis was undertaken to identify the LSOA boundary that each building is within, and assign the building with its corresponding LSOA code (‘LSOA21CD’) and name (‘LSOA21NM’).

Calculate the consolidated noise level at the buildings

A consolidated noise level combining the building-level road and rail noise levels was calculated by means of logarithmic summation, as follows:

Derivation of LSOA noise exposure statistics

The processing set out above produced a building dataset where each building was attributed with the following:

  • LSOA code and name
  • population
  • consolidated noise exposure (road and rail combined, Lden)
  • road traffic noise exposure (Lden)
  • railway noise exposure (Lden)

The attributed data was used to calculate the total population and population exposed to road, rail, and consolidated Lden, and output as a CSV file that included the population exposed to road, rail, and consolidated noise per LSOA in 1 dB bandings from 40 dB up to >=75 dB and the total population as calculated from the building results layer per LSOA.