Young people not in education, employment or training (NEET): April 2019 to March 2020
Data for young people by age, gender, region and local authority for April 2019 to March 2020.
In this page
1. Main points
Participation of adults and young people on StatsWales
16 to 18 year olds
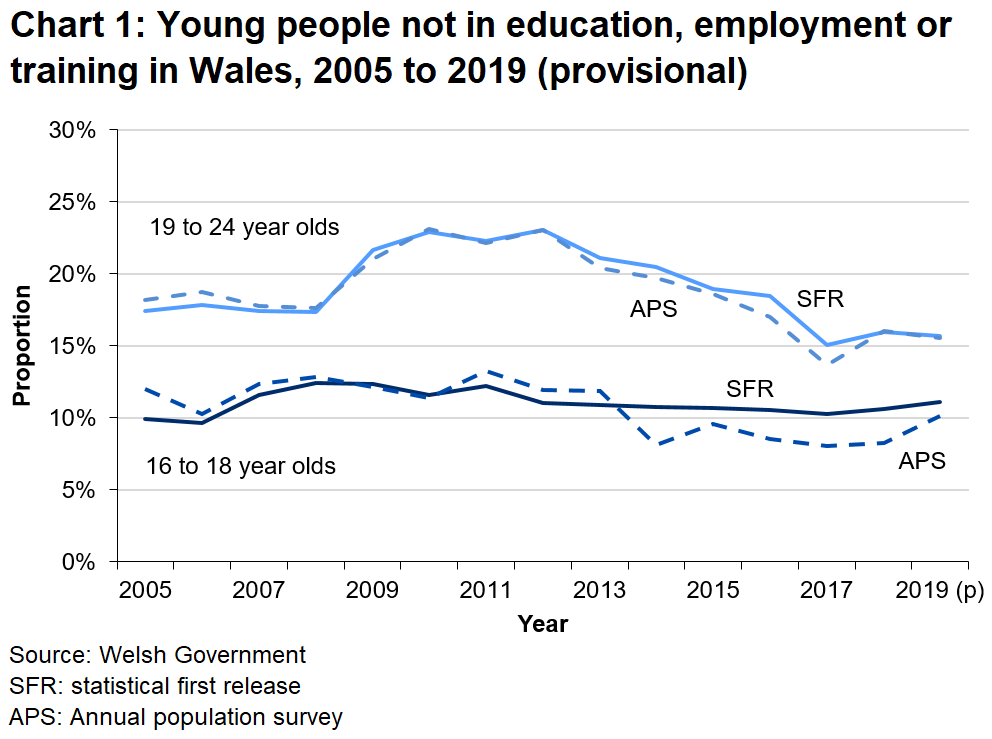
- Overall, the proportion of 16 to 18 year olds who are NEET had been gradually decreasing between 2011 and 2017, but increased slightly in the last two years. The size of this increase varies depending on the source used.
- On the statistical first release basis (SFR), at end 2019 11.1% of 16 to 18 year olds were NEET (11,200) compared with 10.6% (10,800) at end 2018.
- On the Annual Population Survey (APS) basis, for the year ending 2020 Quarter 1, 9.2% of 16 to 18 year olds were estimated to be NEET, compared with 8.2% at the year ending 2019 Quarter 1.
19 to 24 year olds
- On the SFR basis, at end 2019 15.7% of 19 to 24 year olds were NEET (37,400) a decrease compared with 16.0% (38,500) in 2018.
- After the start of the 2008 recession the proportion of 19 to 24 who were NEET saw a large increase from 17.4% in 2008 to around 22% to 23% from 2009 to 2012, decreasing in each subsequent year up to 2017. The decrease was driven by increased labour market activity, with participation in education and training remaining fairly stable.
- On the APS basis, for the year ending 2020 Quarter 1, 15.4% of 19 to 24 year olds were estimated to be NEET, compared with 16.2% for the year ending 2019 Quarter 1.
2. Proportion of young people not in education, employment or training, by characteristic
Gender
From the SFR series it is also possible to produce a gender split of the proportion of young people who are NEET.
16 to 18 year olds
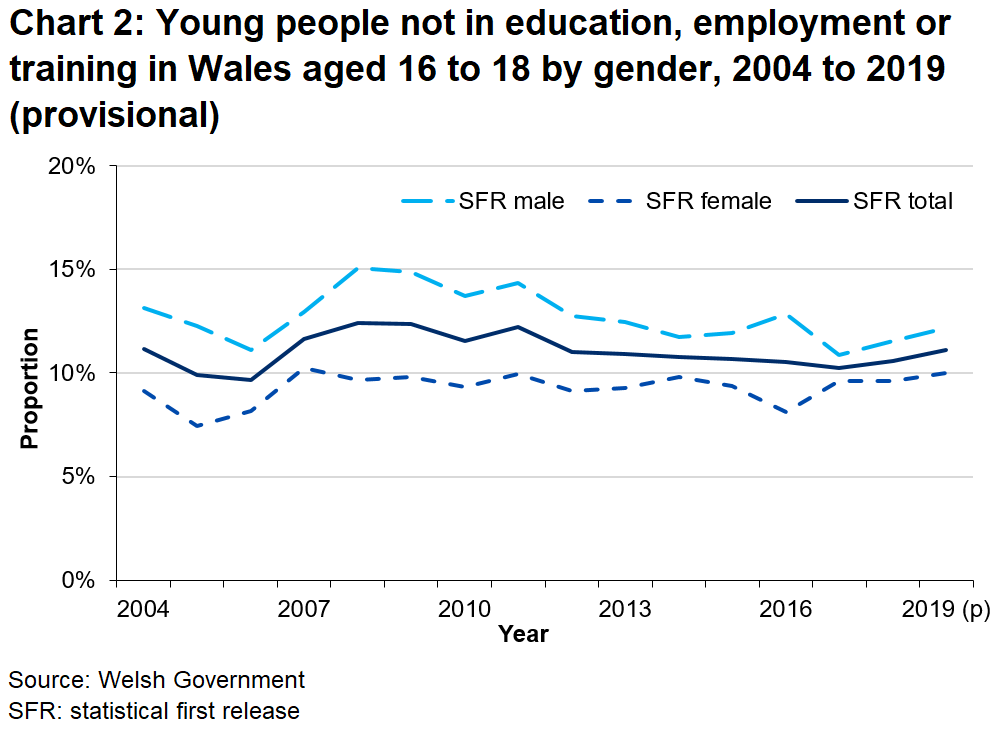
Chart 2 shows that the proportion of males and females aged 16 to 18 who are NEET have broadly followed similar trends between 2004 and 2019, with females less likely to be NEET than males due to higher levels of participation in education and training. Provisional figures for 2019 indicate:
- 12.2% (6,300) of males aged 16 to 18 were NEET, compared to 11.5% (6,100) in 2018
- 10.0% (4,900) of females aged 16 to 18 were NEET, an increase from 9.6% (4,700) in 2018
Participation of adults and young people on StatsWales
19 to 24 year olds
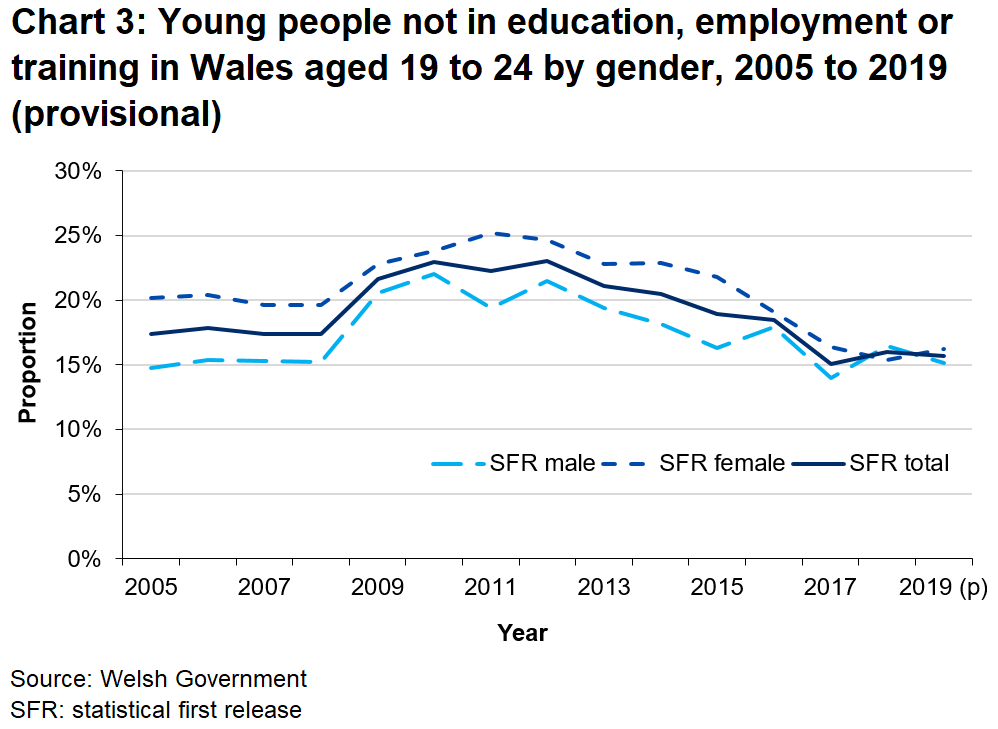
The proportions of males and females aged 19 to 24 who were NEET have been converging over time.
The proportion of females who are NEET had consistently been higher than males across this series until 2018, where a slightly larger proportion of males were NEET than females. This again reversed in 2019 according to the provisional figures.
Provisional figures for 2019 indicate:
- 15.2% (18,900) of males aged 19 to 24 were NEET, a decrease from 16.5% (20,900) in the previous year
- 16.3% (18,500) of females aged 19 to 24 were NEET, an increase from 15.4% (17,700) in the previous year
Participation of adults and young people on StatsWales
Age
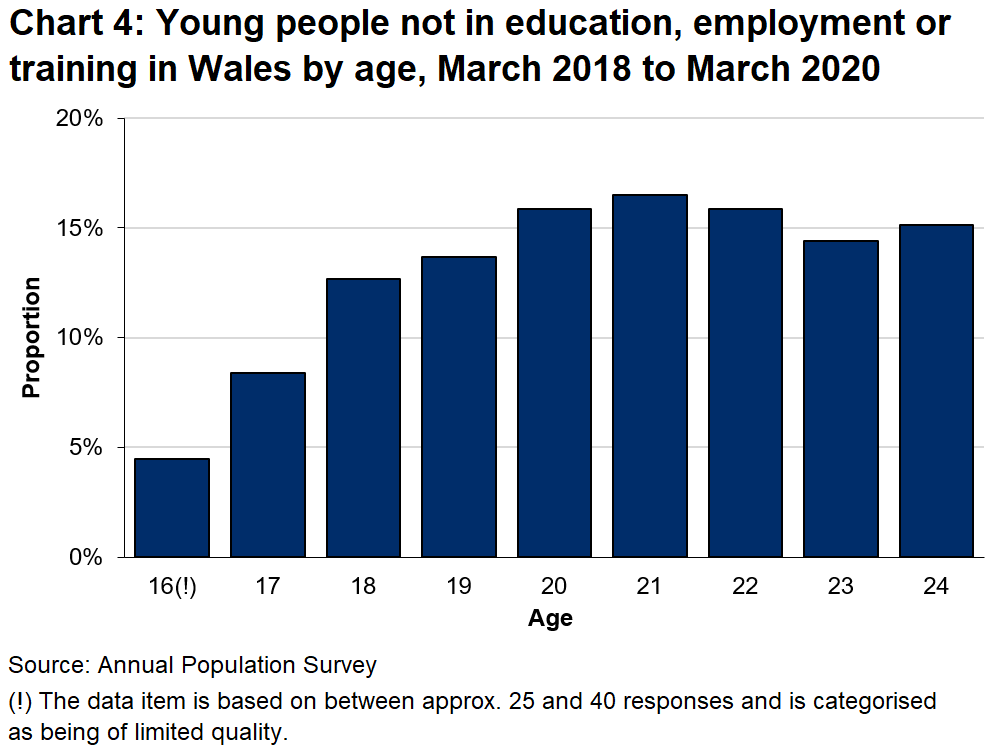
The Annual Population Survey can be used to provide analysis of NEET rates by characteristics which are not available via the SFR series. Due to small sample sizes, when looking at sub-groups it has been necessary to use estimates based on the average of 3 periods and therefore should be used to compare groups or regions only.
Participation of adults and young people on StatsWales
The proportion of young people that are NEET generally increases with age. The rates range from 4.5% for young people aged 16 to 16.5% for those aged 21.
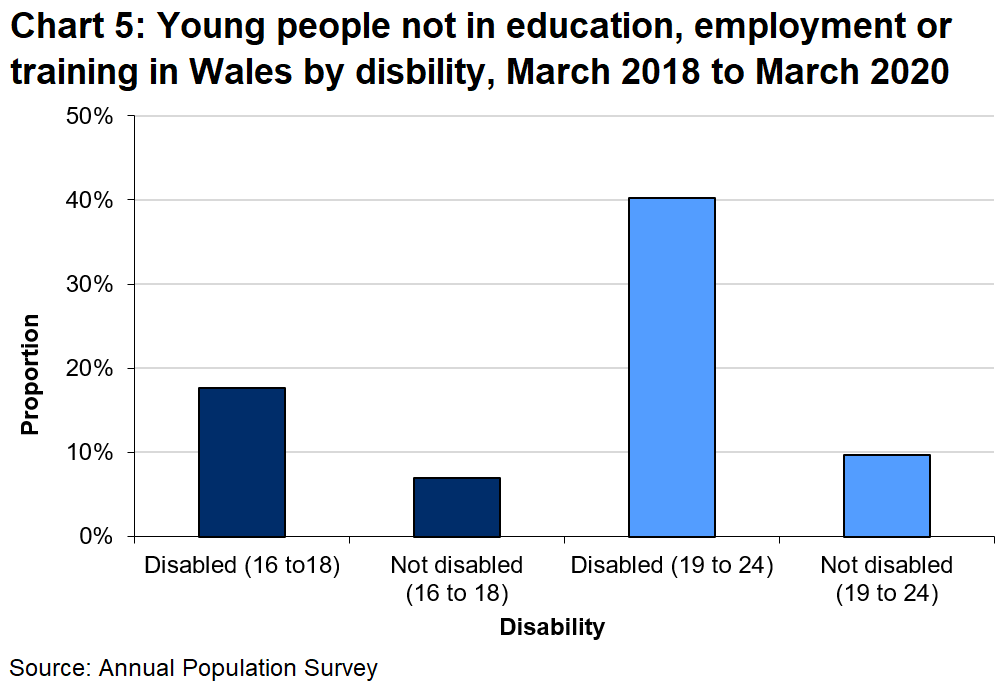
Disability
Participation of adults and young people on StatsWales
- The proportion of young people who are NEET is higher for disabled people for both age groups.
- Disabled young people are more likely to be NEET than young people that are not disabled. This difference is even more pronounced for 19 to 24 year olds compared to 16 to 18 year olds. The proportion of disabled people who are NEET rises from 17.7% at age 16 to 18 to 40.3% at age 19 to 24.
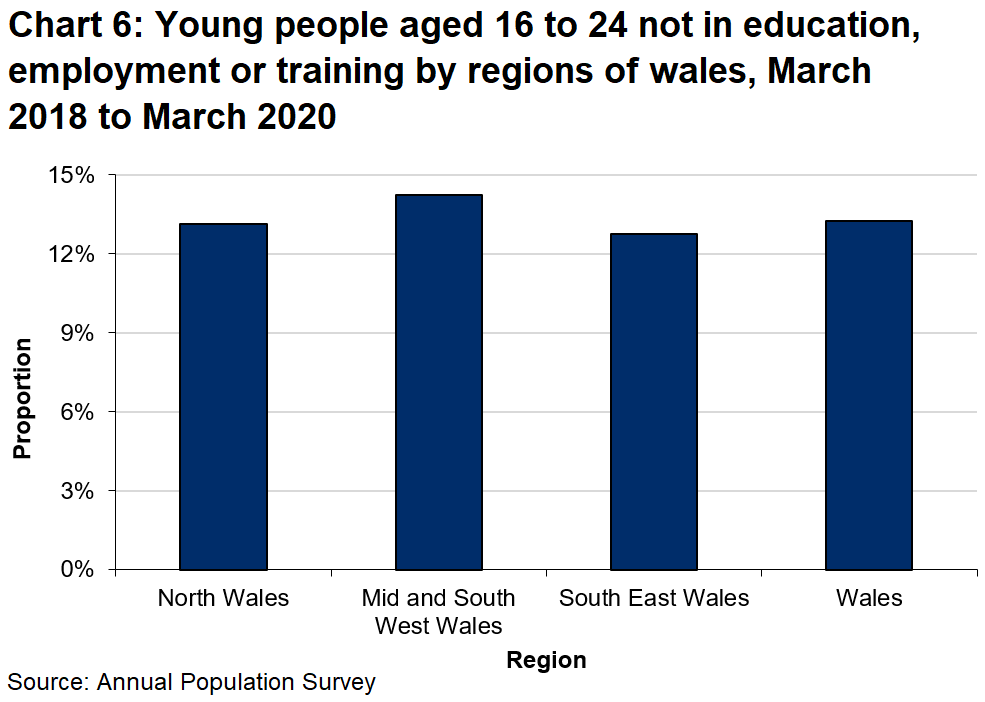
Region
Participation of adults and young people on StatsWales
- There are small differences in NEET rates between regions. The proportion of young people (aged 16 to 24) who are NEET varied from 12.8% in South East Wales to 14.2% in Mid and South West Wales.
3. Definitions
Education and training
For the SFR estimates: it is based on those who are enrolled on a course in a school, further education college, higher education institution (including the Open University) or with a work-based learning provider in Wales. In addition, an estimate is made of the number of those in employment who undertake off-the job training.
For the APS based estimates: respondents to the APS who are either:
- currently carrying out an apprenticeship
- currently on a government employment or training scheme
- currently working or studying towards any qualifications
- hve undertaken any job-related education or training in the previous 4 weeks
- currently enrolled on any full-time or part-time education course excluding leisure classes and are still attending or waiting for term to (re)start.
Employment
The APS is used to estimate the proportion in employment for both the SFR and APS based estimates. In addition employment status from post-16 enrolment data is used in the SFR.
From the APS respondents are in employment if they are either:
- employed
- self-employed
- on government employment or training programmes
- an unpaid family worker
Disability
The Welsh Government accepts the social definition of disability, in which it is recognised that barriers in society act to disable people who have impairments or health conditions or who use British Sign Language.
The Annual Population Survey, which is the source of data for this release, captures data using the medical definition of disability used in the Equality Act 2010 (“a physical or mental impairment which has a substantial and long-term impact on a person’s ability to carry out normal day to day activities”). Figures within this release are not comparable to those within releases prior to 2015, which reported those reporting DDA current disability or work-limiting disability.
4. Quality information
This release summarises the available statistics on young people not in education, employment or training (NEET) in Wales. It is updated annually with latest estimates from the Annual Population Survey (APS) and the headline SFR series. To supplement this annual output, a headline and tables are published quarterly as new APS data become available. Further information on these series, as well as NEET estimates from the Careers Wales pupil destinations survey, is provided in our guide to understanding the different sources of statistics on young people NEET in Wales.
The data will be used in support of the National Indicator related to ‘Percentage of people in education, employment or training’ laid under the Well-being of Future Generations Act 2015.
Relevance
The statistics are used within the Welsh Government to monitor trends in the level and proportion of young people who are NEET.
The Youth Engagement and Progression Framework was announced in January 2013, with an implementation plan published in October 2013. The Framework outlines the Welsh Government’s approach to reducing the number of young people aged 11 to 25 who are NEET. The Framework is based on 6 key building blocks.
- Identifying young people most at risk of disengagement
- Better brokerage and co-ordination of support for them
- Stronger tracking and transitions of young people through the system
- Ensuring provision meets the needs of young people
- Strengthening employability skills and opportunities for employment
- greater accountability for local authorities
Indicators around the proportion of young people who are NEET are part of the Child Poverty Strategy annual assessment of progress.
Accuracy
The APS is a household survey carried out by the Office for National Statistics (ONS). The survey seeks information on respondents' personal circumstances, including their labour market status and their education and training activity. The APS combines the boosted samples of the Labour Force Survey (LFS) and provides rolling four quarter data.
As the data come from a survey, the results are sample-based estimates and are therefore subject to differing degrees of sampling variability, i.e. the true value for any measure lies in a differing range about the estimated value. Approximate 95% confidence intervals have been calculated for the APS estimates of the proportion of young people aged 16 to 18 and 19 to 24 who are NEET. These have been calculated assuming a simple weighted random sample and do not take into account the design of the sample and thus only provide an indication of the confidence interval. Additionally the adjustment method for apportioning missing values creates an artificial aggregated sample size used in the calculation of confidence intervals. The sampling variability increases as the detail in the data increases and therefore for the 16 to 18 and 19 to 24 age groups, of interest in this bulletin, estimates for sub-groups and regions are based on three period averages.
Further information about the quality of the Annual Population Survey
Chart 1 demonstrates, from 2005 onwards, the similar levels and trend in young people who are NEET shown between the SFR and APS series in general, with a difference at most of 3 percentage points.
Revisions policy
Provisional 2019 figures for the SFR series will be finalised in next year’s publication, due for release in July 2021. Revisions for earlier years are only made in line with revisions to source data. Annual Population Survey data back to 2012 has recently been reweighted, and the SFR series has been updated with these new data.
Timeliness and punctuality
The latest SFR provides new data for 2018 and provisional data for 2019. The provisional estimates use the best data for 2019 currently available for each aspect of participation; this includes some final data, some provisional data and some modelling.
SFR series
Provisional 2019 figures will be finalised in the next SFR publication, due for release in July 2021. For the proportion of 16 to 18 year olds estimated to be NEET in 2018, the difference between the provisional estimate published in the previous release and the final published estimate was 0.3 percentage point on the published rounded basis.
APS series
These estimates of young people who are NEET are revised when the ONS releases revised Annual Population Survey datasets.
Accessibility and clarity
It is not possible to disaggregate the SFR NEET estimate down to local authority level. This is due to the way the data is put together using enrolment data and because the employment status is estimated using the APS. For 16 to 18 year olds the number of respondents to the APS is relatively small in each local authority; less than 100 respondents.
The APS has been used to estimate the proportion of young people who are NEET by region. However as the sample sizes are around 200-500 in each area for those aged 16 to 18 the estimates have been averaged over three rolling years for 16 to 24 year olds. The regions in use are as follows:
North Wales
Isle of Anglesey, Gwynedd, Conwy, Denbighshire, Flintshire, Wrexham
Mid and south west wales
Powys, Ceredigion, Pembrokeshire, Carmarthenshire, Swansea, Neath Port Talbot
South East Wales
Bridgend, Vale of Glamorgan, Rhondda Cynon Taf, Merthyr Tydfil, Caerphilly, Blaenau Gwent, Torfaen, Monmouthshire, Newport, Cardiff.
Comparability and coherence
The method used to define young people who are NEET using the APS is harmonised with an agreed UK methodology of deriving NEET estimates. More information can be found within the paper published by the Office for National Statistics.
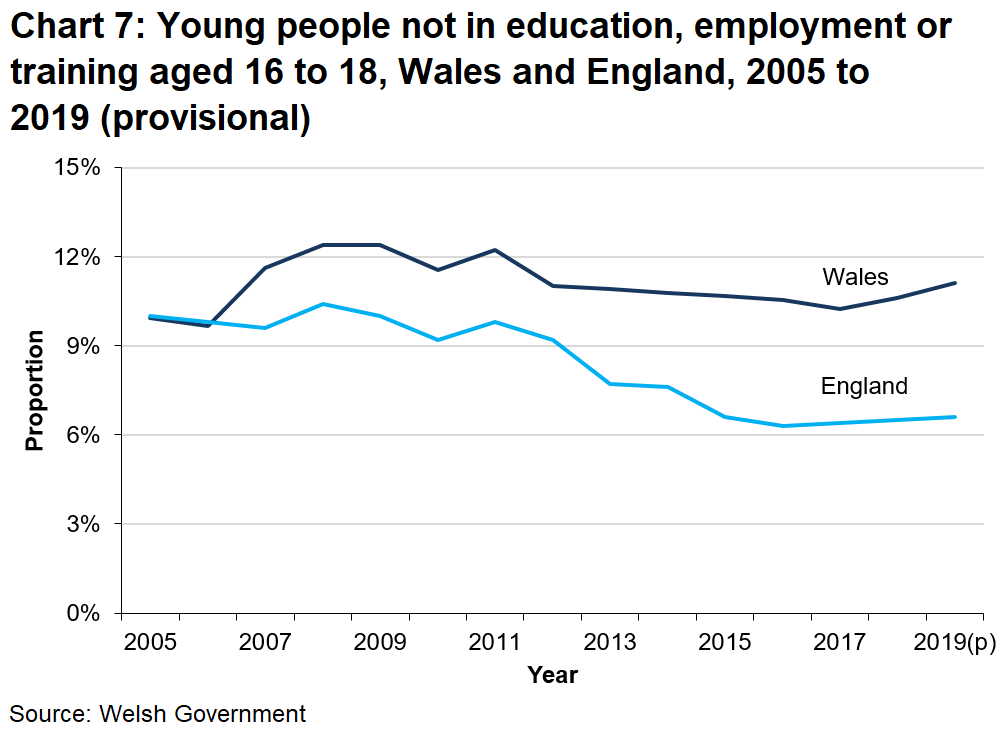
The Department for Education (DfE) publishes estimates of 16 to 18 year old NEET rates for England using similar methodology to the SFR on an annual basis. The most recent Statistical Release provided 2019 provisional figures. Chart 7 shows a comparison of the English and Welsh estimates. England does not produce an equivalent measure for 19 to 24 year olds.
Participation of adults and young people on StatsWales
Between 2005 and 2012 the proportion of 16 to 18 year olds who were NEET in England and Wales followed broadly similar trends, but with Wales having a larger proportion of 16 to 18 year olds NEET than England. From 2005, however, the proportion of 16 to 18 year olds who were NEET in Wales decreased until 2006, resulting in Wales having a similar proportion as England for 2005 and 2006.
The provisional figures for 2019 show an increased gap between England and Wales, with the proportion of 16 to 18 year olds NEET in England increasing slightly to 6.6%. The difference in part reflects legislative changes in 2013/14 by the UK Government which increased the age to which all young people in England are required to remain in education or training.
For both series, changes in trend need to be interpreted with a degree of caution, as changes could be attributed to sampling effects as well as real effects.
For Scotland and Northern Ireland, directly comparable NEET estimates for 16 to 18 year olds and 19 to 24 year olds are not published.
Labour Force Survey and Annual Population Survey
The DfE also publish a quarterly brief on young people who are NEET which includes NEET rates estimates based on the quarterly Labour Force Survey (LFS). Additionally from May 2013 the ONS has produced UK estimates of young people who are NEET, also based on the quarterly LFS.
The quarterly estimates are not directly comparable with the Welsh APS-only estimates published in this release. A direct comparison for Wales with England and the UK LFS measure is not provided as the sample size for 16 to 18 year olds and 19 to 24 year olds in Wales is not sufficiently large. However, using a similar methodology to that used by the ONS, but using the Annual Population Survey rather than the LFS, we can provide estimates of young people who are NEET across the UK.
These estimates will differ from the official estimates produced by the DfE and ONS and other relevant departments and should therefore be interpreted with caution. An article explaining the difference between NEET statistics across the UK was published by the ONS, alongside their first publication of UK estimates of young people who are NEET:
Table 1 shows the estimates of the proportion of young people who are NEET for each of the UK countries for the years ending 2019 Q1 and 2020 Q1.
For 16 to 18 year olds the proportion estimated to be NEET decreased slightly in Wales and across the UK as a whole.
| 16 to 18 year olds | 19 to 24 year olds | |||
| Quarter 1 2019 | Quarter 1 2020 | Quarter 1 2019 | Quarter 1 2020 | |
| Wales | 8.2 | 8.4 | 16.3 | 15.0 |
| England | 7.3 | 7.4 | 14.4 | 14.3 |
| Scotland | 8.6 | 11.2 | 13.2 | 12.7 |
| Northern Ireland | 4.3(!) | 3.6(!) | 13.9 | 14.8 |
| UK | 7.3 | 7.6 | 14.4 | 14.2 |
(!) The data item is based on between approx. 10 and 25 responses and is categorised as being of low quality.
Source: Annual Population Survey
In 2020 Quarter 1 the proportion of 16 to 18 year olds estimated to be NEET increased in Wales and all other UK countries, except Northern Ireland. The gap between the UK and Wales decreased slightly from 0.9 percentage points in 2019 Quarter 1 to 0.8 percentage points in 2020 Quarter 1.
National Statistics status
The United Kingdom Statistics Authority has designated these statistics as National Statistics, in accordance with the Statistics and Registration Service Act 2007 and signifying compliance with the Code of Practice for Statistics.
National Statistics status means that official statistics meet the highest standards of trustworthiness, quality and public value. All official statistics should comply with all aspects of the Code of Practice for Statistics. They are awarded National Statistics status following an assessment by the UK Statistics Authority’s regulatory arm. The Authority considers whether the statistics meet the highest standards of Code compliance, including the value they add to public decisions and debate. The designation of these statistics as National Statistics was confirmed in July 2012 following a full assessment against the Code of Practice.
Since the latest review by the Office for Statistics Regulation, we have continued to comply with the Code of Practice for Statistics, and have made the following improvements:
- included a number of visuals showing long term trends as well as commentary on these trends
- eliminated unnecessary tables from the release as they are freely available on StatsWales
- improved coherence of the commentary when comparing the two different series
It is Welsh Government’s responsibility to maintain compliance with the standards expected of National Statistics. If we become concerned about whether these statistics are still meeting the appropriate standards, we will discuss any concerns with the Authority promptly. National Statistics status can be removed at any point when the highest standards are not maintained, and reinstated when standards are restored.
Well-being of Future Generations Act (WFG)
The Well-being of Future Generations Act 2015 is about improving the social, economic, environmental and cultural wellbeing of Wales. The Act puts in place seven wellbeing goals for Wales. These are for a more equal, prosperous, resilient, healthier and globally responsible Wales, with cohesive communities and a vibrant culture and thriving Welsh language. Under section (10)(1) of the Act, the Welsh Ministers must (a) publish indicators (“national indicators”) that must be applied for the purpose of measuring progress towards the achievement of the Wellbeing goals, and (b) lay a copy of the national indicators before the National Assembly. The 46 national indicators were laid in March 2016 and this release includes information related to one of the national indicators namely “Percentage of people in education, employment or training, measured for different age groups”.
Information on the indicators, along with narratives for each of the well-being goals and associated technical information is available in the Well-being of Wales report.
Further information on the Well-being of Future Generations (Wales) Act 2015.
The statistics included in this release could also provide supporting narrative to the national indicators and be used by public services boards in relation to their local well-being assessments and local well-being plans.
We want your feedback
We welcome any feedback on any aspect of these statistics which can be provided by email to post16ed.stats@gov.wales.
5. Contact details
Statistician: Jonathan Ackland
Telephone: 0300 025 8067
Email: post16ed.stats@gov.wales
Media: 0300 025 8099
![]()
SB 24/2020