COVID-19 Wales situational report: 26 August 2021
Update from the COVID-19 Intelligence Cell and Health Protection Advisory Group.
In this page
COVID-19 situation report summary
Key points to note
Wales moved to Alert Level 0 on 7 August.
Overall cases of COVID-19 and test positivity has increased across Wales. It is currently difficult to say with any certainty what impact the move to Alert level 0 has had on transmission in Wales, as not enough time has passed to provide a clear signal. We will need to monitor case rates and other key indicators in each nation carefully to better understand the impact of easements of restrictions and return of schools.
The JBC consensus estimate of the reproduction number for Wales is between 1.2 and 1.4 (as at 10 August 2021), while PHW's estimate is between 1.5 and 1.6 (25 August 2021). Note that JBC's estimate is typically lagged by 2-3 weeks while PHW, which uses a different methodology, is lagged by around 1 week. Slide 3, Source: PHW
The trend for COVID-19 hospital occupancy in Wales is generally increasing, with 309 COVID-19 related patients (Suspected, Confirmed and Recovering) occupying a hospital bed as at 25 August, after increasing through July from a low base. The trend for invasive ventilated bed occupancy of COVID-19 patients appears to have decreased this week, with 33 patients with Suspected or Confirmed COVID-19 in critical care beds in Wales.
As at 24 August 2021, Wales has had 16,452 confirmed cases of the dominant Delta variant (an increase of 1,111 from the previous week). No other variants of concern were detected in Wales. Data regarding vaccine status of cases and hospitalisations is currently being amended by Public Health Wales and so is not available. Source: PHW
As at 10pm 24 August 2021, a total of 4,512,729 (+42,423) doses of COVID-19 vaccine were given in Wales and recorded in the COVID-19 Welsh Immunisation System. Of this 2,343,371 (+23,206) were first doses and 2,169,358 (+19,217) were second doses. The JCVI recently approved first dose vaccination of 16 and 17 year olds in the UK and this has recently begun in Wales. Source: PHW, SPI-M-O
Key indicators
Several key indicators are increasing rapidly, while deaths remain at low levels.
Please note that the arrows represent a change in comparison for the last week.
| Current value (21/08/21) | Change since previous week (14/08/21 – 21/08/21 unless stated otherwise) | ||||
|---|---|---|---|---|---|
| Percentage change | Value change | ||||
| Confirmed case rate (rolling 7 day sum per 100k) | 328 | +56% | ↑ | (+118) | |
| Confirmed case rate for over 60s (rolling 7 day sum per 100k) | 139 | +60% | ↑ | (+52) | |
| Test positivity (7 day RA) | 17.6% | +27% | ↑ | (+3.7 percentage points) | |
| Population estimated to have COVID-19 (prevalence)1 | 0.83% | +8% | ↑ | (+0.06 percentage points) | |
| NHS COVID-19 Admissions2 | 23 | +36% | ↑ | (+6) | |
| ONS deaths (7 day sum)3 | 9 | -55% | ↓ | (-11) | |
| PHW deaths (7 day sum) | 13 | -13% | ↓ | (-2) | |
- Latest COVID Infection Survey data is taken from 14 August 2021 to 20 August 2021.
- Seven day rolling average to the current date of confirmed COVID-19 patients, does not include COVID-19 suspected or recovering.
- Latest ONS deaths data is to 13 August 2021 (rather than 21 August 2021) for the current value. Data to 6 August 2021 is used for the change since previous week.
What is the current status of the epidemic?
| Local Authority | Number | % of All Wales Total | Case Incidence per 100,000 | Change from previous week |
|---|---|---|---|---|
| Swansea | 1167 | 11.3% | 472.5 | 133% ↑ |
| Denbighshire | 420 | 4.1% | 438.9 | 15% ↑ |
| Neath Port Talbot | 618 | 6.0% | 431.2 | 75% ↑ |
| Pembrokeshire | 496 | 4.8% | 394.2 | 102% ↑ |
| Rhondda Cynon Taf | 942 | 9.1% | 390.4 | 67% ↑ |
| Newport | 550 | 5.3% | 355.6 | 32% ↑ |
| Torfaen | 322 | 3.1% | 342.7 | 54% ↑ |
| Vale of Glamorgan | 446 | 4.3% | 333.9 | 121% ↑ |
| Wrexham | 439 | 4.2% | 322.9 | 12% ↑ |
| Flintshire | 502 | 4.9% | 321.6 | 16% ↑ |
| Conwy | 371 | 3.6% | 316.5 | 15% ↑ |
| Gwynedd | 371 | 3.6% | 297.8 | 27% ↑ |
| Bridgend | 434 | 4.2% | 295.1 | 74% ↑ |
| Carmarthenshire | 536 | 5.2% | 283.9 | 113% ↑ |
| Monmouthshire | 266 | 2.6% | 281.2 | 72% ↑ |
| Powys | 361 | 3.5% | 272.6 | 23% ↑ |
| Ceredigion | 193 | 1.9% | 265.5 | 39% ↑ |
| Cardiff | 951 | 9.2% | 259.2 | 57% ↑ |
| Caerphilly | 442 | 4.3% | 244.1 | 61% ↑ |
| Isle of Anglesey | 151 | 1.5% | 215.6 | 74% ↑ |
| Merthyr Tydfil | 121 | 1.2% | 200.6 | 48% ↑ |
| Blaenau Gwent | 132 | 1.3% | 188.9 | 14% ↑ |
| Unknown | 116 | 1.1% | - | 55% ↑ |
| Total | 10347 | 100.0% | 328.2 | 56% ↑ |
At a Wales level, on 20 August 2021, the 7-day rolling incidence of COVID-19 cases and percentage of people testing positive for COVID-19 have sharply increased since last week.
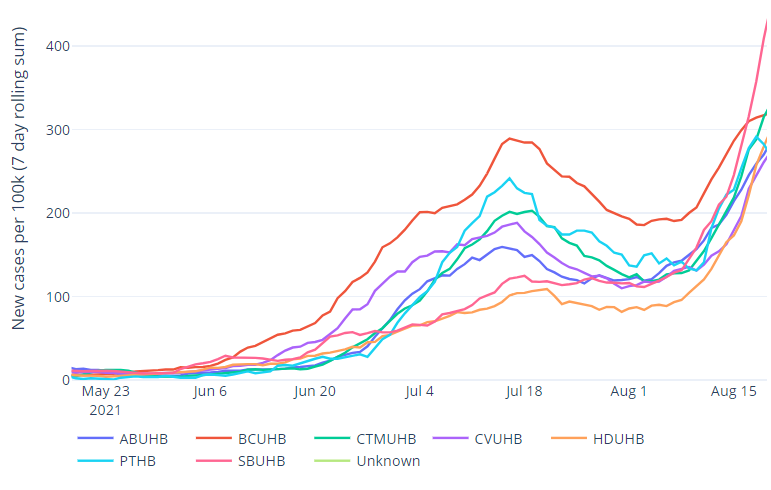
The JBC consensus Reproduction number (Rt) estimate for Wales is between 1.2 and 1.4 (as at 10 August 2021) , with daily growth rate of between +2% and +7 % and a doubling time between 11 and 24 days. Using PHW positive test data only (more timely data but limited by variation in testing), Rt is estimated to be between 1.5 and 1.6 for Wales (25 August 2021). The central Rt estimate is highest for Swansea Bay health board at 2.0. Source: JBC/PHW
7-day cumulative case incidence in Wales has increased by 63% to 321.7 per 100,000 population in the last week.
Case incidence is increasing in all the 22 local authorities. Case incidence is above 200 per 100,000 population for all local authorities except Blaenau Gwent. Local authorities with the highest case incidences are Swansea and Denbighshire at 472.5 and 438.9 per 100,000 population, respectively.
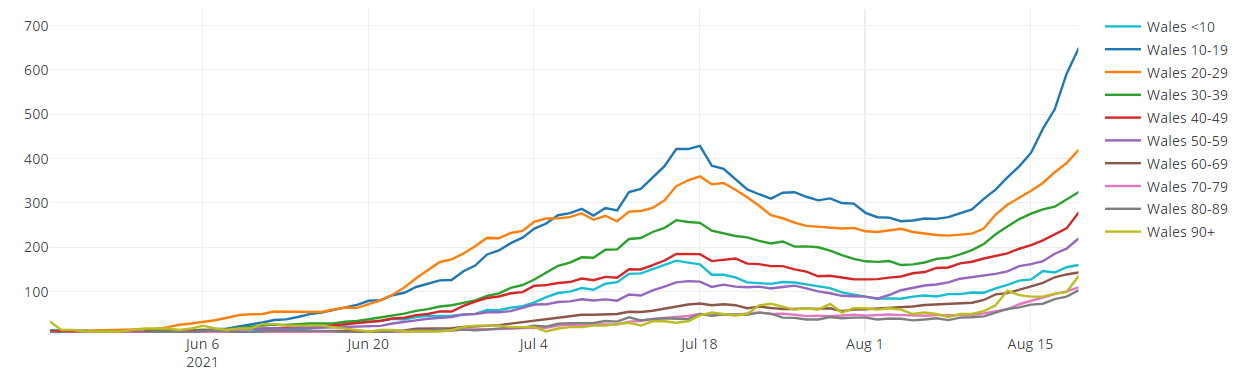
Case incidence is highest in those aged 10-19. Case incidence is increasing in all age groups and is highest in younger age groups. Case incidence is highest for the Swansea Bay health board and increased for all health boards in the last week.
The table below provides estimates of doubling and halving times based on PHW COVID-19 positive test data. In this table, doubling times are positive, whilst halving times are negative. The 95% confidence intervals are showing in brackets after the central estimate. An asterisk (*) means that there are small numbers and estimates should be treated with caution. Local health board level estimates of Rt and halving times will be unstable when incidence is low.
| Area | Rt (95% CI) | Halving time (95% CI) |
|---|---|---|
| All Wales | 1.5 (1.5 to 1.6) | 9 (7 to 12) DOUBLING |
| Swansea Bay UHB | 2.0 (2.0 to 2.1) | 6 (5 to 8) DOUBLING |
| CTM UHB | 1.7 (1.6 to 1.8) | 7 (5 to 10) DOUBLING |
| Aneurin Bevan UHB | 1.5 (1.4 to 1.5) | 10 (7 to 16) DOUBLING |
| Cardiff & Vale UHB | 1.7 (1.6 to 1.7) | 8 (7 to 11) DOUBLING |
| Hywel Dda UHB | 1.9 (1.8 to 2.0)* | 6 (5 to 9)* DOUBLING |
| Powys THB | 1.3 (1.2 to 1.4)* | 8 (5 to 25)* DOUBLING |
| Betsi Cadwaladr UHB | 1.2 (1.2 to 1.3) | 14 (9 to 36) DOUBLING |
Cases per 100k (PHW Data) (7 day rolling sum)
Cases per 100k by age (PHW Data) (7 day rolling sum)
Data as at 12:00PM 25 August 2021 unless otherwise specified.
What is the situation with the NHS and social care?
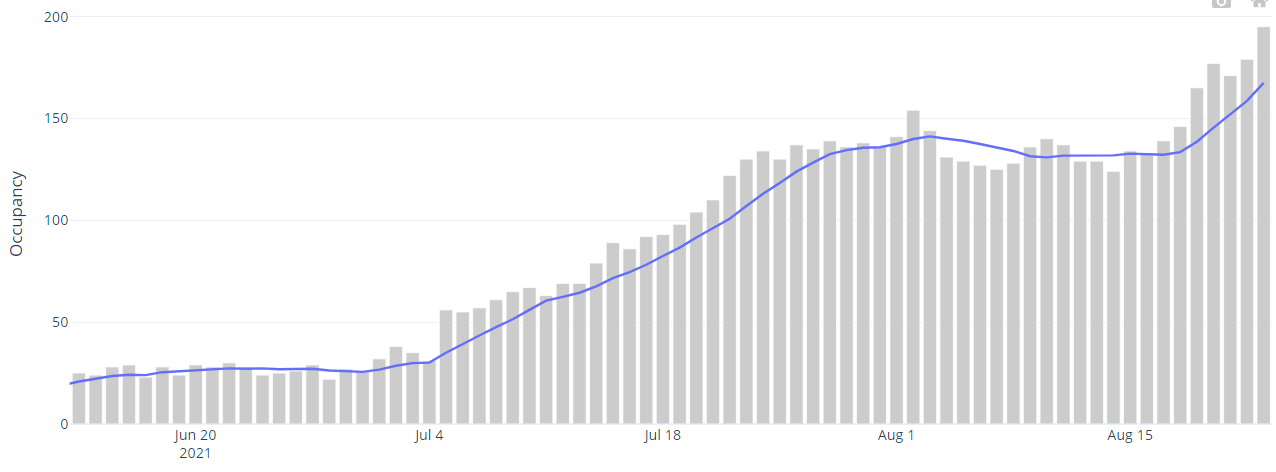
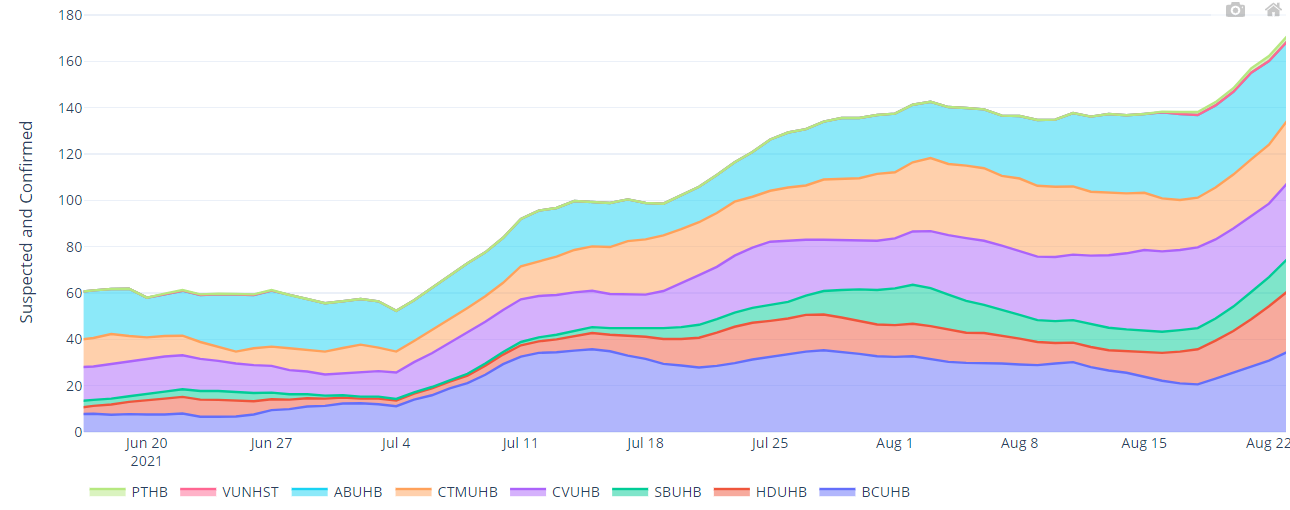
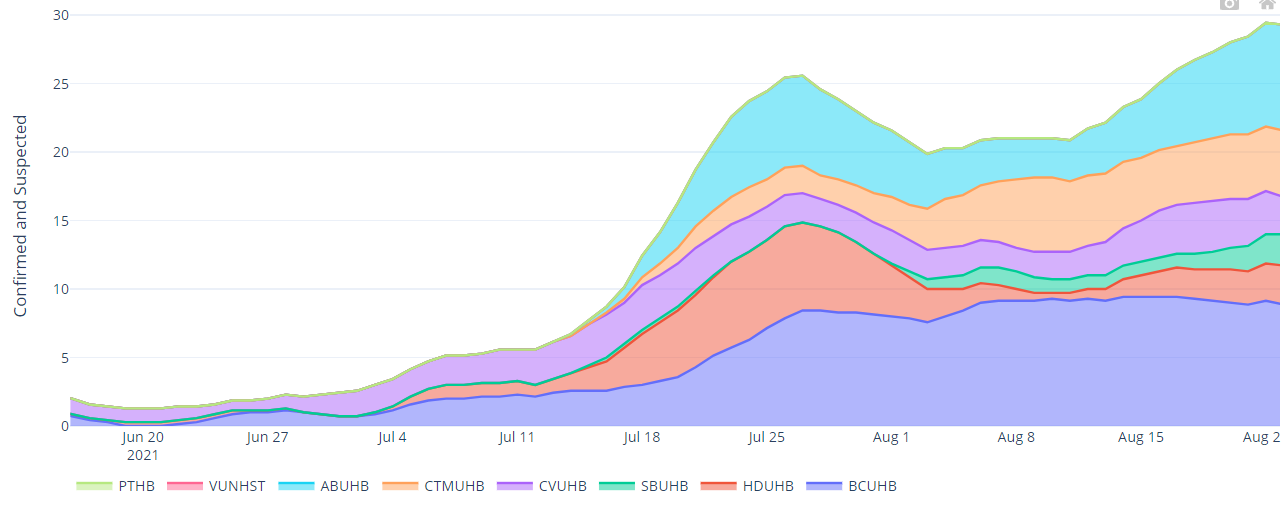
From early-July 2021, COVID-19 pressure on the NHS has been generally increasing. As at 25 August 2021, there were 309 COVID-19 related patients (Suspected, Confirmed and Recovering) occupying a hospital bed. This compares to 220 (89 more occupied beds) on 18 August 2021. Confirmed patients accounted for 209 of the total occupied beds.
There are 33 patients with Suspected or Confirmed COVID-19 in critical care beds in Wales. This is 131 lower than the maximum COVID-19 position of approximately 164. The total number of patients in critical care for both COVID-19 and non-COVID-19 stands at 172, 20 more than the historic maximum critical care capacity of approximately 152.
The number of care homes in 'red' status (an ongoing outbreak/incident reported within the last 7 days) was not available from the National Situation Background Assessment Recommendation (SBAR) report covering the week of 16 August 2021 to 22 August 2021. Source: National SBAR
Confirmed hospital occupancy (7 day rolling average)
Overall invasive ventilated bed occupancy (7 day rolling average)
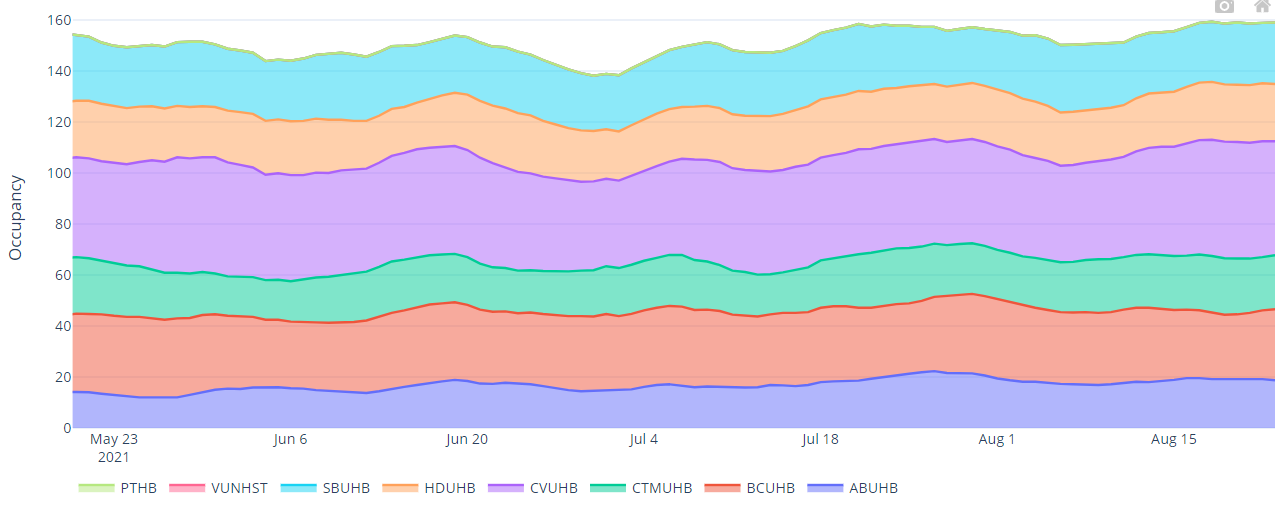
Hospital bed occupancy for suspected and confirmed COVID-19 positive patients (7 day rolling average)
Invasive ventilated bed occupancy for suspected and confirmed COVID-19 positive patients (7 day rolling average)
Number of adult care homes reported an ongoing outbreak/incident (last 7 days)

Wastewater Monitoring for COVID-19
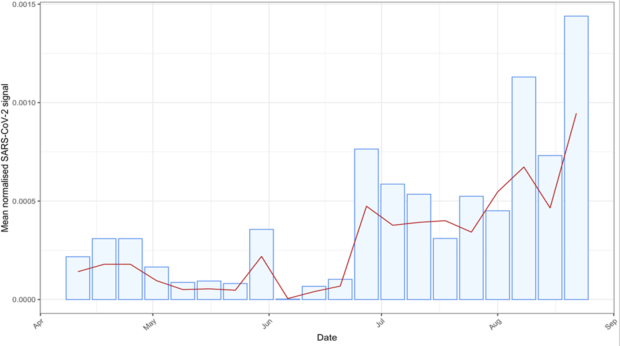
In the week ending 22 August 2021, the wastewater signal broadly confirms the national trend in positive COVID-19 cases (PHW) over the same period.
The normalised wastewater SARS-CoV-2 signal across North Wales sites was relatively stable last week and over the past 4 weeks, but is slowly rising, while the signal across South Wales increased in the last week. Comparing the week ending 22 August 2021 with the previous week, there are still differences between the change in SARS-CoV-2 signal from wastewater data and the change in COVID-19 case incidence data (PHW) over the same time period. (See Table.)
Wastewater signal is a relatively unbiased indicator because it is not dependent on testing policy and behaviour. The characteristics of the individual sewerage systems could have an impact on the signal being seen. Subsequently, the relationship between cases and wastewater signal is still being investigated.
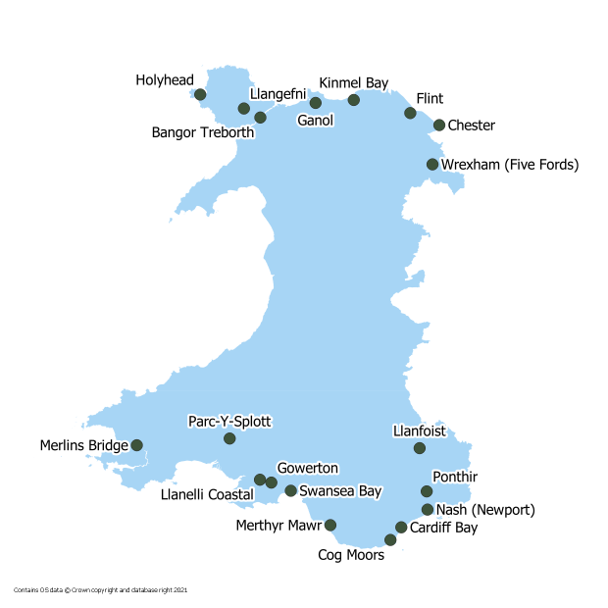
Sites/regions on the watch-list (increases and/or divergence between SARS-CoV-2 signal and corresponding LSOA PHW COVID-19 case data over the past 2-4 weeks): Ganol and Llangefni in North Wales; and all sites, with the possible exception of Newport, in South Wales.
Wastewater SARS-CoV-2 signal data below limit of detection recorded as zero. The wastewater data for individual WwTW sites, normalised and unnormalised are inherently noisy. Sampling from Treborth** has not been consistent due to construction work at the site, and this has impacted on the North Wales average figures. Wastewater data analysis and reporting is still in a pilot stage and should not be relied upon in isolation.
|
Region |
Site |
9 to 15 August mean |
16 to 22 August mean |
Fold changea Mean normalised SARS-CoV-2 signal |
Fold changea Total reported COVID-19 cases |
|---|---|---|---|---|---|
|
North Wales |
Chester |
1.2 |
0.5 |
0.4 ↓ |
- |
|
North Wales |
Flint |
0.8 |
c |
c |
0.9↓ |
|
North Wales |
Ganol |
0.6 |
1 |
1.6↑ |
0.9↓ |
|
North Wales |
Holyhead |
0 |
0 |
1 |
0.9↓ |
|
North Wales |
Kinmel Bay |
2.2 |
c |
c |
0.9↓ |
|
North Wales |
Llangefni |
0.6 |
0.1 |
0.2 ↓ |
2.2 ↑ |
|
North Wales |
Treborth |
1.1 |
0.6 |
0.5 ↓ |
0.8↓ |
|
North Wales |
Wrexham |
1.4 |
0.3 |
0.2 ↓ |
0.8↓ |
|
South Wales |
Cardiff Bay |
10.7 |
15.8 |
1.5↑ |
1.2↑ |
|
South Wales |
Cog Moors |
2.4 |
5 |
2.1↑ |
1.2↑ |
|
South Wales |
Gowerton |
5.8 |
19.4 |
3.4 ↑ |
1.3↑ |
|
South Wales |
Llanelli Coastal |
3.7 |
5.8 |
1.6↑ |
1.4↑ |
|
South Wales |
Llanfoist |
0 |
2.1 |
b↑ |
1.5↑ |
|
South Wales |
Merlin's Bridge |
0 |
6.6 |
b↑ |
1.7↑ |
|
South Wales |
Merthyr Mawr |
3.7 |
2.1 |
0.6 ↓ |
1.4↑ |
|
South Wales |
Newport Nash |
12.4 |
12 |
1 |
0.9 ↓ |
|
South Wales |
Parc Y Splotts |
11.4 |
7.1 |
0.6 ↓ |
2.2↑ |
|
South Wales |
Ponthir |
18.5 |
36.4 |
2↑ |
1.1↑ |
|
South Wales |
Swansea Bay |
11.8 |
45.8 |
3.9 ↑ |
1.8↑ |
a: The ratio between the measurement from the most recent week (B) and that of the preceding week (A), i.e. B/A
b: Fold change from or to zero cannot be presented numerically
c: Samples not available
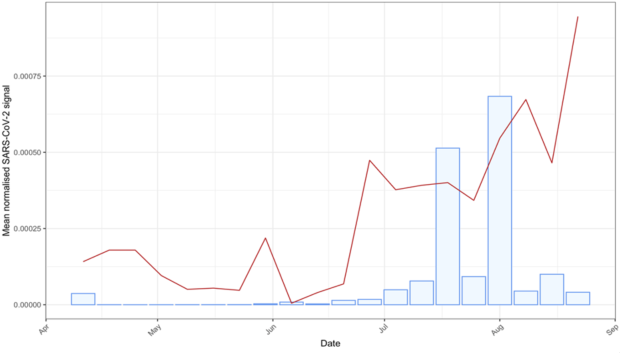
Weekly comparison of North and all-Wales mean normalised SARS-CoV-2 signal.
All-Wales mean signal (red line) and North Wales mean signal (blue bars). Data to 22 August 2021.
Weekly comparison of South and all-Wales mean normalised SARS-CoV-2 signal.
All-Wales mean signal (red line) and South Wales mean signal (blue bars). Data to 22 August 2021.
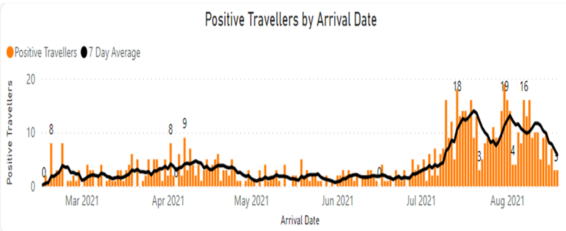
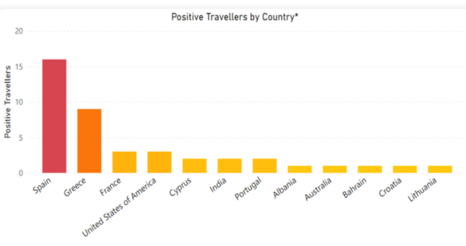
What is the situation with arriving travellers?
Spain continues to see significant rises in arrivals with an increase of 528 over last week. Greece and France also had significant rises. Spain continues to have the highest numbers of arrivals testing positive on return (16 positive travellers last week), with a positivity rate of 0.35%, although this has decreased when comparing to the previous week (24 positive travellers, 0.60% positivity rate). Greece had 9 positive travellers last week (0.50% positivity rate) and the USA had 3 positive travellers (0.65% positivity rate).
14,928 total travellers this week (13,062 last week):
- Red: 126 (169 last week)
- Amber: 12,430 (11,072 last week)
- Green: 2,372 (1,819 last week)
41 total positive travellers (40 total last week)
- Red: 0 positive travellers (1 last week)
- Amber: 40 positive travellers (35 last week)
- Green: 1 positive travellers (3 last week)
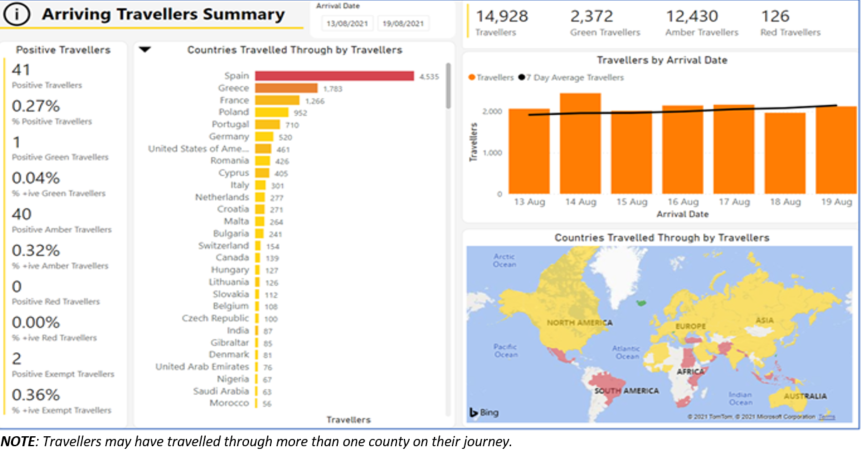
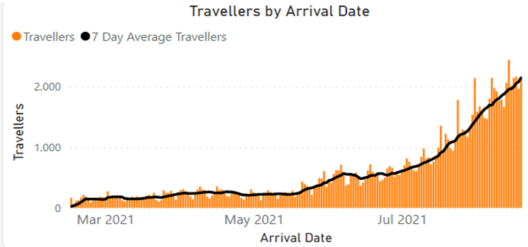
Source: Home Office
Please note that the data provided by the Home Office is derived from Passenger Locator Forms (PLF) which are self-completed by travellers. As such, data may contain inaccuracies. Due to the limitations associated with data capture and legislation, some minor discrepancies may be present in the data.
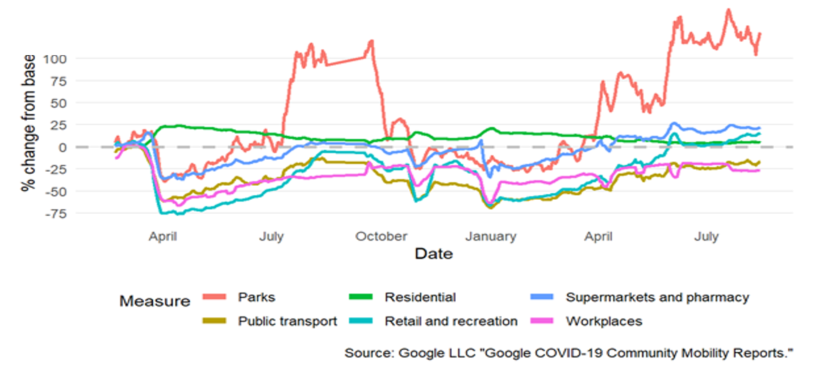
Mobility data, adherence and UK comparison
Mobility data by location of trip, Welsh local authorities
The latest mobility data shows increases in the latest week across most categories compared to the previous week with reductions in people spending time at home. The baseline for much of the data is during January to February 2020 and changes are relative to that period. It is not possible to determine if mobility is higher/lower than would have been expected prior to the pandemic as data for 2019 or earlier years is not published.
Adherence
The most recent IPSOS MORI data for the period 13 August – 16 August for Wales shows a decrease compared with the last survey wave in those only leaving home for essential trips, while those maintaining 2m social distance remained steady. It should be noted that this is self-reported adherence and will be affected by individuals’ understanding of the rules and circumstances that apply to them.
The latest results from the Public Engagement Survey on Health and Wellbeing during Coronavirus Measures (2 to 8 August) as those reported last week.
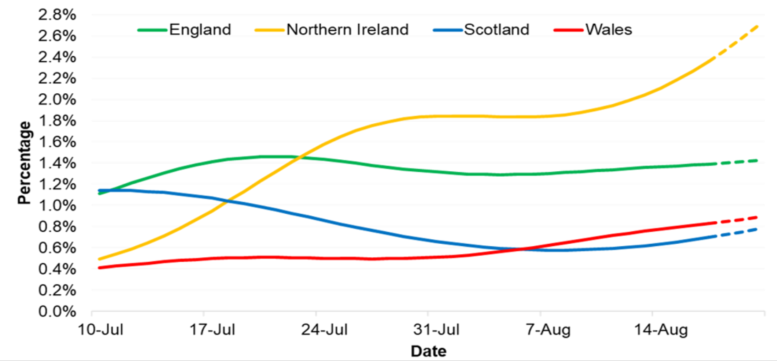
Results from the coronavirus (COVID-19) Infection Survey, 14 to 20 August
The percentage of people testing positive has increased in all four UK nations in the most recent week. Positivity is highest in Northern Ireland and lowest in Scotland.
It is estimated that an average of 25,200 people in Wales had COVID-19 (95% credible interval: 18,000 to 33,500), equating to around 1 in 120 people or 0.83% of the community population (up from 0.77% last week). This compares to around 1 in 70 people in England, around 1 in 140 people in Scotland, and around 1 in 40 people in Northern Ireland.
Source: Office for National Statistics COVID-19 Infection Survey.
Positivity rates (%) across UK countries up to 20 August 2021
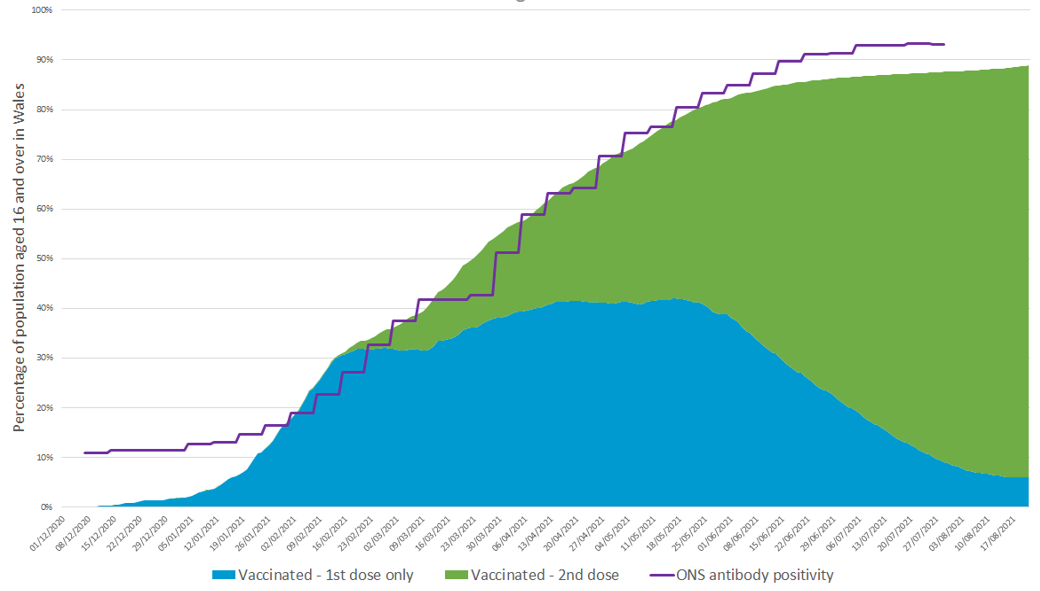
Vaccine and immunity status
Vaccination and antibody status of individuals aged 16 and over in Wales
Immunity estimates and antibody status of individuals aged 16 and over in Wales
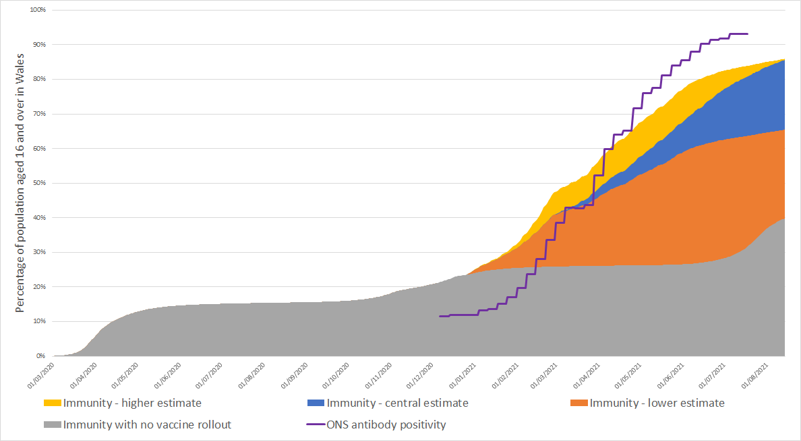
The COVID-19 vaccination rollout of first and second doses has slowed in Wales. As at 21 August 2021, 89% of people aged 16 and over had received at least one COVID-19 vaccine dose in Wales. 6% of people aged 16 and over had exactly one vaccine dose and 83% were fully vaccinated.
Between 26 and 29 July 2021, the ONS COVID-19 Infection Survey estimated that 93.2% of the community population aged 16 and over in Wales tested positive for COVID-19 antibodies.
As at 21 August 2021, it is estimated that 87% of people aged 16 and over in Wales had some immunity against COVID-19 infection. The lower and higher estimates of immunity are 66% and 87% of people aged 16 and over in Wales. If no vaccines had been administered, it is estimated that 41% of people aged 16 and over would be immune. These estimates assume 84% of natural infections lead to immunity, but do not account for waning immunity. (SIREN study paper, The Lancet, published 9 April 2021)
It is currently estimated that over 80% (may be closer to 90%) of the population, spread evenly across Wales, must be immune to COVID-19 before population immunity effects would be observed. (TAG advice on the Delta variant, published 18 June 2021). Note that the immunity estimate of 87% is for individuals aged 16 and over, not the total Wales population, and varies across age groups.
Differences between antibody presence and immunity estimates include:
- ONS antibody estimates are based on study participants who have volunteered for the study and estimates are extrapolated.
- ONS estimates are based on the 16+ community population, which excludes people in care homes or hospitals. Immunity estimates are based on the whole 16+ Wales population.
- While antibody protection doesn’t equal immunity from infection, it does give a useful indication of the level of protection from infection in the Welsh population.
- Antibody estimates use 2019 mid-year population estimates while the immunity estimates use 2020 mid-year estimates.
Source: ONS COVID-19 Infection Survey, PHW, SPI-M, Swansea University modelling
What does the situation look like going forward?
Based on the current rates observed with current restrictions:
Cases
the probability of incidence reaching greater than 500 per 100,000 between 5 September and 11 September is above 80% for 7 of the 22 local authorities. The figure illustrates the probability (between 0 – 100%) of incidence being greater than 500 per 100,000. Source: Imperial College London
Probability of greater than 100 per 100,000 cases by local authority
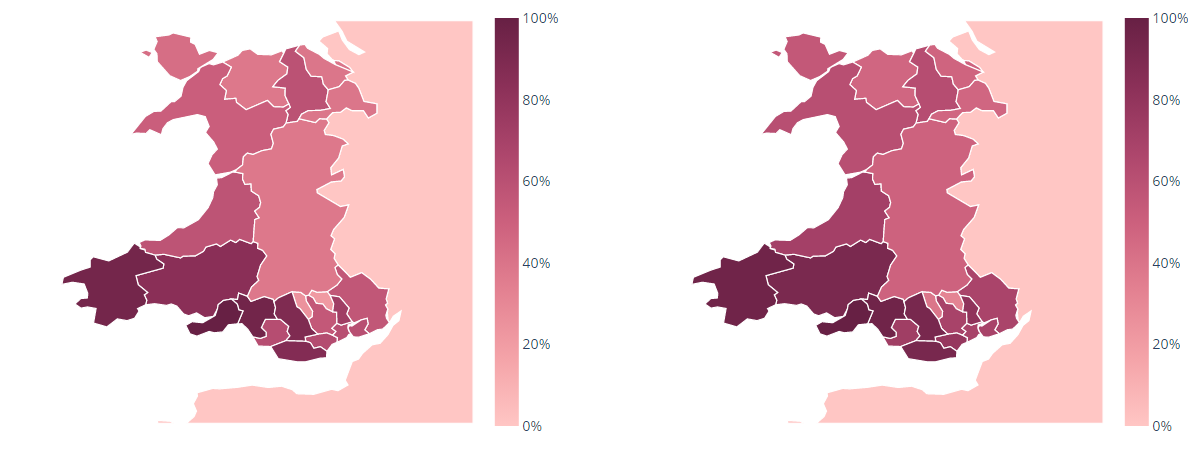
29 August to 4 September 2021 and 5 to 11 September 2021.
Deaths per day
SPI-M's consensus view is that the number of deaths in Wales will remain low compared with previous waves over the next three weeks. Source: Modelled medium term projections, SAGE/SPI-M, 25 August
Hospitalisations per day
Projected to increase to over 50 per day over the next three weeks. Source: Modelled medium term projections, SAGE/SPI-M, 25 August
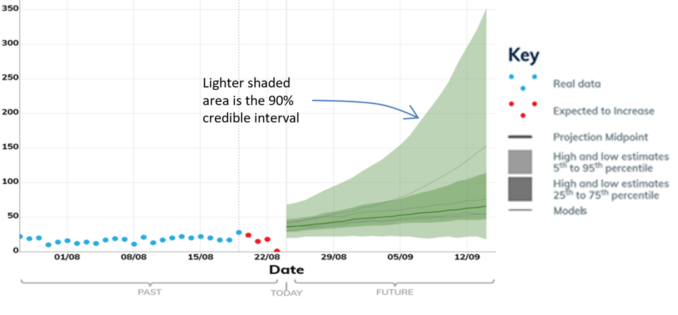
These projections are based on current trends and will not fully reflect the impact of policy or behavioural changes over the past two to three weeks, including the recent downward trend in all UK nations. The projections include the impact of vaccines, but cannot capture any future increases in transmission resulting from new variants. They are not forecasts or predictions.
Key risks and sources
Key risks
Transmissions, incidence and prevalence
Overall transmission of COVID-19 and test positivity has increased across Wales.
Rising trends across health boards and local authorities.
NHS capacity
From early-July 2021, COVID-19 pressure on the NHS has been generally increasing.
Mortality
Low numbers of deaths in the most recent week.
Variants
Wales has 16,452 confirmed cases of the Delta variant (an increase of 1,111 from the previous week). Delta remains the dominant variant of COVID-19 in Wales.
Immunity and vaccines
4.51 (+0.04) million doses of COVID-19 vaccine have been given in Wales, of which 2.34 (+0.02) million were first doses and 2.17 million (+0.02) were second doses. 87% of those aged 16 and over in Wales were estimated to have some immunity against COVID-19 infection at 21 August.
International
There is an increase in traveller numbers this week. However the proportion of travellers testing positive is relatively low.