COVID-19 Wales situational report: 3 June 2021
Update from the COVID-19 Intelligence Cell and Health Protection Advisory Group.
In this page
COVID-19 situation report summary
Key points to note
Wales is at Alert Level 2.
COVID-19 cases are relatively low across most of Wales. The percentage of people testing positive for COVID-19 remains relatively low. Slide 3, Source: PHW
Overall transmission of COVID-19 is slightly increasing but relatively low. The consensus estimate of the reproduction number for Wales is between 0.8 and 1.1. Source: SPI-M/SAGE, 25 May 2021.
COVID-19 pressure on the NHS has generally stabilised and is now similar to the lowest levels since reporting began. See also Slide 4, Source: NHS Wales Operational data
39 additional cases of the variant Delta (B.1.617.2, first identified in India) have been identified in Wales, as at 03 June, bringing the total to 97 confirmed cases. Source: PHW The Delta variant has been spreading rapidly across the UK, with growth in all English regions where at least 25% of cases are the Delta variant. This variant is estimated to be around 40% to 60% more transmissible than the Alpha (B.1.1.7) variant and is anticipated to become the dominant variant in Wales. There are insufficient data currently to assess the potential for immune escape, although there is early indication that there may be some loss of vaccine protection. Source: SAGE, 3 June 2021
On vaccination, as at 26 May 2021, a total of 3.31 million doses of COVID-19 vaccine have been given in Wales. Of the 3.31 million doses given nationally, 2.16 million were first doses and 1.16 million were second doses. Current coverage will not offer population level protection in the absence of other protective behaviours. Source: PHW
Key indicators
Most key indicators continue to decrease or remain stable, following a period of high transmission in December and January.
Please note that the arrows represent a change in comparison for the last week.
| Current value (29/05/21) | Change since previous week (22/05/21 – 29/05/21 unless stated otherwise) | ||||
|---|---|---|---|---|---|
| Percentage change | Value change | ||||
| Confirmed case rate (rolling 7 day sum per 100k) | 8 | -18% | ↓ | (-2) | |
| Confirmed case rate for over 60s (rolling 7 day sum per 100k) | 5 | -10% | - | (-1) | |
| Test positivity (7 day RA) | 0.9% | -13% | - | (-0.1 percentage points) | |
| Population estimated to have COVID-19 (prevalence)1 | 0.10% | +233% | ↑ | (+0.01 percentage points) | |
| NHS capacity – Admissions2 | 3 | -20% | - | (-1) | |
| ONS deaths (7 day sum)3 | 4 | -20% | - | (-1) | |
| PHW deaths (7 day sum) | 2 | -60% | - | (-3) | |
- Latest Covid Infection Survey data is taken from the 23 May 2021 to 29 May 2021.
- Seven day rolling average to the current date of confirmed COVID-19 patients – does not include COVID-19 suspected or recovering.
- Latest ONS deaths data is to 21 May 2021 (rather than 29 May 2021) for the current value. Data to 14 May 2021 is used for the change since previous week.
What is the current status of the epidemic?
| Local Authority | Number | % of All Wales Total | Case Incidence per 100,000 | Incidence threshold reached | Change from previous week |
|---|---|---|---|---|---|
| Conwy | 22 | 9.10% | 18.8 | 15 to < 20 | 340% ↑ |
| Bridgend | 23 | 9.50% | 15.6 | 15 to < 20 | -15% ↓ |
| Wrexham | 18 | 7.40% | 13.2 | Under 15 | 29% ↑ |
| Neath Port Talbot | 18 | 7.40% | 12.6 | Under 15 | 20% ↑ |
| Denbighshire | 10 | 4.10% | 10.4 | Under 15 | 233% ↑ |
| Gwynedd | 13 | 5.40% | 10.4 | Under 15 | 333% ↑ |
| Cardiff | 34 | 14.00% | 9.3 | Under 15 | -13% ↓ |
| Monmouthshire | 8 | 3.30% | 8.5 | Under 15 | -58% ↓ |
| Newport | 13 | 5.40% | 8.4 | Under 15 | -46% ↓ |
| Pembrokeshire | 10 | 4.10% | 7.9 | Under 15 | 67% ↑ |
| Carmarthenshire | 13 | 5.40% | 6.9 | Under 15 | 18% ↑ |
| Flintshire | 10 | 4.10% | 6.4 | Under 15 | -23% ↓ |
| Ceredigion | 4 | 1.70% | 5.5 | Under 15 | -20% ↓ |
| Swansea | 13 | 5.40% | 5.3 | Under 15 | -54% ↓ |
| Vale of Glamorgan | 6 | 2.50% | 4.5 | Under 15 | -45% ↓ |
| Torfaen | 4 | 1.70% | 4.3 | Under 15 | -20% ↓ |
| Powys | 5 | 2.10% | 3.8 | Under 15 | 67% ↑ |
| Blaenau Gwent | 2 | 0.80% | 2.9 | Under 15 | -60% ↓ |
| Caerphilly | 4 | 1.70% | 2.2 | Under 15 | -80% ↓ |
| Rhondda Cynon Taf | 5 | 2.10% | 2.1 | Under 15 | -62% ↓ |
| Merthyr Tydfil | 1 | 0.40% | 1.7 | Under 15 | -50% ↓ |
| Isle of Anglesey | 1 | 0.40% | 1.4 | Under 15 | -83% ↓ |
| Unknown | 5 | 2.10% | - | 25% ↑ | |
| Total | 242 | 100.00% | 7.7 | Under 15 | -14% ↓ |
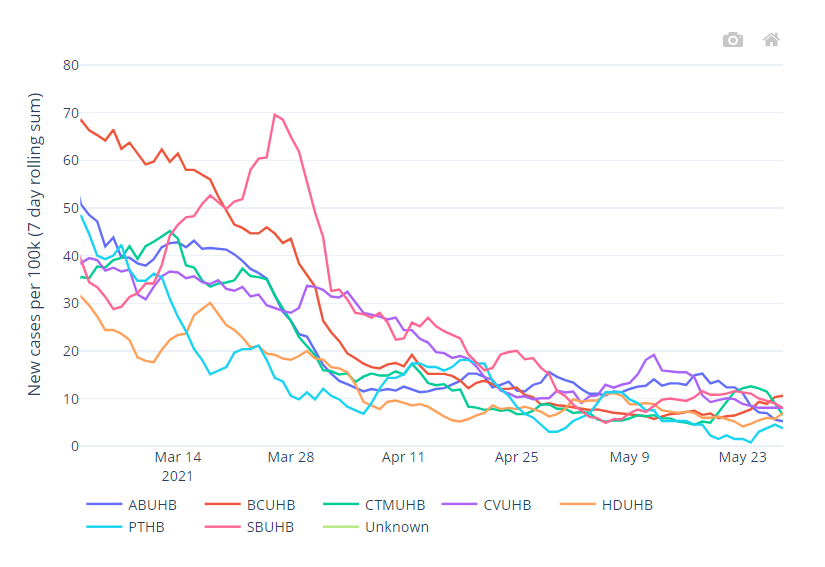
At a Wales level, on 28 May, the 7-day rolling incidence of COVID-19 cases and the percentage of people testing positive for COVID-19 have decreased slightly since last week.
The SAGE/ SPI-M consensus estimate of Reproduction number (Rt) is 0.8 - 1.1 (as at 25 May 2021). When we look at reproduction numbers using PHW positive test data only (see second table below) - a more timely estimate but limited by variation in testing - we see a reproduction number estimate of 0.89 for Wales. At local health board level, there is considerable variation in the reproduction number (cases only) estimate. The central estimate of the reproduction number (cases only) is at or above 1 for Hywel Dda and Betsi Cadwaladr health boards.
7-day cumulative case incidence remains low across Wales, with all local authorities below 20 cases per 100,000 population. At a Wales level, cases per 100,000 is currently at 7.7 per 100,000 population. This is a slight decrease compared to the previous report (8.9 per 100,000 population).
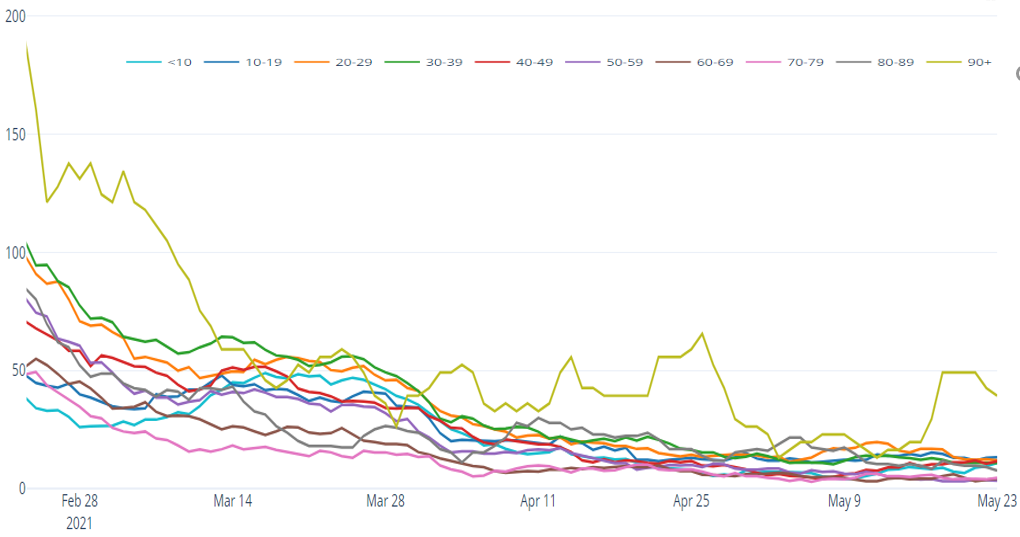
Incidence varies by local authority and age. Conwy and Bridgend have the highest case incidences, but are both below the threshold of 20 cases per 100,000. However, Conwy's case incidence has increased over the past week.
The table below also provides estimates of doubling and halving times based on COVID-19 positive test data. In this table, halving times are positive, whilst doubling times are negative. The 95% confidence intervals are showing in brackets after the central estimate. An asterisk (*) means that there are small numbers and estimates should be treated with caution. Local health board level estimates of Rt and halving times will be unstable when incidence is low.
| Area | Rt (95% CI) | Halving time (95% CI) |
|---|---|---|
| All Wales | 0.9 (0.8 to 1.0) | 541.5 (17 to -18) DOUBLING |
| Swansea Bay UHB | 0.7 (0.5 to 1.0) | 31.5 (8 to -16) |
| CTM UHB | 0.7 (0.5 to 0.9) | 59 (4 to -5) |
| Aneurin Bevan UHB | 0.5 (0.4 to 0.65) | 9 (5 to 61) |
| Cardiff & Vale UHB | 0.85 (0.6 to 1.1) | 137 (11 to -13) |
| Hywel Dda UHB | 1.3 (0.9 to 1.7) | 22 (6.5 to -16) DOUBLING |
| Powys THB | 0.6 (0.3 to 1.0) | 25 (5 to -8) DOUBLING |
| Betsi Cadwaladr UHB | 1.6 (1.3 to 1.9) | 11 (5 to -284.5) DOUBLING |
Cases per 100k (PHW Data) (7 day rolling sum)
Cases per 100k by age (PHW Data) (7 day rolling sum)
Data as at 12:00PM 02 June 2021 unless otherwise specified
What is the situation with the NHS and social care?
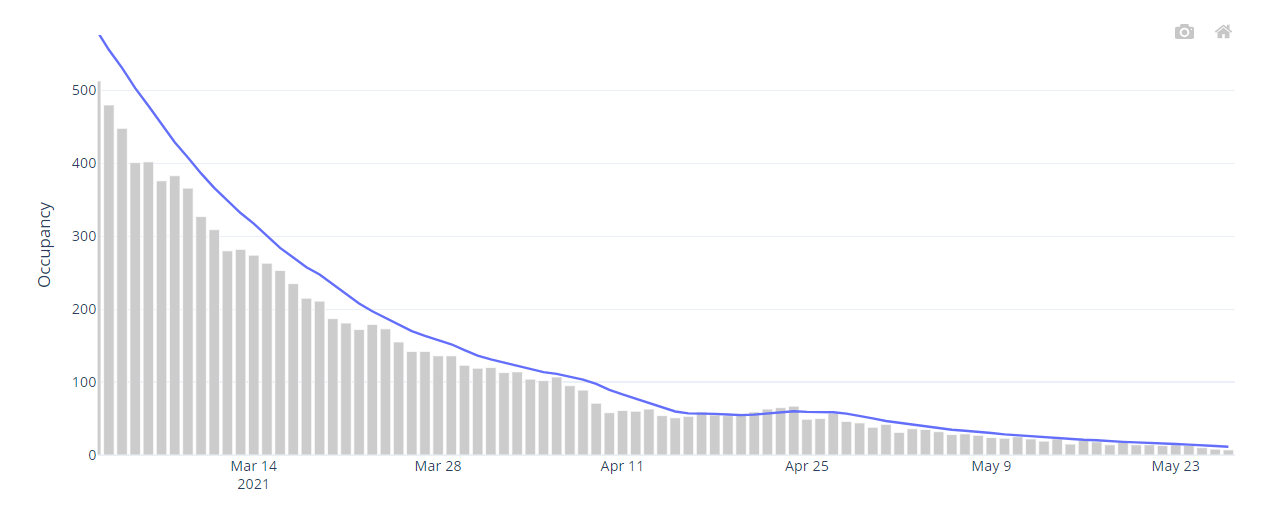
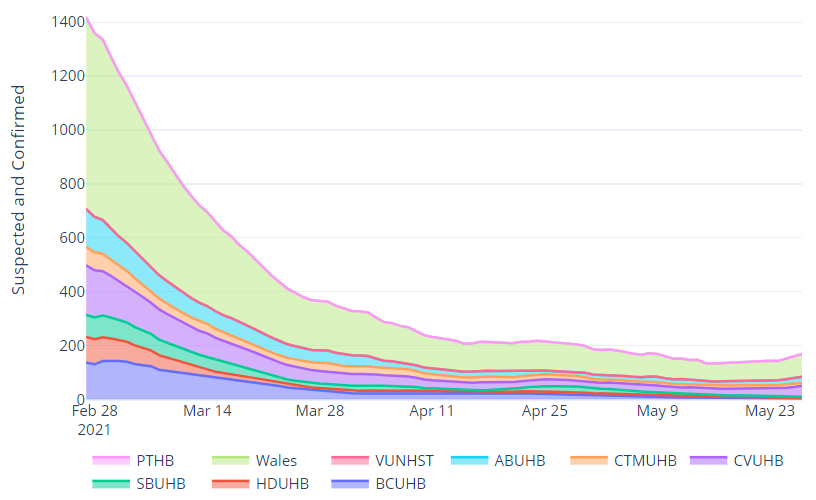
COVID-19 pressure on the NHS has generally stabilised and is now similar to the lowest levels since reporting began. As at 2 June 2021, there were 131 COVID-19 related patients (Suspected, Confirmed and Recovering) occupying a hospital bed. This compares to 180 (49 fewer occupied beds) on 26 May 2021. Confirmed patients accounted for 14 of the total occupied beds, and are at similar levels to early September 2020.
There are 3 patients with Suspected or Confirmed COVID-19 in critical care beds in Wales. This is 161 lower than the maximum COVID-19 position of approximately 164. The total number of patients in critical care for both COVID-19 and non-COVID-19 stands at 150, 2 fewer than the historic maximum critical care capacity of approximately 152.
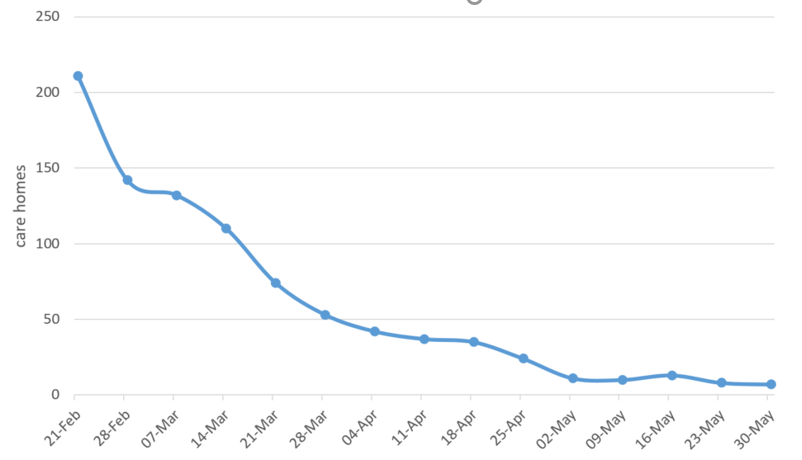
The situation with care homes remains stable with a relatively low number of care home incidents reported across Wales.
In the 7 days up to 20 May 2021, 6 (0.6%) adult care homes in Wales notified CIW of one or more confirmed cases of COVID-19, in staff or residents. This is 3 fewer notifications compared to the last 7 days up to 13 May 2021. The number of notifications is similar to the lowest levels since the beginning of the reporting period on 16 December 2020.
Confirmed hospital occupancy (7 day rolling average)
Overall invasive ventilated bed occupancy (7 day rolling average)
Invasive ventilated bed occupancy for suspected and confirmed COVID-19 positive patients (7 day rolling average)
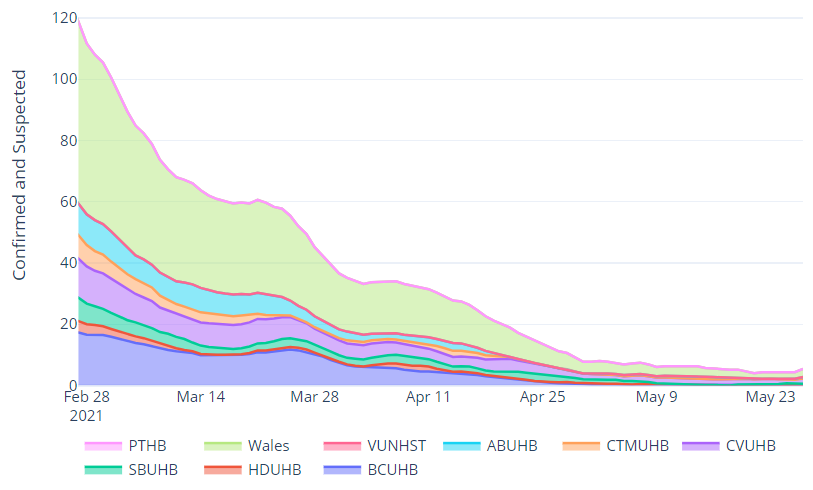
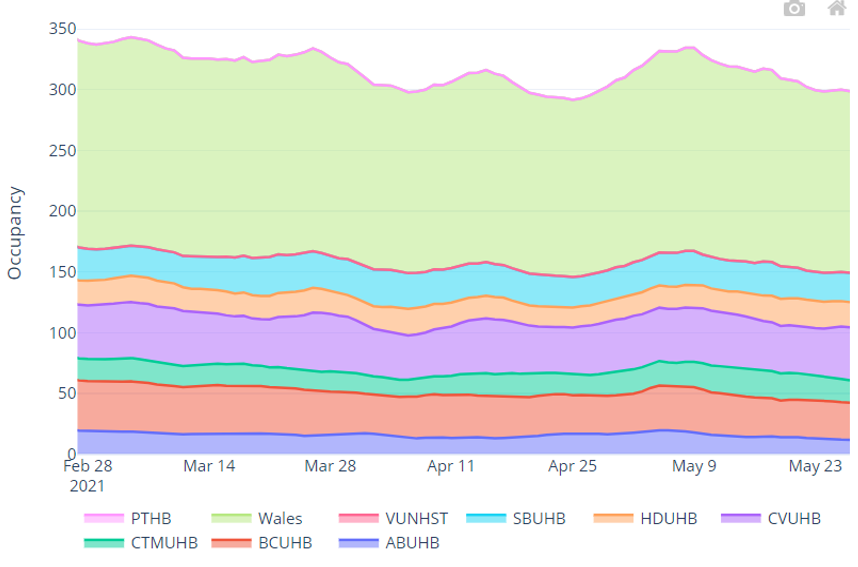
Hospital bed occupancy for suspected and confirmed COVID-19 positive patients (7 day rolling average)
Number of adult care homes reported an ongoing outbreak/incident (last 7 days)
What is the situation with education, children and young adults?
Childcare settings
The latest National Situation Background Assessment Recommendation (SBAR) covering the week of 24 May to 30 May reported no new or ongoing clusters in childcare settings.
Schools
The National SBAR for the above period reported 2 new clusters and 8 ongoing clusters associated with schools. There were 34 incidents attributed to a school setting and 24 attributed to household, social or extra-curricular activities.
IMTs report on two of the more notable clusters and the impact of the Delta VOC on a school:
- One Incident Management Team (IMT) reported a primary school cluster of 22 cases, including pupils, staff and family members, resulting in 2 school bubbles (56 pupils) required to self-isolate. All pupils tested and a Mobile Testing Unit (MTU) set up in the area.
- A dedicated IMT has been set up to manage a further cluster. A teaching assistant working with year 1 pupils has been identified as the index case. Teacher and pupil cases have been reported in years 1&3. All pupils in year 1&3 have been self-isolating and their contacts have undergone testing, with samples confirmed as the Alpha variant. Local authority communications have been issued and a MTU is in place. Total cases as 26/05/21 = 30
- Following a confirmed Delta VOC case, a class of school pupils were tested. Sequencing results are awaited, but one positive case is assumed to be the Delta VOC. Potential contacts have been tested and all of those tested returned negative results. One linked individual is symptomatic, resulting in their household being required to self-isolate. Source: National SBAR.
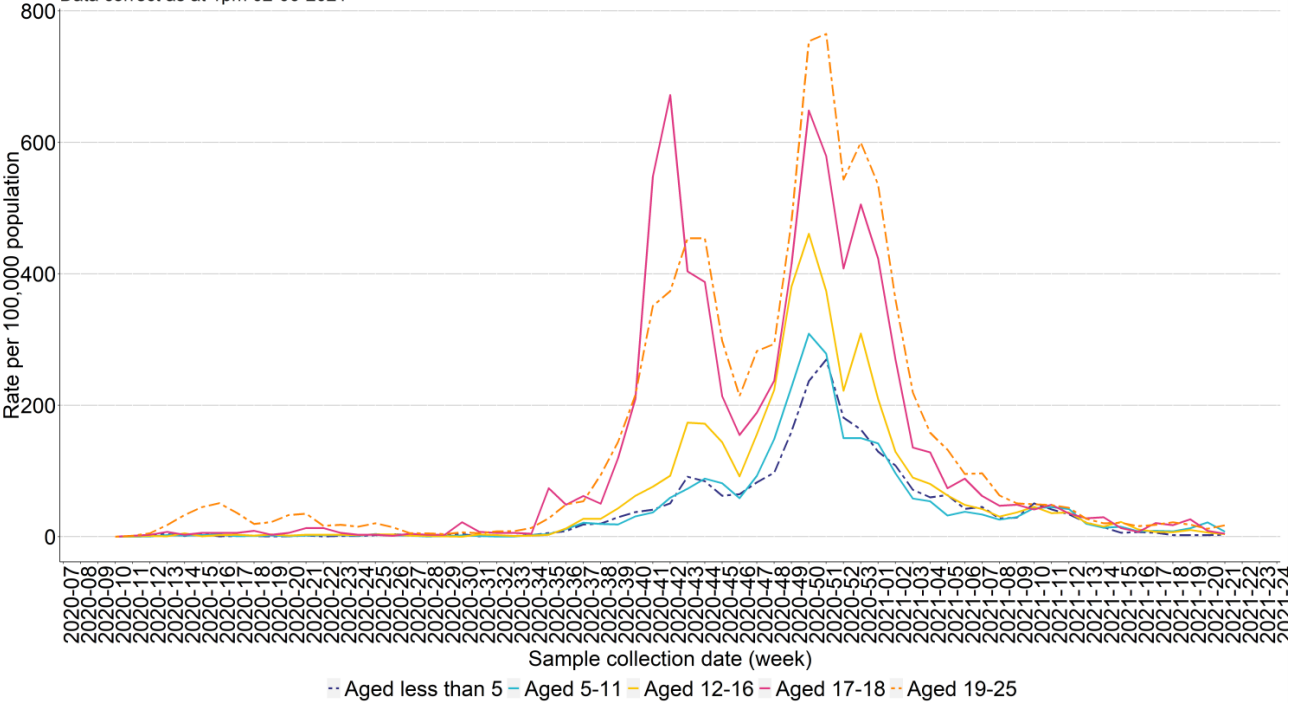
Weekly COVID-19 incidence per 100,000 population for school age children and young adults in Wales (data as at 1pm 02/06/21)
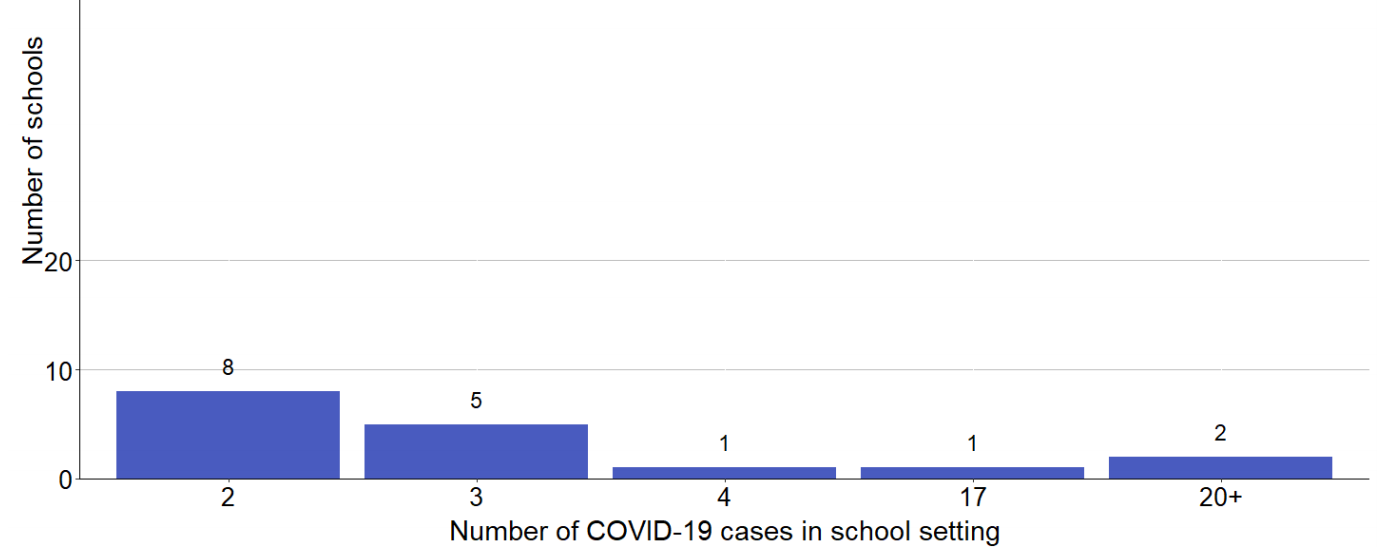
Schools with more than one COVID-19 case identified within the last 21 days, excluding 43 schools with 1 COVID-19 case
Epidemiological curve of cases in all staff and pupils linked to a school between 01 September 2020 to 31 May for all Wales maintained schools

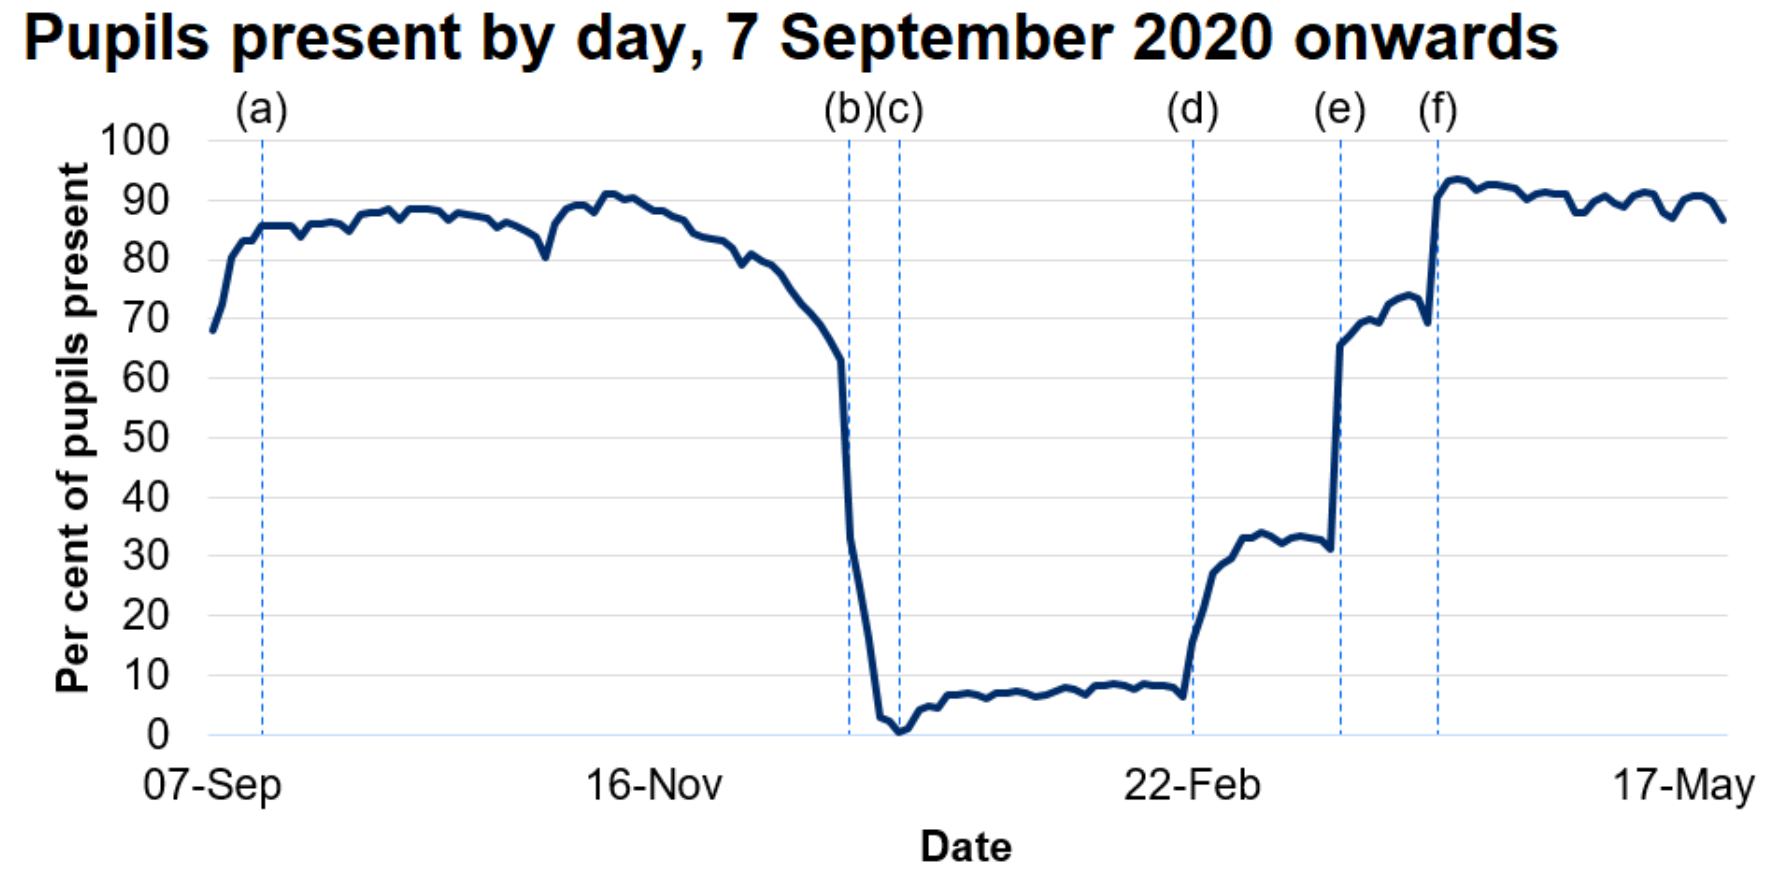
School Attendance
An average of 90% of all pupils were present in school over the week of 17 May to 21 May. This information is provisional and will be revised on 9 June. Source: Stats Wales
Further Education (FE)
There are no new or ongoing clusters within FE settings in Wales. Source: SBAR
Higher Education Institutions (HEIs)
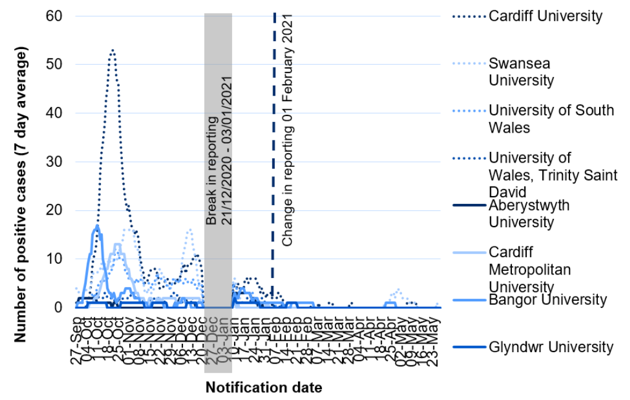
HEIs report cases notified to them by students and staff. From 1 February 2021 most HEIs have changed the way in which they report data, with positive cases referring only to students or staff attending campus or returning to the local area for study (with the exception of University of Wales Trinity St David's who are unable to split cases on this basis). Over the past week, the 7-day rolling average has been less than 1 positive COVID-19 cases for all HEI's. Source: Stats Wales
We now also capture data via the National SBAR from local IMTs. 1 new cluster of 2 linked cases in one residence on a university campus (cases were out of isolation on 29/05/21). There were 3 ongoing clusters reported over 2 health board areas, which is the same as the previous week. Source: National SBAR
There is currently voluntary lateral flow device (LFD) testing of childcare staff, school staff, FE and HEI staff; FE and HE students, and older secondary school aged pupils. Detailed information on LFD test outcomes is not yet available.
7 day rolling average of positive cases in Welsh universities 27 September to 23 May 2021
Please note: Due to accuracy & timeliness limitations with the capability of our surveillance systems, distinguishing exact case associations between children over 19, school staff and/or family members is currently not possible. We are looking to develop this with local health protection officers.
What does the situation look like going forward?
Based on the current rates observed with current restrictions:
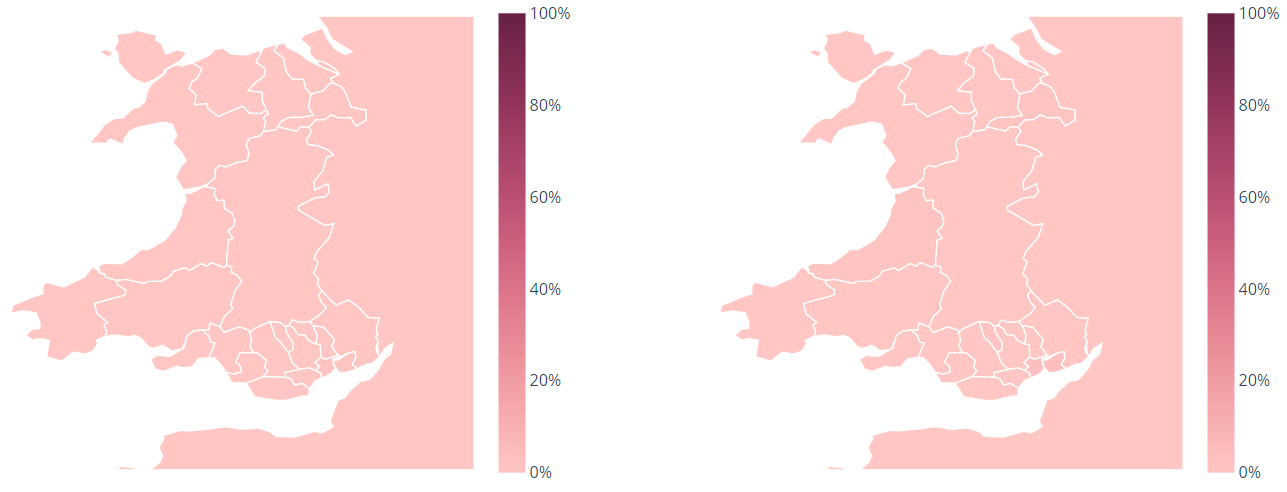
- Cases –the probability of incidence greater that 100 per 100,000 remains low for all local authorities. The figure illustrates the probability (between 0 – 100%) of incidence being greater than 100 per 100,000. Source: Imperial College London
Probability of greater than 100 per 100,000 cases by local authority, Wales
6 - 12 June and 13 - 19 June
- Deaths per day – continue to see small numbers over the next four weeks. Source: Modelled medium term projections, SAGE/SPI-M, 1 June
- Hospitalisations per day - continue to decrease to under 1 per day over the next four weeks. Source: Modelled medium term projections, SAGE/SPI-M, 1 June
Hospitalisations per day, Wales
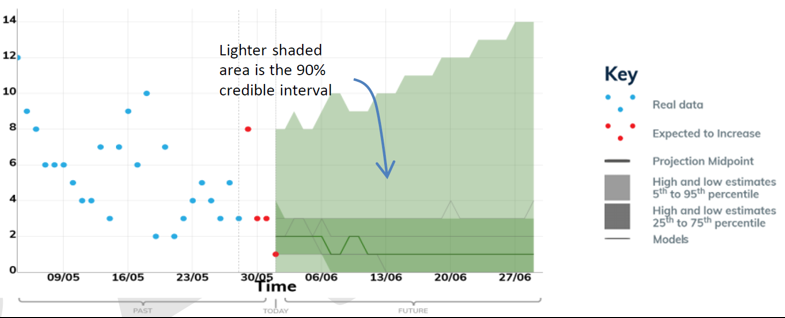
These projections are based on current trends and will not fully reflect the impact of policy or behavioural changes over the past two to three weeks. The projections include the impact of vaccines, but cannot capture any future increases in transmission resulting from new variants. They are not forecasts or predictions.
Projecting forwards is difficult when numbers fall to very low levels, therefore SPI-M-O have decided to pause producing medium term projections where this is the case. The small numbers can also introduce apparent inconsistency as regions are aggregated.
What is the situation with arriving travellers
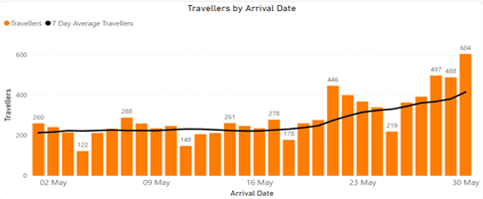
Traveller numbers have risen significantly in recent days with arrivals for Sunday 30th May almost double arrivals for Sunday 23rd May.
Arrivals from Portugal (Green List) have also seen a significant rise with over 230 arriving on Sunday 30th May alone. Week on week has seen an increase of over 400% in arrivals from Portugal. We anticipate further increases in these numbers at the end of this week (bank holiday/half term week).
- There has been an increase of 792 (31%) in the overall arrivals compared to last week.
- There have been no positive cases from Green list countries.
- Positive amber cases remain low.
- Overall arrivals are now rising significantly.
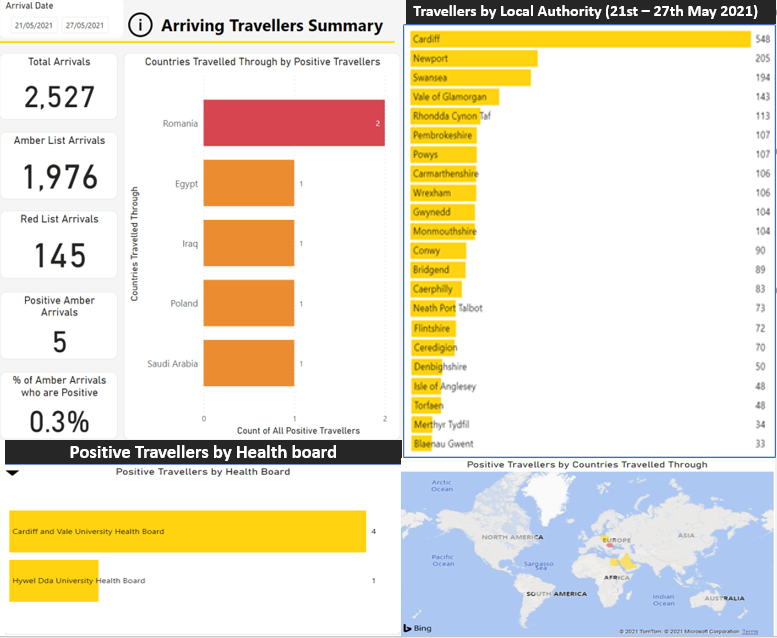
Source: Home Office, as at 30 May 2021
Please note that the data provided by the Home Office is derived from Passenger Locator Forms (PLF) which are self-completed by travellers. As such, data may contain inaccuracies. Due to the limitations associated with data capture and legislation, some minor discrepancies may be present in the data.
Mobility data, adherence and UK comparison
Mobility data up to 27 May, show mostly small increases in the last week, with a larger increase in retail & recreation. During this period residential mobility (i.e people spending time at home) decreased slightly to 5% above baseline. Workplaces rose slightly to 20% below baseline. Retail & recreation mobility increased to 7% below baseline and supermarkets & pharmacy increased to 12% above the baseline. Public transport and parks mobility also increased relative to the baseline. Source: Google
Mobility data by location of trip
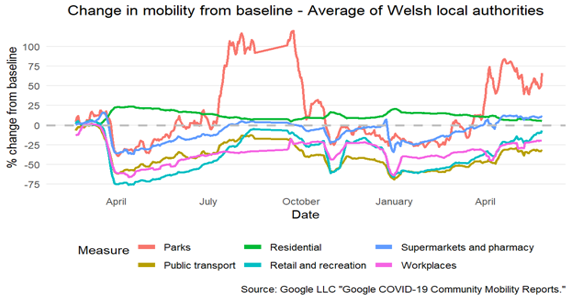
Source: Google
Adherence
IPSOS MORI data for 21 – 24 May for Wales reports reductions in some categories since 4 weeks ago, most notably a large reduction in those making essential trips only and avoiding public transport. Since the previous survey, Wales moved from alert level 4 to level 2 and restrictions on movement have eased. Note self-reported adherence is affected by individuals' understanding of rules and guidance. Source: IPSOS MORI
Results from the Coronavirus (Covid-19) Infection Survey, 23 to 29 May
Although positivity rates remain low for all four UK countries, positivity rates have increased in recent weeks, especially for England and Wales. In comparison, the positivity rate appears to have remained stable in the latest week to 29 May for Scotland and slightly increased in Northern Ireland.
During the most recent period, it is estimated that an average of 2,900 people in Wales had COVID-19 (95% credible interval: 1000 to 5,800), equating to around 1 in 1,050 people. This compares to around 1 in 640 people in England, around 1 in 680 people in Scotland, and around 1 in 800 people in Northern Ireland.
Source: Office for National Statistics COVID-19 Infection Survey
Positivity rates (%) across UK countries up to 29 May 2021
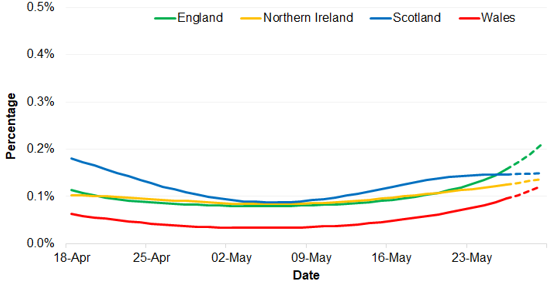
Source: Office for National Statistics COVID-19 Infection Survey
Key risks and sources
Key risks
Transmissions, incidence and prevalence
Overall transmission is slightly increasing but remains relatively low.
NHS Capacity
COVID-19 pressure on the NHS remains at a relatively low level. Some fluctuations are likely to occur, due to low numbers.
Mortality
Remains at a generally low level.
Variants
Additional cases of Delta variant (VOC21APR-02, first identified in India) have been detected in Wales, although numbers remain low. There is strong evidence of increased transmissibility and local intervention will likely be required to prevent uncontrolled growth and wider community transmission.
Immunity and vaccines
3.31 million doses of COVID-19 vaccine have been given in Wales. Of the 3.31 million doses given nationally, 2.16 million were first doses and 1.16 million were second doses.
International
Traveller numbers have increased compared to the previous week, following the addition of Portugal to the Green list. Positive amber cases remain low. There have been no positive cases from green list countries.