Land Transaction Tax statistics: July to September 2019
Our quarterly Welsh Revenue Authority (WRA) statistics on Land Transaction Tax (LTT). Data includes the number of land and property transactions, tax due and value of property taxed.
In this page
Main points
These statistics report on LTT transactions that we (the WRA) have received by 21 October 2019.
For LTT transactions with an effective date in July to September 2019:
- 16,360 transactions and £60.5 million tax due;
- 14,850 residential LTT transactions with £46.6 million tax due;
- of which, £18.5 million additional revenue was raised from the higher rates of the residential tax; and
- of which, £18.5 million additional revenue was raised from the higher rates of the residential tax; and
- 1,510 non-residential LTT transactions resulting in £13.9 million tax due.
These initial estimates for July to September 2019 are provisional. We will revise these estimates in the next statistics publication. This is because organisations are still able to report further transactions for September. Organisations have 30 days after the date of the transaction to report them to the WRA.
1. About these statistics
Introduction of LTT
From 1 April 2018, LTT replaced Stamp Duty Land Tax (SDLT) on residential and non-residential property and land interests purchased in Wales. The tax rates and tax bands for LTT vary depending on the type of transaction.
LTT statistics are not fully comparable to previous SDLT statistics because different rates and bands are used in LTT. The reliefs may also be different for the two taxes. For example, first time buyers’ relief applies to SDLT but not to LTT.
Value of LTT statistics
Timely information on activity in the property market is important for policy makers. When filing an LTT return, the organisation paying the return has 30 days after the effective date to submit and pay the return. LTT statistics therefore are relatively timely.
An important use of LTT statistics is forecasting LTT revenues for Wales in future. This is mainly done by the Welsh Government and the Office for Budget Responsibility.
Data available for LTT
All of the data used in this statistical release is available in a spreadsheet on the headline statistics page.
We published new detailed datasets for LTT on the StatsWales website in June 2019. This includes annual data by:
- local authority
- Assembly Constituency (for residential transactions only)
- level of deprivation, using the Welsh Index of Multiple Deprivation (for residential transactions only)
- built up areas, published on 31 October 2019 (for residential transactions only)
For data at the Wales level, we provide links to the relevant StatsWales datasets throughout this release.
Timing of and revisions to LTT statistics
The diagram on the key quality information page explains the timing of LTT statistics. Estimates presented for September 2019 and the quarter July to September 2019 are provisional. Revised estimates are presented for earlier periods. The provisional data will be revised in future, as not all tax returns for these periods may yet have been received.
Statistics for earlier periods may continue to be revised in future, to account for any amendments to transactions. In particular, this will be due to higher rate refunds being made for several years after the date of the original transaction.
Key quality information and glossary pages
Users should refer to the separate glossary and key quality information while reading this statistical release. We define relevant terms in the glossary as they are used in this release. The key quality information page describes how Land Transaction Tax statistics meet the Code of Practice for Statistics and the dimensions of value, trustworthiness and quality.
Properties or land sold more than once
These statistics relate to transactions which were effective in particular month, quarter or year. A property or piece of land may have been sold more than once in that time, and if so, would feature multiple times in the statistics. For example in 2018-19, our best estimate is that between 3.5% and 4% of transactions involved a piece of land or property which has been sold more than once in the year.
Symbols used in this release
r This value has been revised in this publication
p This value is provisional and will be revised in a future publication
2. Transactions, tax due and property value taxed
Figure 2.1 Number of reported notifiable transactions, by effective date [1]

By the close of 21 October 2019, we received details of 16,360 notifiable transactions with an effective date in July to September 2019. In future, we expect to receive a small number of further notifications for this period.
In July to September 2019, 91% of transactions were residential and 9% were non-residential. These are similar percentages to previous three-month periods.
Figure 2.2 Tax due on reported notifiable transactions, by effective date [1]
![]()
By the close of 21 October 2019, £60.5 million tax was due for transactions with an effective date in July to September 2019.
There can be seasonal patterns in the property market, with higher levels of activity generally seen in the summer. These effects are also seen in the levels of transactions and tax due. Therefore, it can helpful to compare July to September 2019 data with the same period in 2018.
Comparing July to September 2019 data with the same period in 2018, there was a very small increase in the overall figure for tax due.
However, in our monthly and quarterly statistics, we are gradually revising downwards the tax due for earlier periods. This is because of higher rate refunds being paid out in each month (for higher rates residential transactions which were effective in earlier periods, back to April 2018).
The July to September 2018 value will have already been subject to some of this downward revision, whereas the equivalent figure for 2019 won’t yet. In future, there will be some upward revisions to the 2019 figure due to late transactions. Taking these two facts together and the small increase mentioned above, our best estimate of the eventual change between the two periods is nil.
Figure 2.3 Value attributed to properties subject to LTT, by effective date [1]
![]()
The value of property taxed in July to September 2019 was £3.3 billion. This was £0.1 billion lower than in the same period in 2018.
Separately, the rental value for newly granted non-residential leases was £307 million in July to September 2019. This is lower than in the same period in 2018.
Figure 2.4 Number of reported notifiable transactions, by month transaction was effective

The numbers of transactions by effective month has varied greatly since April 2018. Higher numbers were generally seen in the second half of 2018, peaking in November 2018. This was partially due to there being five Fridays in November 2018 (Figure 10.8 in section 10 of our annual statistical release shows that nearly half of transactions have an effective date that is a Friday).
In March 2019, there was an increase from the previous month in non-residential transactions. This may be expected, as it is common for non-residential leases to be renewed at the end of the financial year.
The monthly numbers of transactions in each of the months from July to September 2019 were at a broadly similar level to the same period in 2018.
Figure 2.5 Tax due on reported notifiable transactions, by effective month
![]()
As may be expected, similar trends are seen in the monthly tax due as are seen in the monthly counts of transactions.
However, there is greater volatility in this comparison when considering only non-residential transactions.
The tax due for non-residential transactions also makes up a larger share of total tax due than the share of the number of transactions. The same is true for the additional revenue from higher rates residential transactions.
Figure 2.6 Transactions by transaction type, July to September 2019
![]()
The value of the properties associated with conveyances and transfer of ownership during July to September 2019 was £3.2 billion (not shown in Figure 2.6).
Most transactions in July to September 2019 were associated with a conveyance or a transfer of ownership. This figure was 94% for residential transactions and 65% for non-residential transactions.
A new lease was granted in nearly a third of non-residential transactions (compared with 2% of residential transactions).
Similar percentages are seen for previous three-month periods.
LTT statistics by transaction type and transaction description on StatsWales
3. Residential transactions by value
Figure 3.1 Number of residential transactions, by residential tax band and quarter the transaction was effective

Figure 3.2 Tax due on residential transactions, by residential tax band and quarter the transaction was effective
![]()
For each tax band, Figures 3.1 and 3.2 show the quarterly trends in the number of residential transactions and tax due. There are six residential tax bands. We have combined the largest three bands here to show results for properties with a purchase price of greater than £400,000.
Similar seasonal trends for the tax bands can be seen in both numbers of transactions and tax due. Most of the tax bands show a rise in transactions and tax due in July to September (compared with April to June).
However, there is greater volatility in the trends when considering the tax due on properties in the higher value bands.
Figure 3.3 Number of residential transactions and tax due on those properties, by residential tax band, July to September 2019
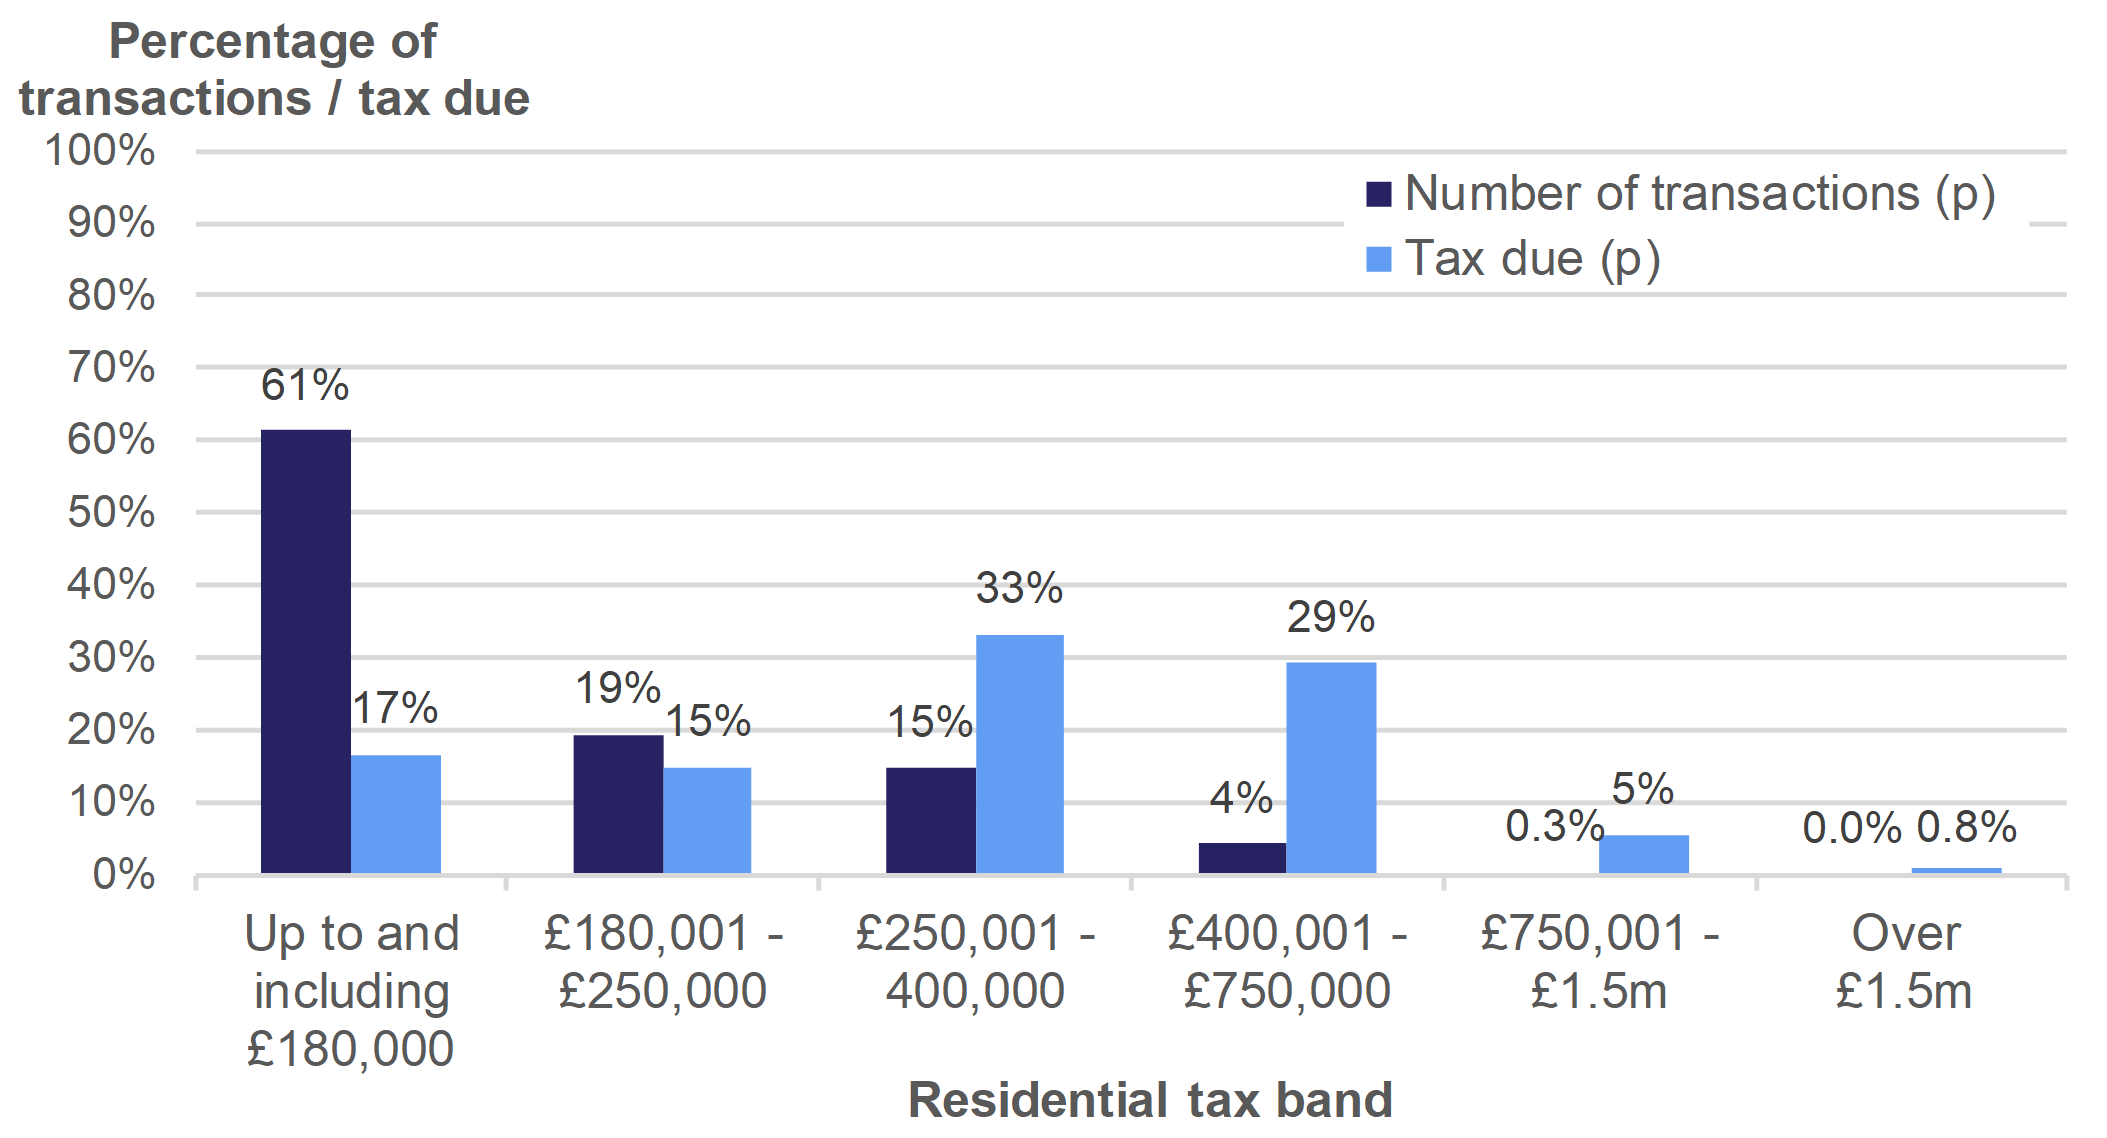
Nearly two thirds of residential transactions were within the first tax band (purchase price £180,000 or lower). Although the main tax rate on residential transactions of up to £180,000 is 0%, these transactions still accounted for around a sixth of total residential tax due, which relates to the higher rates residential component of the tax.
Combining the fourth, fifth and sixth bands (purchase price of greater than £400,000), these accounted for only 5% of transactions. However, the tax due for these transactions accounted for 35% of the total residential tax due.
LTT statistics by time period and residential transaction value on StatsWales
4. Non-residential transactions by value
Figure 4.1 Number of non-residential transactions, by value and effective date [1]

Figure 4.2 Tax due on non-residential transactions, by value and effective date [1]
![]()
Figures 4.1 and 4.2 show that there were 1,510 non-residential transactions effective in July to September 2019 with £13.9 million tax due. The value for April to June 2019 has also been revised upwards substantially since last published. This is due to a few late notifications accounting for a large amount of tax due.
In each three-month period since April 2018, around 50% to 70% of the tax due has been contributed by transactions with a non-rental value great than £1 million. In each three-month period, between 10% and 30% of the tax due has been contributed by the rental value of non-residential properties.
Figure 4.3 Number of non-residential transactions, by value, July to September 2019

Figure 4.4 Tax due on non-residential transactions, by value, July to September 2019
![]()
Figure 4.3 shows that in July to September 2019, 6% of non-residential transactions had a non-rental value of more than £1 million. These transactions accounted for 62% of the non-residential tax due (Figure 4.4).
Figure 4.3 also shows that for 30% of non-residential transactions, a rental value was associated with the property (which contributed to the tax paid on the transaction).
The rental value of non-residential properties accounted for 14% of the total non-residential tax due (Figure 4.4).
LTT statistics by time period and non-residential transaction value on StatsWales
5. Reliefs
Reliefs can be claimed on both residential and non-residential properties. Reliefs reduce the amount of tax due when certain conditions are met. More than one relief can be applied to a single transaction. Reliefs may reduce the tax due to zero (known as a full relief) or by a certain percentage or amount (known as a partial relief).
Figure 5.1 Number of transactions relieved, by quarter the transaction was effective [1]

Figure 5.1 shows that there were 310 non-linked transactions in July to September 2019 with reliefs applied to them that reduced the associated tax due.
On average, there are around 100 reliefs claimed in each three-month period which had no impact on the tax due. These reliefs are excluded from Figure 5.1. Many of them have been reported unnecessarily by the organisations completing the tax return. As an example, some of these apply to low value residential transactions. Indications are that they are due to a perceived but mistaken need to claim first time buyer relief (which applies for the predecessor tax, but not to LTT). This is known following queries raised with several agents asking why tax reliefs have been claimed where there is no impact on value of the tax. Further information about this category of reliefs is provided in Example 4 in our key quality information.
This example also describes some adjustments that have been made to more correctly identify the value of tax relieved associated with these transactions. We expect further adjustments in future and we therefore expect to revise this final item in Figure 5.1 in future.
Figure 5.2 Tax relieved, by quarter the transaction was effective [1]
![]()
Figure 5.2 shows that in July to September 2019, the total value of reliefs claimed for non-linked transactions was £12.8 million. This is less than the same three-month period in 2018.
For each three-month period since April to June 2018, the numbers of reliefs claimed on residential transactions was higher than for non-residential transactions. However, in each three month period, non-residential transactions contributed most (between 50% and 90%) of the total value of reliefs claimed.
Further data on reliefs, including quarterly data by type of relief, is available on StatsWales at the link below.
LTT statistics on reliefs by measure and transaction type on StatsWales
6. Higher rate refunds
Figure 6.1 Number and value of refunds of higher rate residential issued, by effective date [1]

When a refund for higher rates residential LTT is claimed, the original transaction is amended to a main rate residential LTT transaction. The data in this release is adjusted for any refunds approved by WRA up to and including 21 October 2019.
Figure 6.1 shows that 1,200 higher rate refunds were claimed for transactions effective in 2018-19, with £9.2 million refunded to taxpayers. These values have been revised upwards since our previous quarterly release in July 2019.
Taxpayers have up to three years to sell their previous main residence and claim a refund. Therefore, all the values in Figure 6.1 will continue to be revised upwards in future editions of our statistics. There will be a consequent reduction in the total tax due shown in other tables.
The number and value of refunds presented for July to September 2019 are lower than for earlier periods. This is because compared with earlier periods, not enough time has passed since the transaction was effective for many of the relevant taxpayers to sell their previous main residence and claim their refund.
For all higher rates transactions, the WRA asks the question whether the taxpayer intends to reclaim the higher rates element in future. While it will take several years before we know how likely someone is to claim based on their stated intentions (it can take up to three years to make the claim), we do currently know that around 70% of those who do claim answer this question in the positive.
LTT statistics on higher rate refunds by original transaction date on StatsWales
Additional data on higher rate refunds
Another useful way of presenting data on higher rates refunds is to use the date when the refund was approved by the WRA. A dataset using these dates, and also the effective date of the original transaction, can be found on the StatsWales website at the link below:
Further information on the refund payments made to taxpayers, by the month in which they were made, can be found in Table 6a of our monthly and quarterly statistics
In the main, these additional data are provided to support forecasting requirements.
7. Tax paid
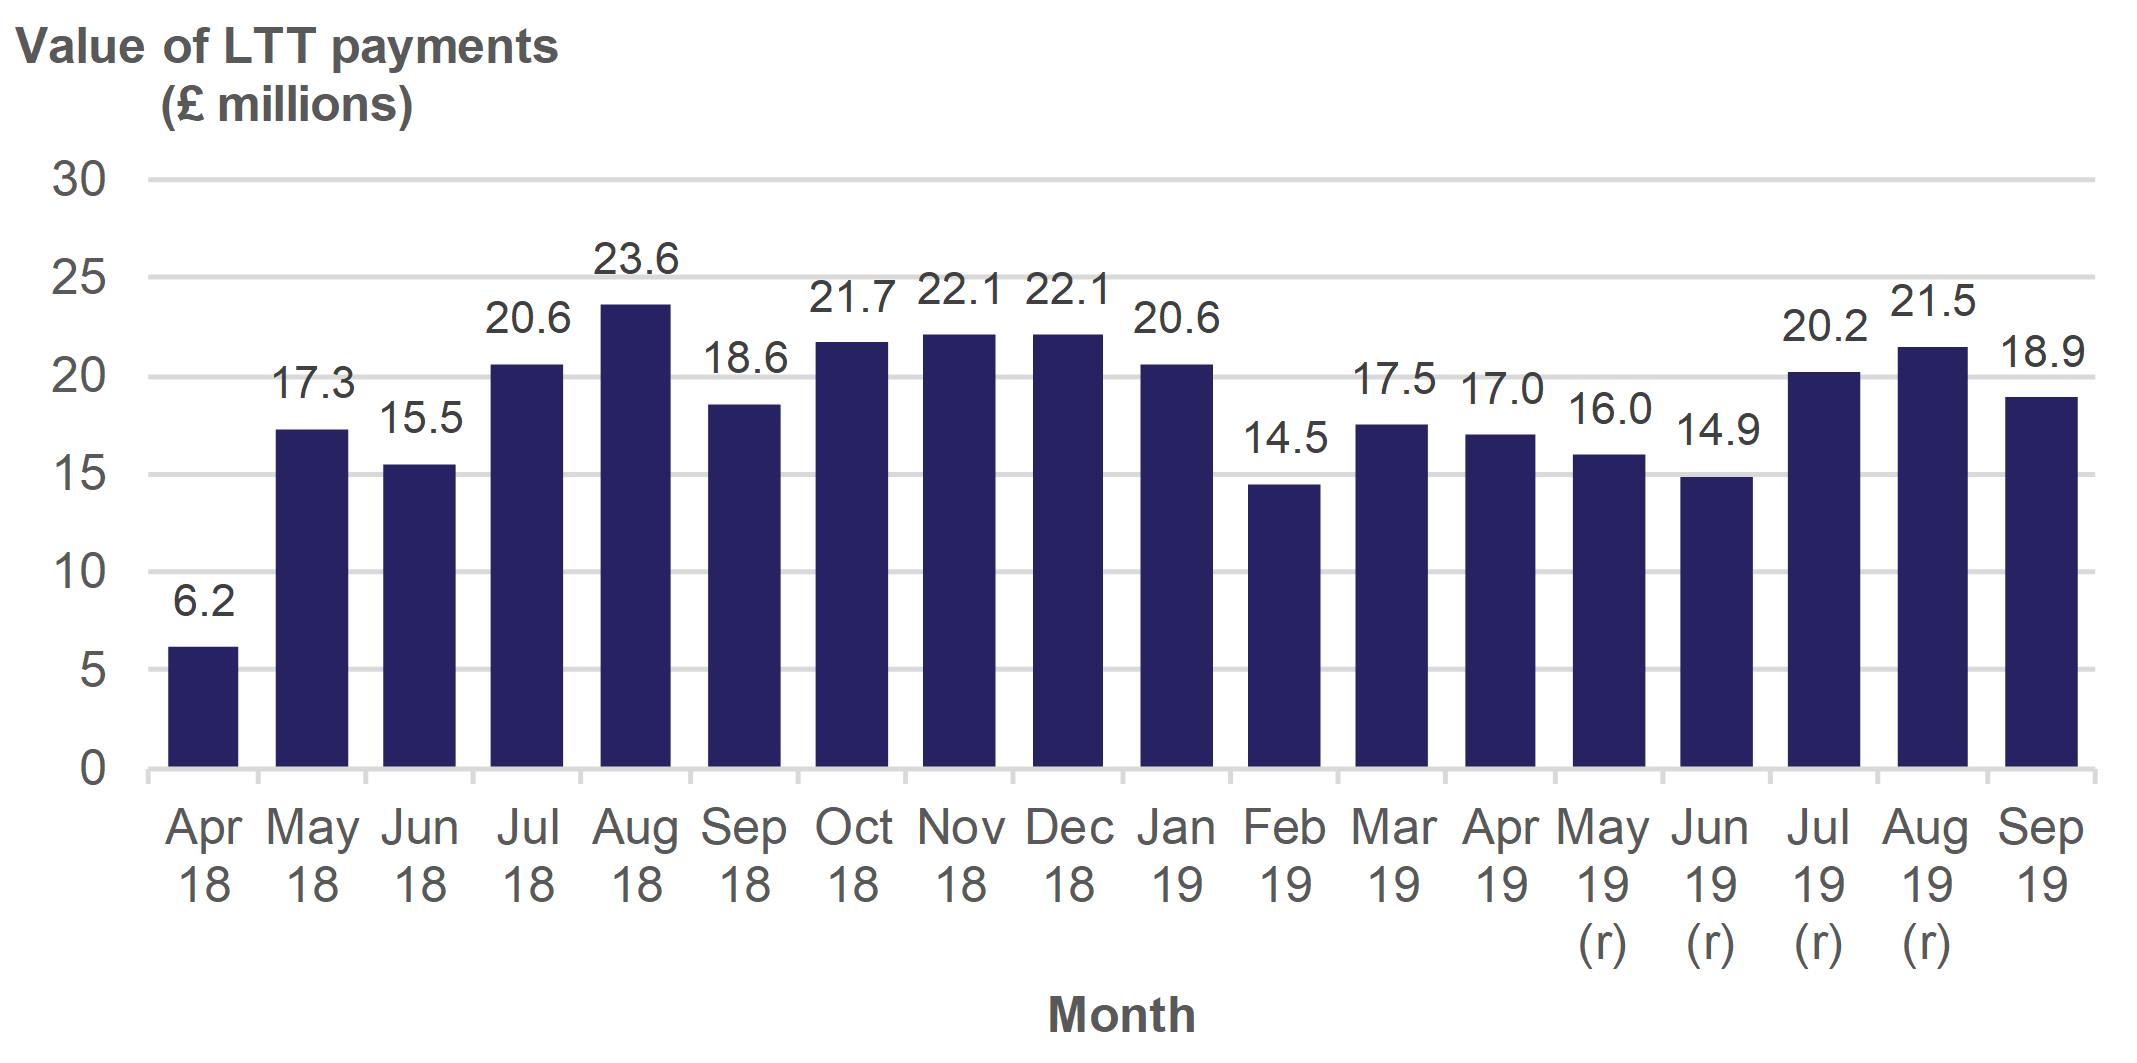
Figure 7.1 Land Transaction Tax (LTT) paid to the Welsh Revenue Authority (WRA)
Unscheduled revisions made in Figure 7.1
Compared with our data-only update published last month, we have revised downwards the values for May to August 2019. These revisions arise from a processing error that was discovered as part of the calculation of the September figures. For May to August 2019, the total downward revision was around £3 million.
Analysis of Figure 7.1
In 2018-19, the WRA received £220.2 million in LTT payments. These figures are less than those reported in Figure 2.2 as they relate to the payments actually received in each month (often referred to as ‘on a cash basis’), as opposed to the amounts due on transactions that were effective in the month.
In particular, there is a difference in April 2018 as the WRA only started collecting the tax in that month. Therefore, no payments relating to transactions effective in earlier months were relevant.
Receipts in July, August and September 2019 were less than receipts for the same months a year earlier.
Annex A: Analysis of revisions
In this annex, we look at the effect of the regular revisions made to Land Transaction Tax statistics. We analyse the differences between the first, second and third estimates published for a particular month, for both the number of transactions and the tax due.
For example, we have published three estimates for July 2019. We published the first estimate on 23 August 2019, published the second estimate on 20 September and the third estimate on 31 October 2019.
Figure A1 Percentage change between the first and second estimates, by month transaction was effective

Figure A1 shows that higher levels of revisions can generally be seen in the earlier months that the WRA began collecting LTT. This is particularly the case for the tax due for transactions with an effective date in April 2018, where there was a 30% increase in the estimate of tax due (from the first to the second estimate for the month). A larger revision in April was expected because the familiarity of the system to users would have been lower, and also because an earlier cut-off date in the following month was used to extract the data. Nevertheless, the 30% figure in terms of tax due is considerably higher than the equivalent figure for the number of transactions (10%). It is explained by a few larger transactions with an effective date late in April that were not reported to WRA until later in May (before the 30 day filing limit, but after the cut-off date for the April publication).
Figure A1 also shows the levels of revisions have generally decreased over time. Since October 2018, the revisions between the first and second monthly estimates have generally been between 0 and 3%. An exception was in June 2019 when the tax due was revised up by 9% between the first and second estimate. The lower level of revisions generally seen now is likely to be due in part to an increasing familiarity with the system amongst solicitors and conveyancers completing the returns. It is consistent with a general decrease in the time taken for returns to be filed with the WRA over the same period (not shown in tables or charts).
There may also be seasonal effects in the data. For example, we saw higher revisions for the July 2018 estimates than the months around it. However, we do not see any obvious seasonal patterns in data for 2019 so far. We will require at least another year’s worth of data to properly assess any data seasonality.
A downward revision was made to the non-residential tax due for April 2019 (between the first and second estimates). A non-residential transaction effective in April 2019 was entered incorrectly as being overly large and was later revised.
Revisions between second and third published estimates
In a spreadsheet published alongside this statistical release, Tables A1 and A2 show the difference between first, second and third published estimates for a month.
Relatively small increases are seen between the second and third estimates for a month. In general, this is also the case for the later estimates for a month (not shown in the tables). However, falls may be seen in the second, third and later estimates of tax due for a particular month. This is because the data are shown net of any refunds for higher rate residential transactions. These refunds may be claimed several years after the effective date of the original transaction. We analyse refunds in section 6 of this statistical release.
In future, we may consider applying a grossing factor to the first estimates for a particular month. This may help reduce the revisions required to the first estimate for a month. With the volatility shown in the data to date, it is likely we will need several years of LTT data in order to calculate appropriate grossing factors.
In general, larger revisions are seen in the data on non-residential transactions than for residential transactions. This reflects the more volatile nature and often larger size of non-residential transactions.
Links to key quality information and glossary pages
The key quality information page describes how our Land Transaction Tax statistics meet the Code of Practice for Statistics and the dimensions of value, trustworthiness and quality.
We define relevant terms in the glossary as they are used in this release.
Feedback and contact details
We would be grateful for your feedback on these statistics, to help us improve them.
Dave Jones
Email: data@wra.gov.wales
Rydym yn croesawu galwadau a gohebiaeth yn Gymraeg / We welcome calls and correspondence in Welsh.
Media
Email: news@wra.gov.wales
Rydym yn croesawu galwadau a gohebiaeth yn Gymraeg / We welcome calls and correspondence in Welsh.