
The 2014-based projections provide estimates of the size of the future population and are based on assumptions about births, deaths, and migration.
This is not the latest release in the series: Subnational population projections
The assumptions are based on past trends. Projections done in this way do not make allowances for the effects of local or central government policies on future population levels or distribution; they indicate what is expected to happen if these trends continue.
These 2014-based projections are trend-based projections for the 25-year period from 2014 to 2039. As they are trend-based they become less certain the further they are carried forward. They are based on mid-year population estimates for 2014 which are the first population estimates to be based on the 2011 Census. They also incorporate the revised population and migration estimates for mid-2004 to mid-2014 that were published by the Office for National Statistics in 2016.
Projected population
- Cardiff is projected to increase the most, up 26% with Wrexham the next largest at 10%.
- The population of Powys is projected to fall the most down 8%.
- The populations of Gwynedd, Wrexham, Ceredigion, Swansea, Bridgend, Cardiff, Rhondda Cynon Taf, and Newport are projected to increase steadily between 2014 and 2039.
- The populations of the Isle of Anglesey, Blaenau Gwent, and Powys are projected to decrease steadily between 2014 and 2039.
- The populations of Conwy, Denbighshire, Flintshire, Carmarthenshire, Neath Port Talbot, the Vale of Glamorgan, Caerphilly and Monmouthshire are projected to increase then decrease, but to remain higher in 2039 than in 2014.
- The populations of Pembrokeshire, Torfaen and Merthyr Tydfil are projected to increase then decrease but to finish lower in 2039 than in 2014.
Assumed migration
- Net international migration varies between 400 and -100 for most local authorities with the exception of Cardiff (900), Swansea (800), and Gwynedd (500).
Projected births and deaths
- For the year mid-2014 to mid -2015 there were more deaths than births for about one-third of local authorities.
- By the end of the projection period the number of authorities for which there were more deaths than births is projected to around two-thirds.
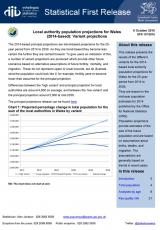
Variant projections
- Differences between the ‘high variant’ and principal projection for local authorities are around 4,600 on average, and between the ‘low variant’ and the principal projection around 5,900 at mid-2039.
Reports

Local authority population projections, 2014-based , file type: PDF, file size: 671 KB
Local authority population projections, 2014-based: variant projections , file type: PDF, file size: 814 KB
Data
Datasets and interactive tools

Population projections for local authorities, 2014-based: further results , file type: XLSX, file size: 763 KB
Contact
Martin Parry
Email: stats.popcensus@gov.wales
Rydym yn croesawu galwadau a gohebiaeth yn Gymraeg / We welcome calls and correspondence in Welsh.