
Local authority revenue and capital outturn expenditure: April 2025 to March 2026
Includes data for police, fire and national park authorities for April 2025 to March 2026.
In this page
Introduction
This statistical release analyses the revenue and capital expenditure that Welsh local authorities spent in the financial year prior to April 2026.
Revenue expenditure is the cost of running local authority services such as staffing, heating, lighting and cleaning, together with expenditure on goods and services consumed within the year.
Capital spending is mainly buying, constructing or improving physical assets such as buildings, land and vehicles.
This report only deals with financial years, for example, April 2025 to March 2026. These will be displayed as 2025 to 2026. When comparing date ranges, we use the end date of the financial year. For example, 'between 2016 and 2018' refers to the period between financial years 2015 to 2016 and 2017 to 2018.
The data are provided on the revenue outturn (RO) and capital outturn (COR) returns submitted by all (in Wales):
- 22 unitary authorities
- 4 police and crime commissioners
- 3 fire and rescue authorities
- 3 national park authorities
Detailed information over time and at a local authority level is published in the associated data tables (MS Excel) and on the StatsWales website (Revenue) and StatsWales website (Capital).
Main points
In 2025 to 2026:
- total revenue expenditure by Welsh local authorities increased by 3.5% to £11.8 billion; this is the lowest annual percentage increase since 2019 to 2020
- revenue expenditure per head was £3,701 or £138 higher than the previous year
Over time, statutory services such as education and social services have been protected (with social services having seen the biggest increase in expenditure). However, other services such as libraries, roads and transport and planning have seen overall reductions since 2010 to 2011. Education and social services now account for 71% of overall unitary authority expenditure compared with 59% in 2010 to 2011 and 60% in 1999 to 2000.
Capital expenditure increased by 6.7% in 2025 to 2026 to £2,271 million or £715 per head of population. This represents an increase of £143 million over the previous year.
In general, capital expenditure is more volatile and can be impacted heavily by large investments or adjustments. Expenditure increased in 2025 to 2026 partly due to increases in planning and development and transport.
Most of this capital expenditure was spent by unitary authorities, with police, fire and national park authorities reporting expenditure of £84 million, £15 million and £6 million respectively.
Revenue outturn
Figure 1: breakdown of unitary authority revenue expenditure, between 2000 and 2026
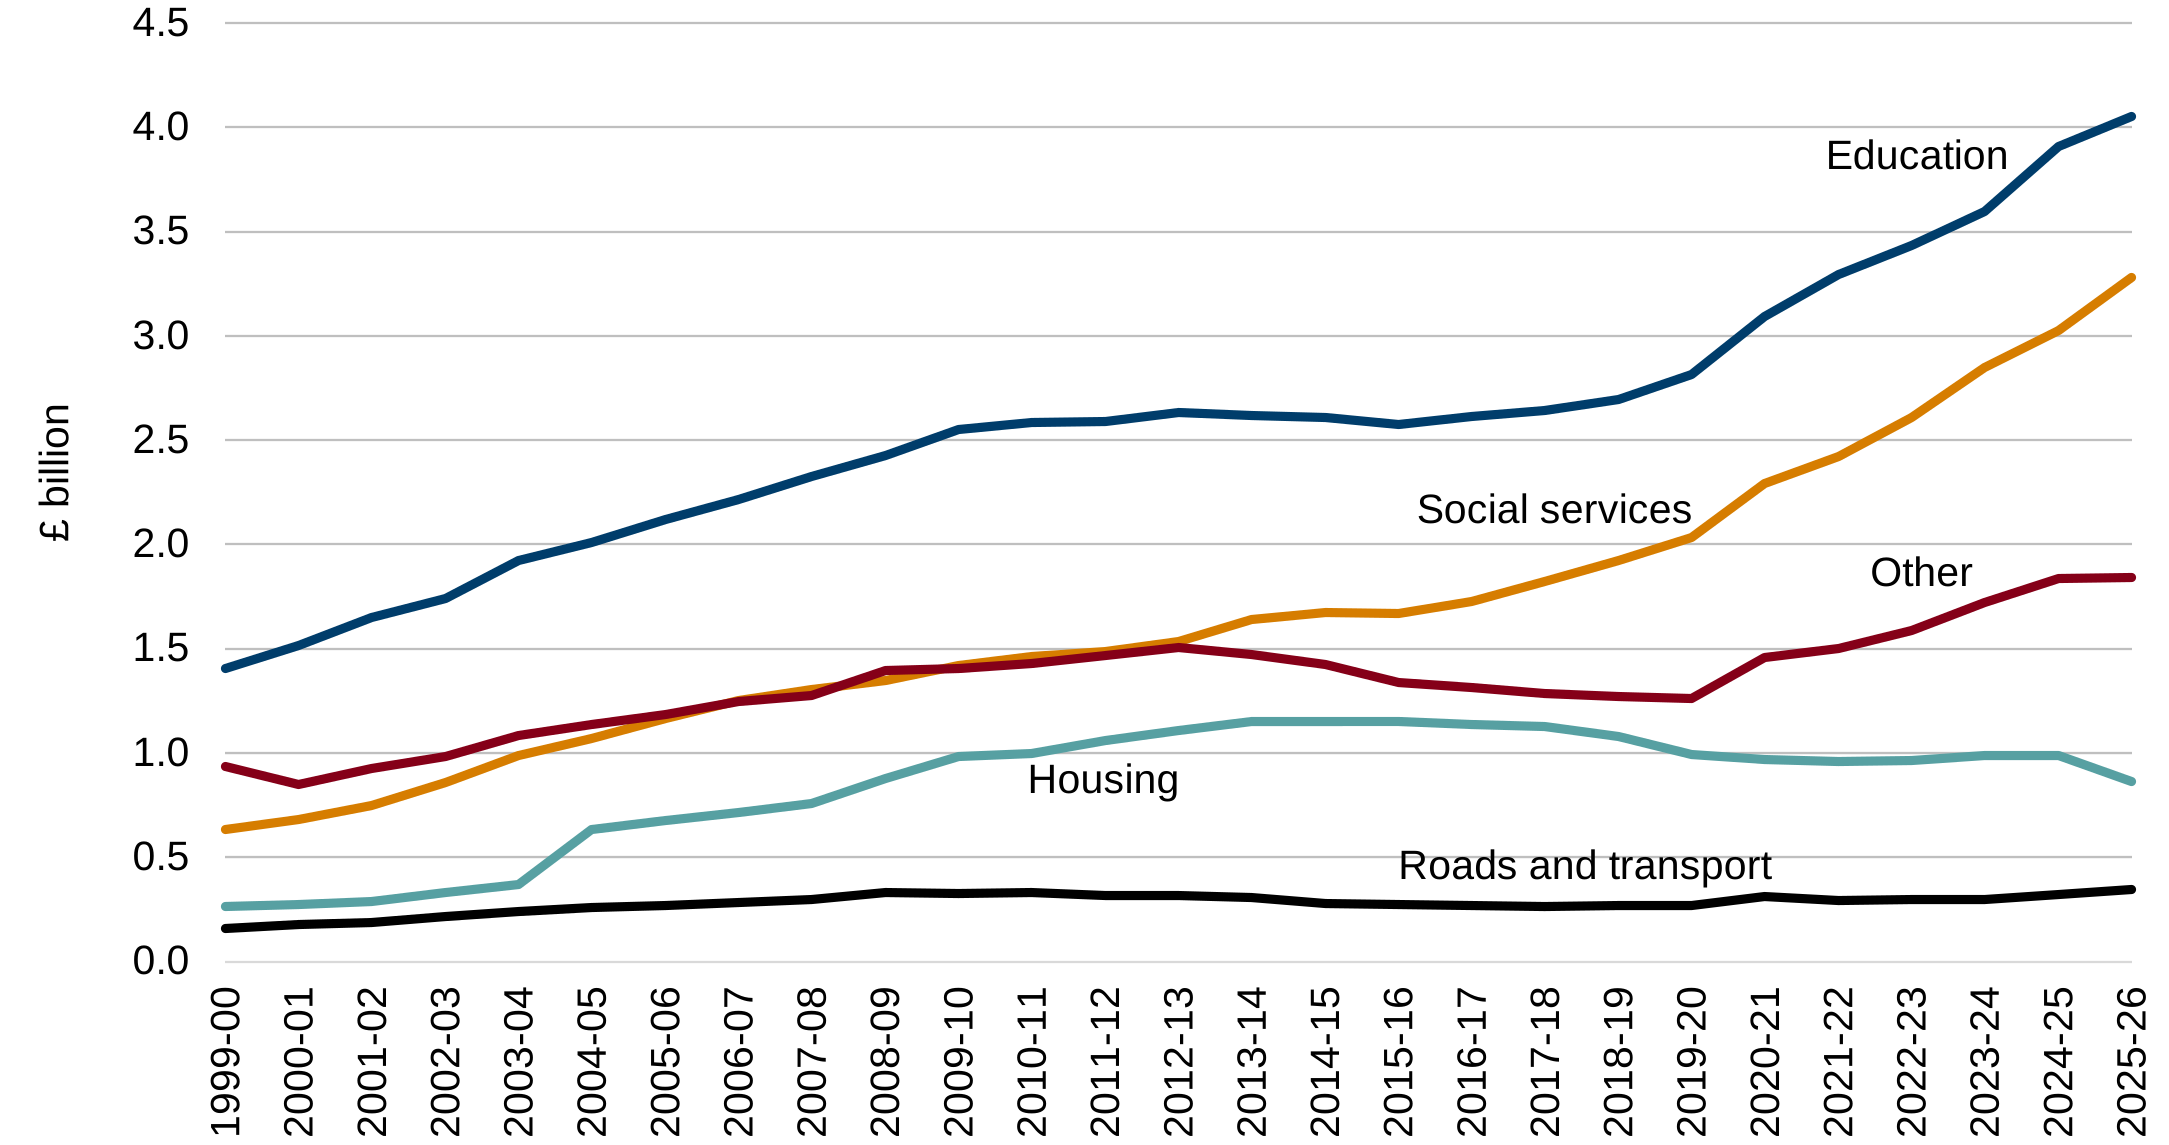
Description of figure 1: a line chart showing a breakdown of revenue expenditure over time by service. Education and social services have seen larger increases over time than other services.
Source: Welsh Government revenue outturn returns
More data on revenue outturn and capital outturn can be found in the associated data tables (MS Excel) and on the StatsWales website (Revenue) and StatsWales website (Capital).
Figure 2: distribution of unitary authority revenue expenditure, between 2000 and 2026
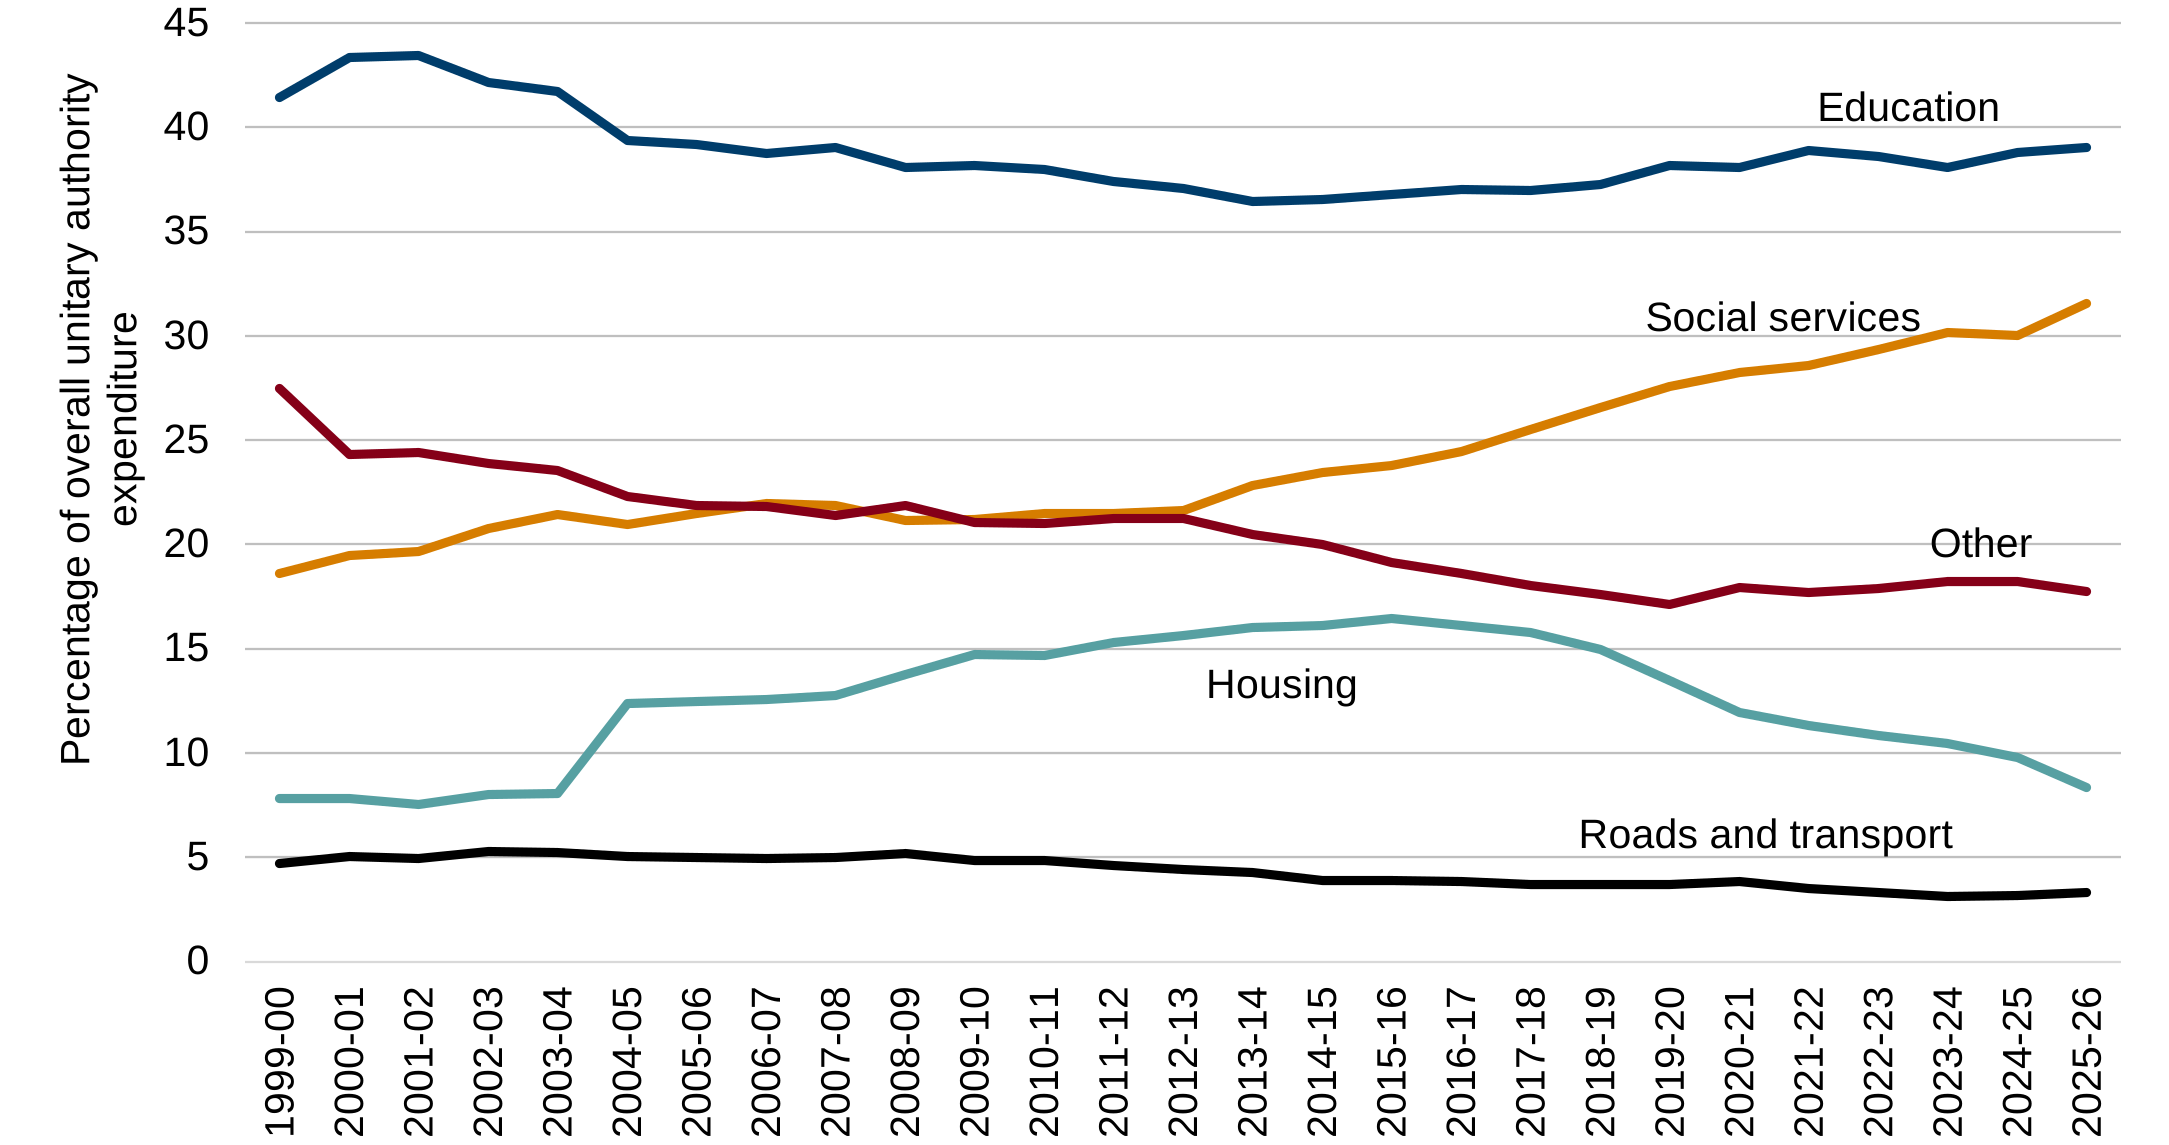
Description of figure 2: a line chart showing the proportion of total expenditure by individual service. Social services has seen its proportion of total expenditure increasing over time. The proportion spent on housing has fallen since 2015 to 2016.
Source: Welsh Government revenue outturn returns
More data on revenue outturn and capital outturn can be found in the associated data tables (MS Excel) and on the StatsWales website (Revenue) and StatsWales website (Capital).
Figure 3: real terms breakdown of unitary authority revenue expenditure, between 2000 and 2026, (2026 prices)
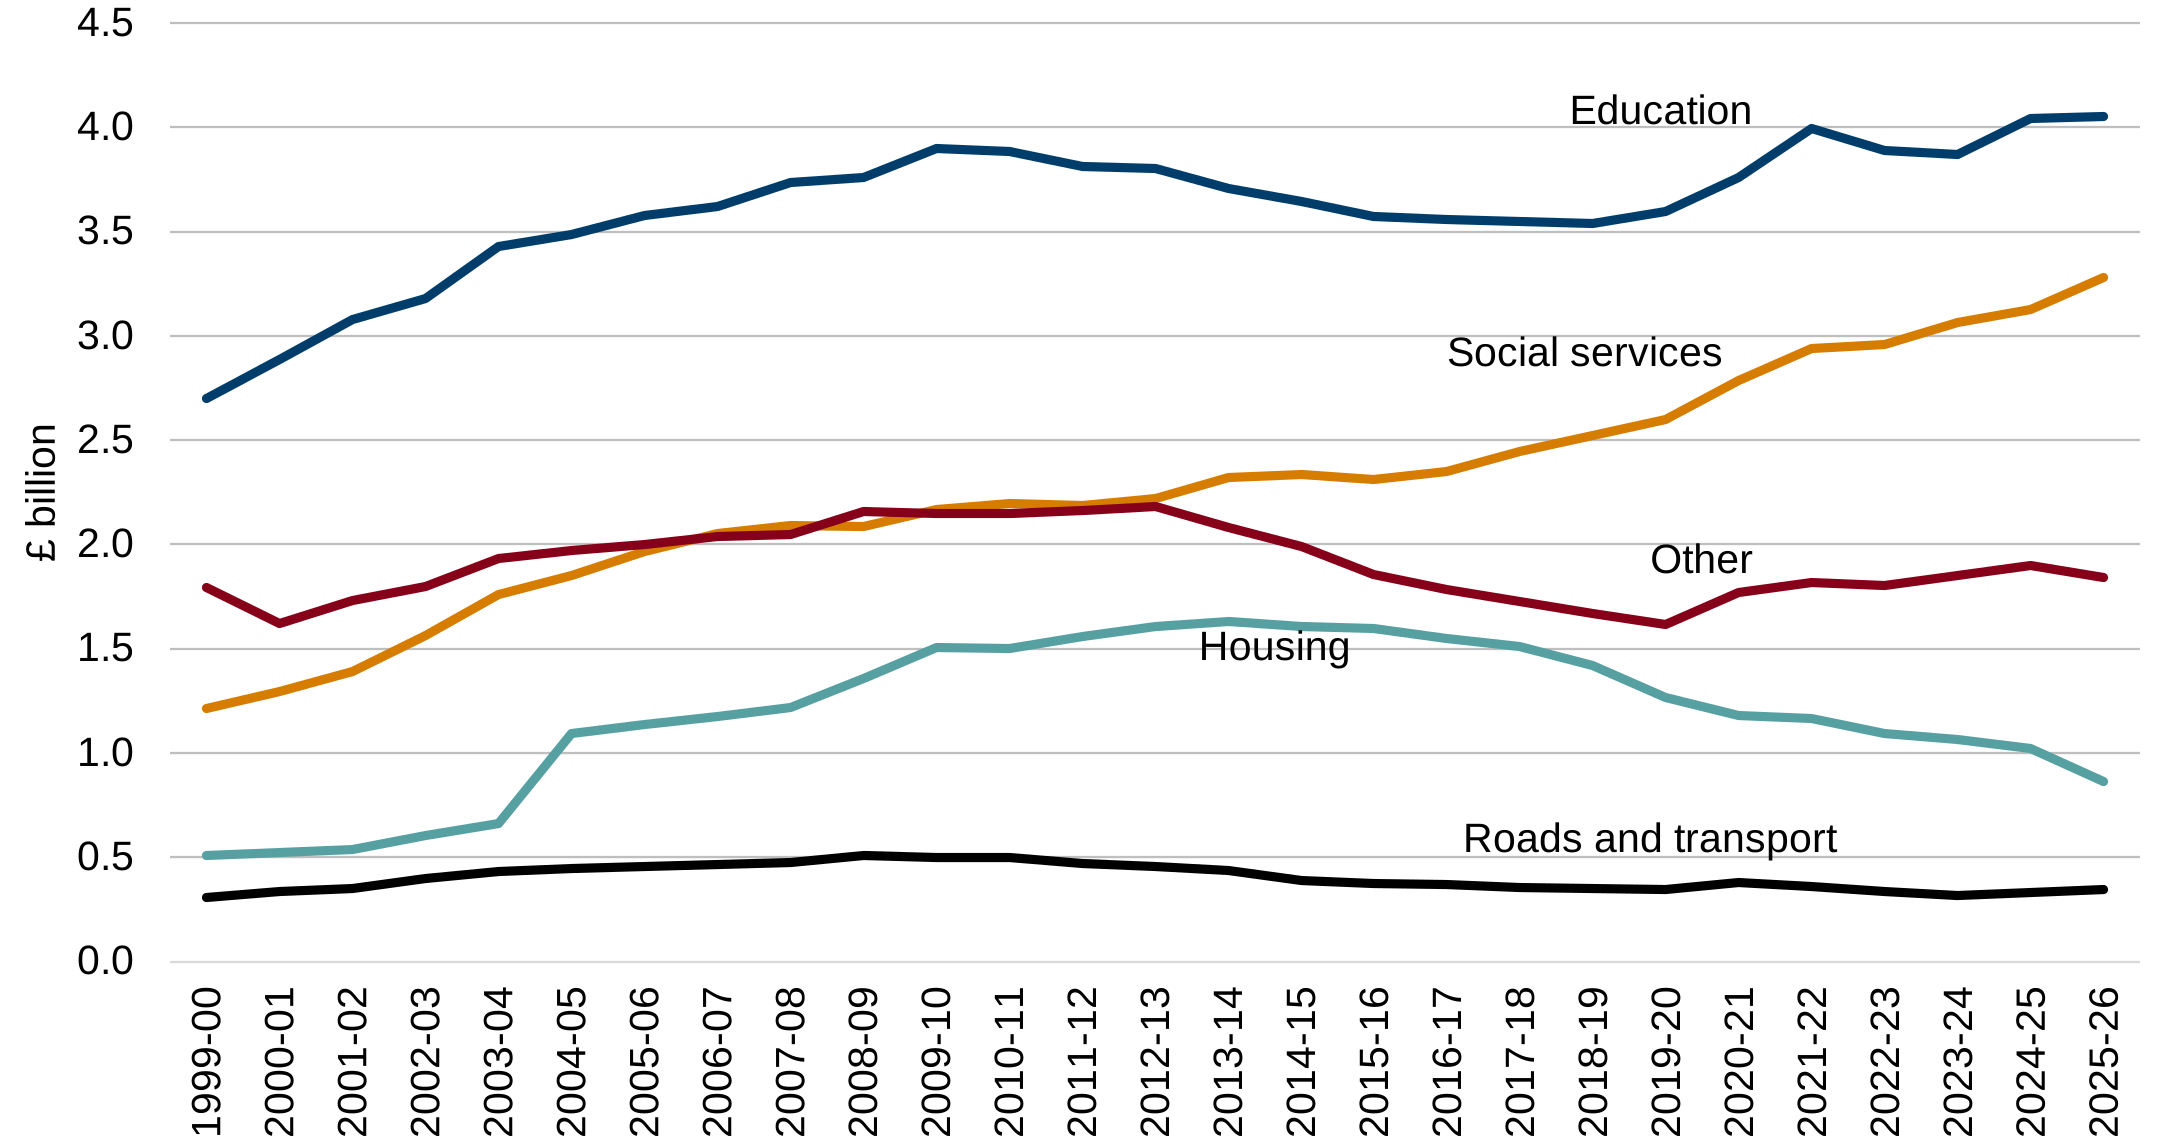
Description of figure 3: a line chart showing expenditure by service in real terms (adjusted for inflation) over time. Education and social services have seen the largest real terms increases over time.
Source: Welsh Government revenue outturn returns
More data on revenue outturn and capital outturn can be found in the associated data tables (MS Excel) and on the StatsWales website (Revenue) and StatsWales website (Capital).
Figure 4: service level revenue expenditure in Wales, 2025 and 2026
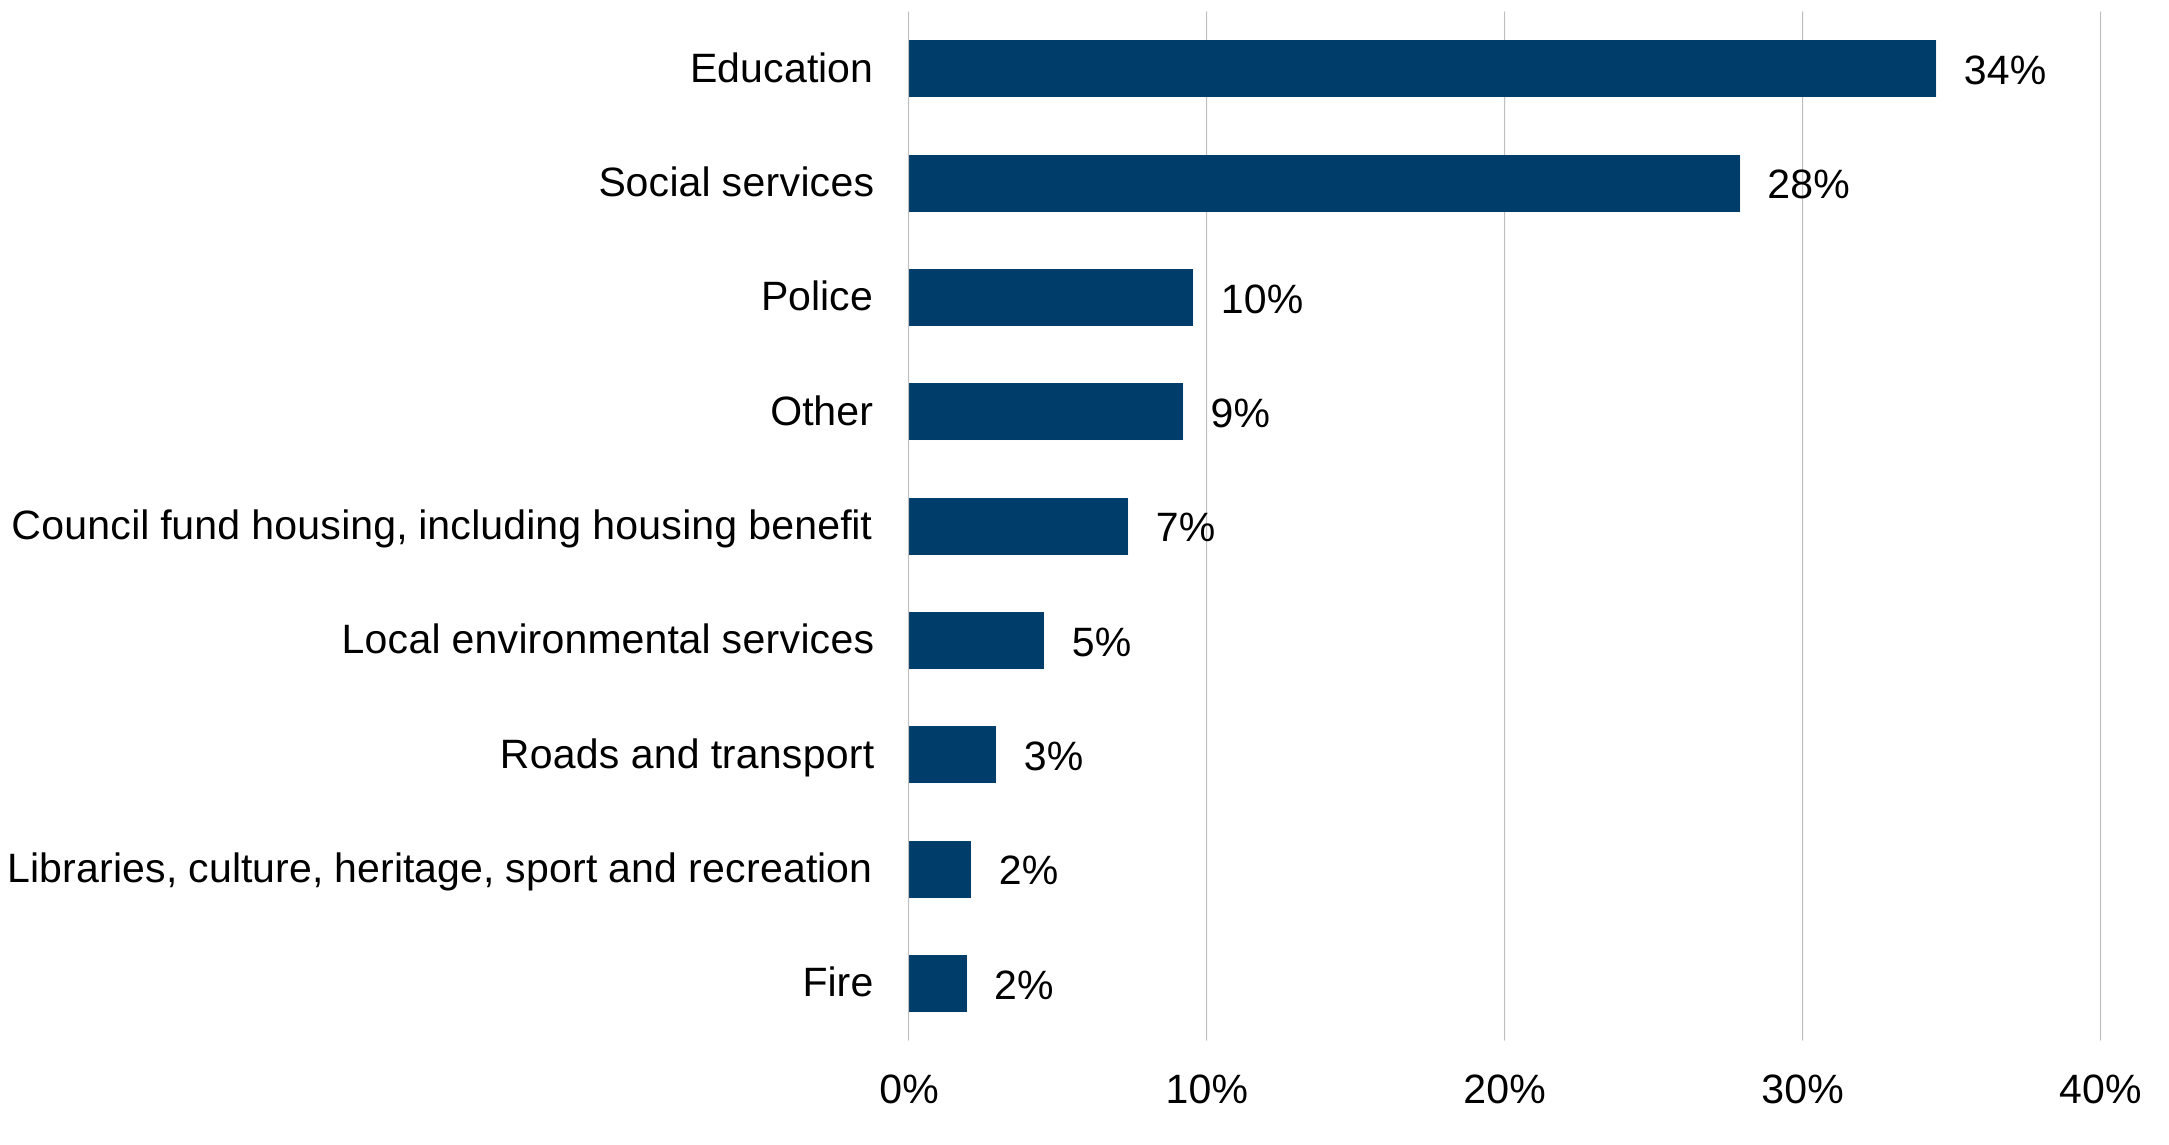
Description of figure 4: a bar chart showing revenue expenditure across services as a percentage of total expenditure in 2025 to 2026. Education and Social Services make up 62% of the total expenditure.
Source: Welsh Government revenue outturn returns
More data on revenue outturn and capital outturn can be found in the associated data tables (MS Excel) and on the StatsWales website (Revenue) and StatsWales website (Capital).
Figure 5: financing of budget requirement in Wales, 2025 and 2026
Description of figure 5: a bar chart showing financing of budget requirement. Revenue Support Grant provides 54% of the financing of budget requirement and council tax provides 30%.
Source: Welsh Government revenue outturn returns
More data on revenue outturn and capital outturn can be found in the associated data tables (MS Excel) and on the StatsWales website (Revenue) and StatsWales website (Capital).
Capital outturn
Figure 6: capital expenditure and receipts, between 1997 and 2026
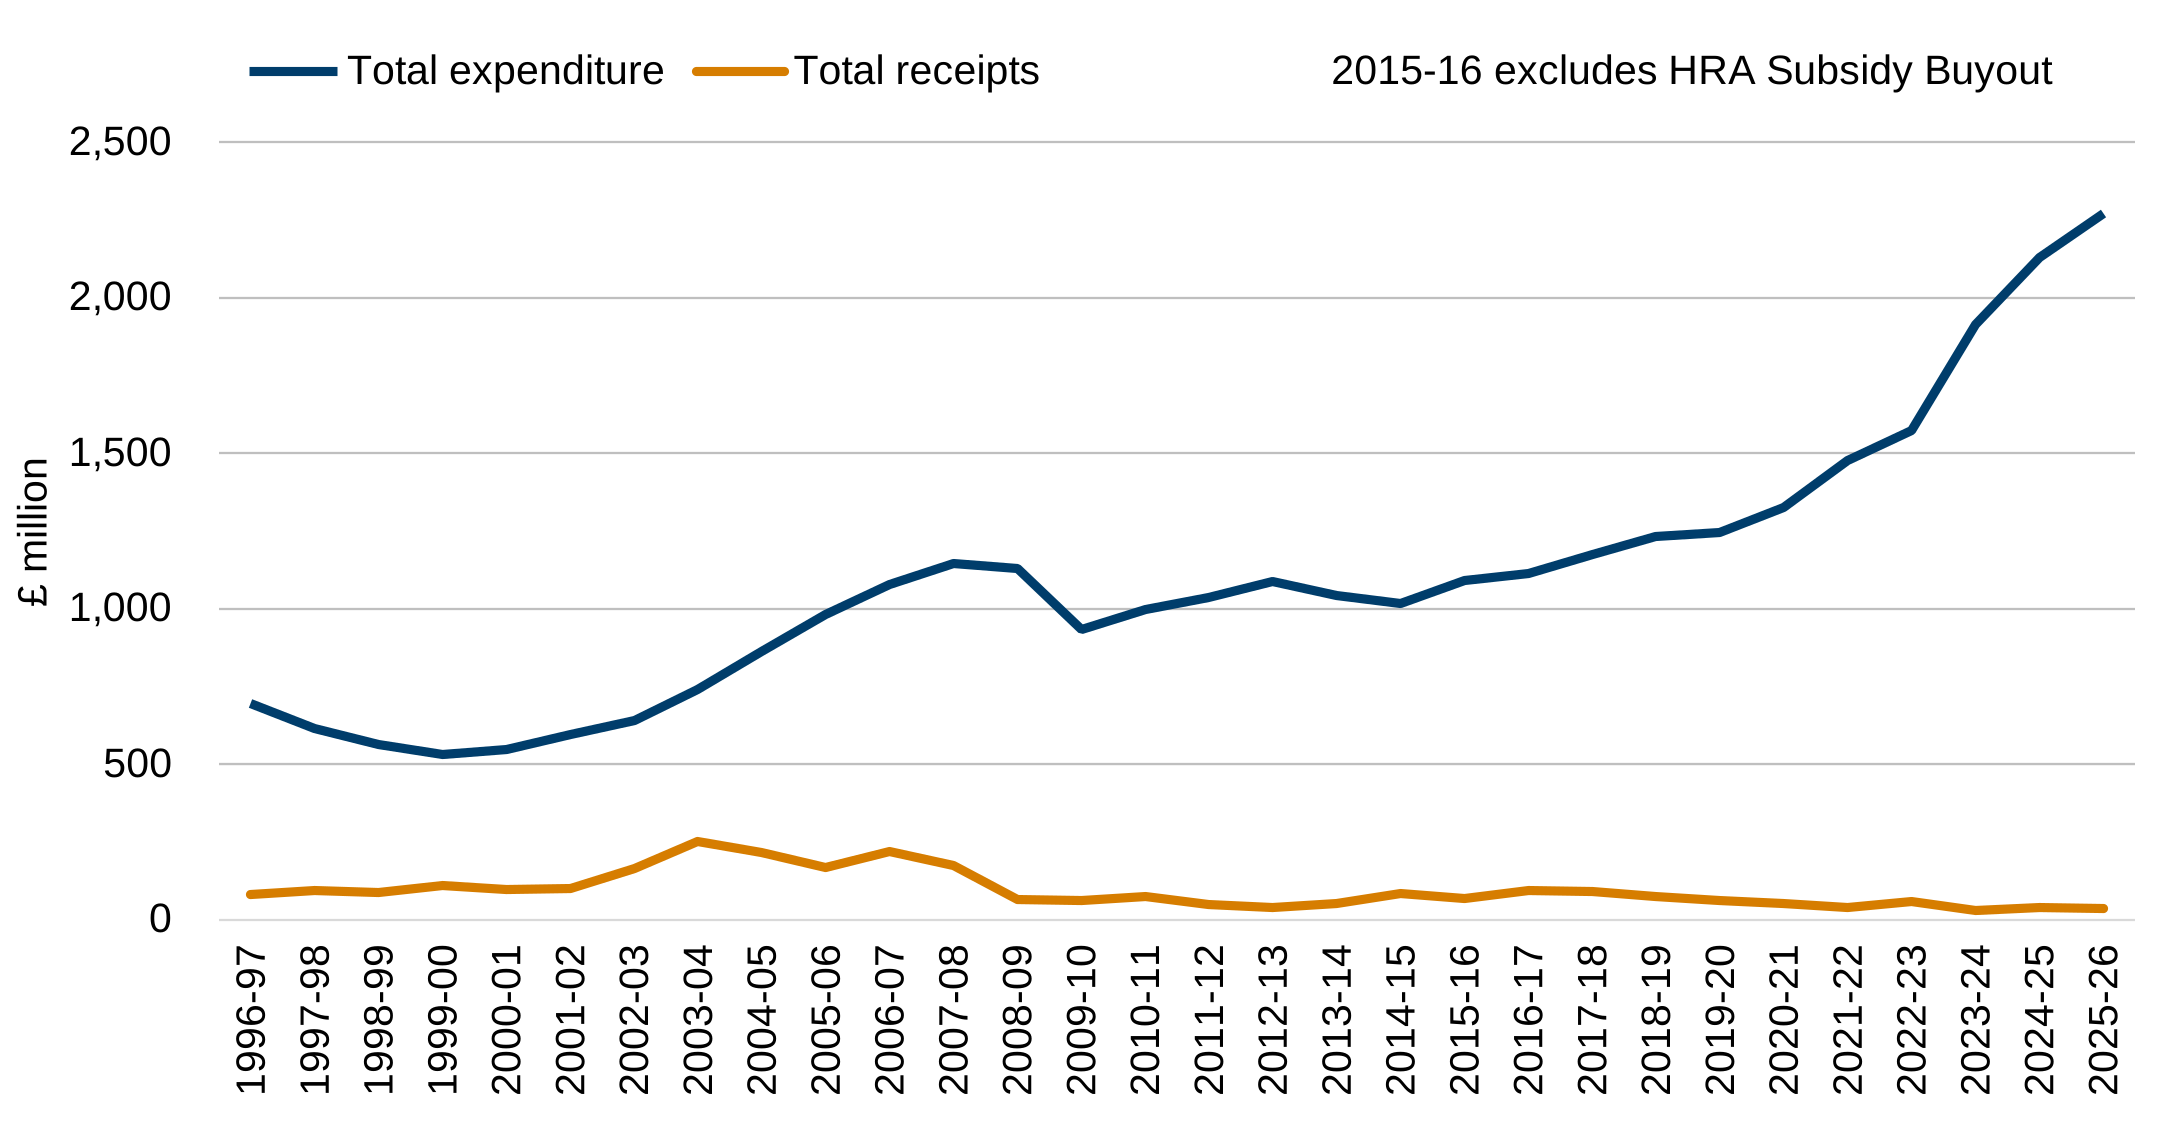
Description of figure 6: a line chart showing capital expenditure and receipts over time. Capital expenditure has increased each year from 2015 to 2016 onwards.
Source: Welsh Government capital outturn returns
More data on revenue outturn and capital outturn can be found in the associated data tables (MS Excel) and on the StatsWales website (Revenue) and StatsWales website (Capital).
Figure 7: capital expenditure by service, between 2022 and 2026
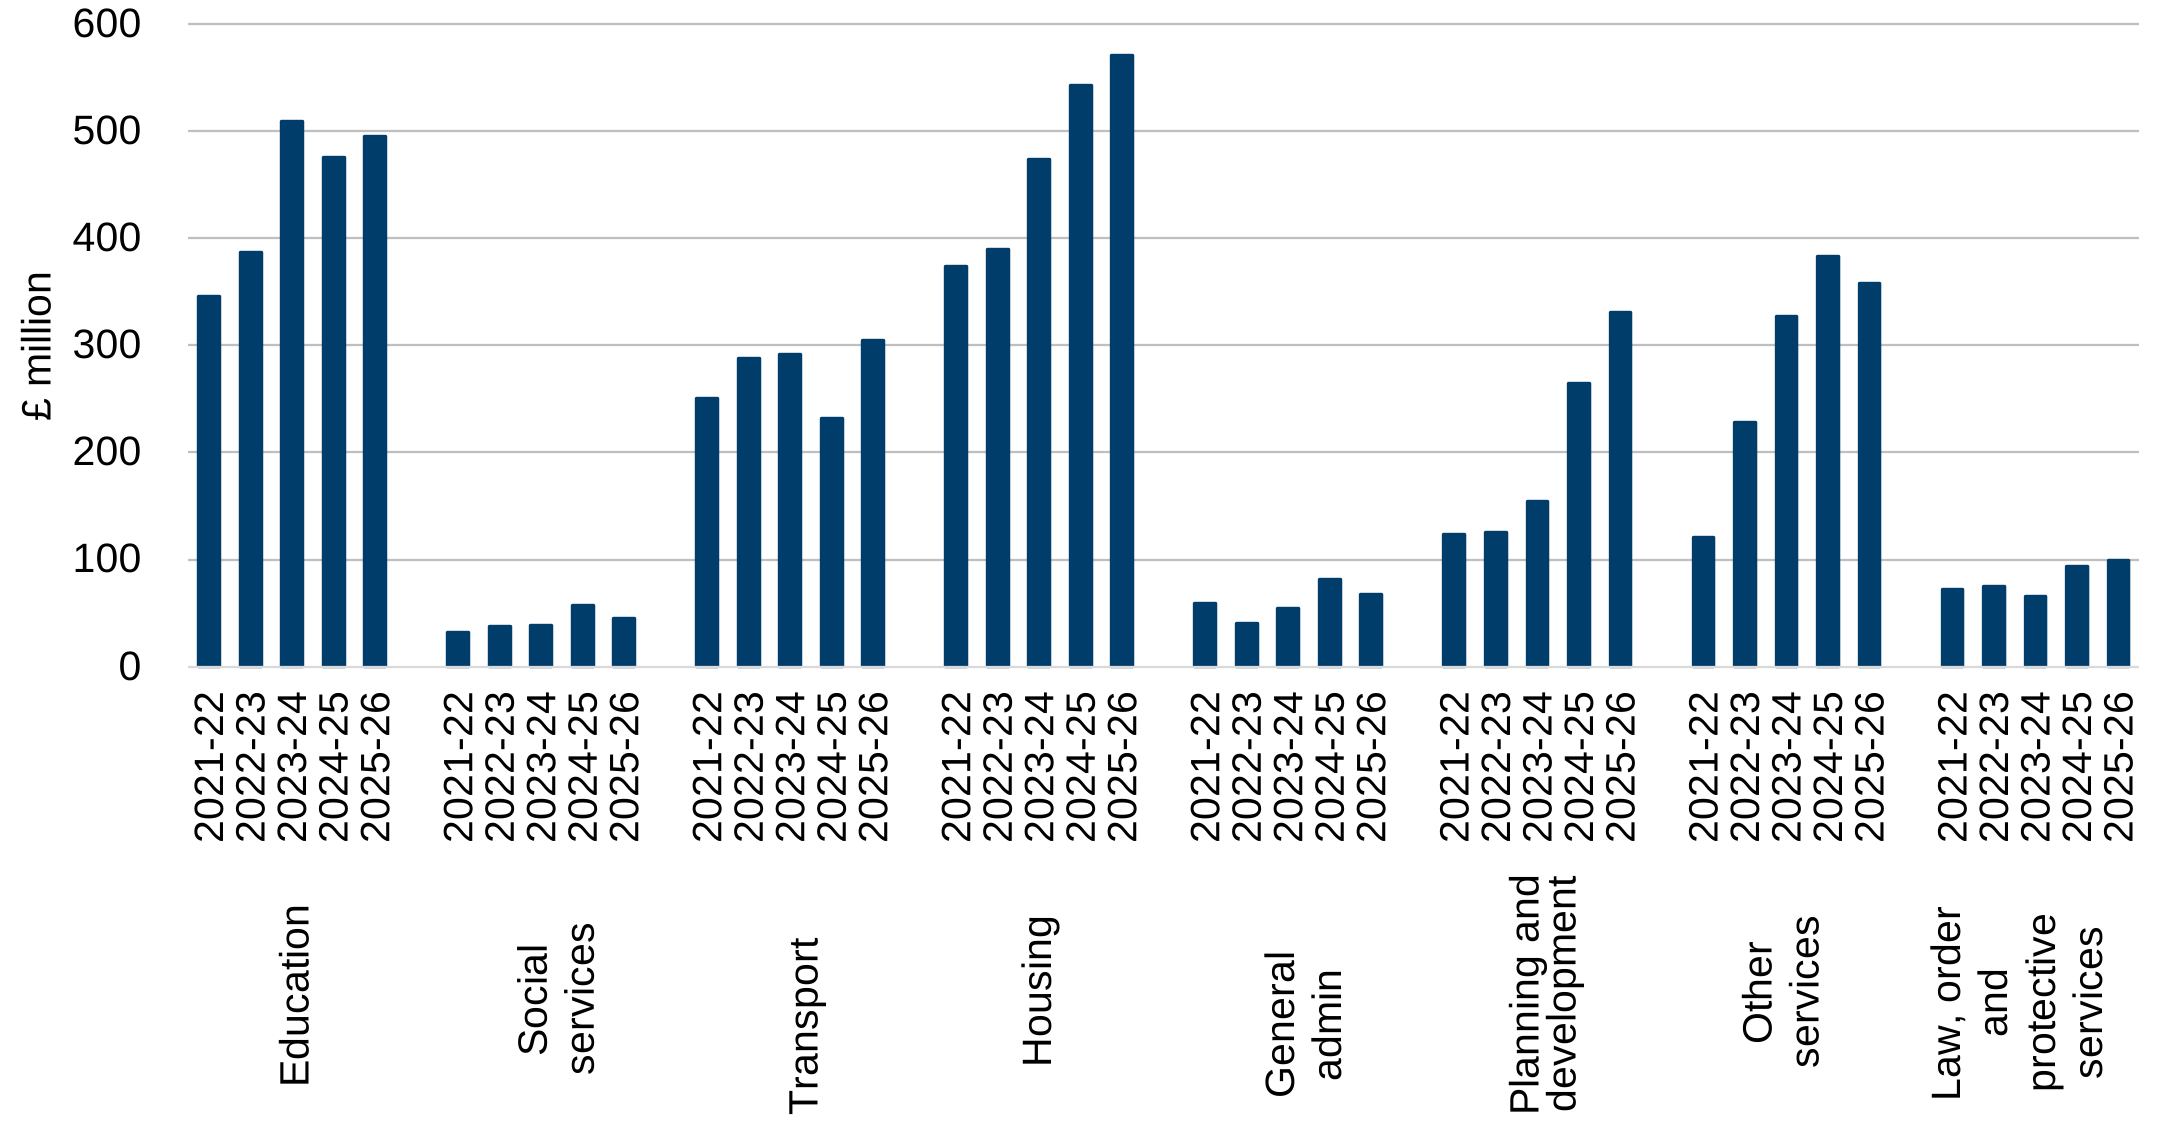
Description of figure 7: a bar chart showing capital expenditure over time by service. In 2025 to 2026, capital expenditure increased in transport and planning and development and decreased in social services.
Source: Welsh Government capital outturn returns
More data on revenue outturn and capital outturn can be found in the associated data tables (MS Excel) and on the StatsWales website (Revenue) and StatsWales website (Capital).
Figure 8: capital receipts by service, between 2022 and 2026
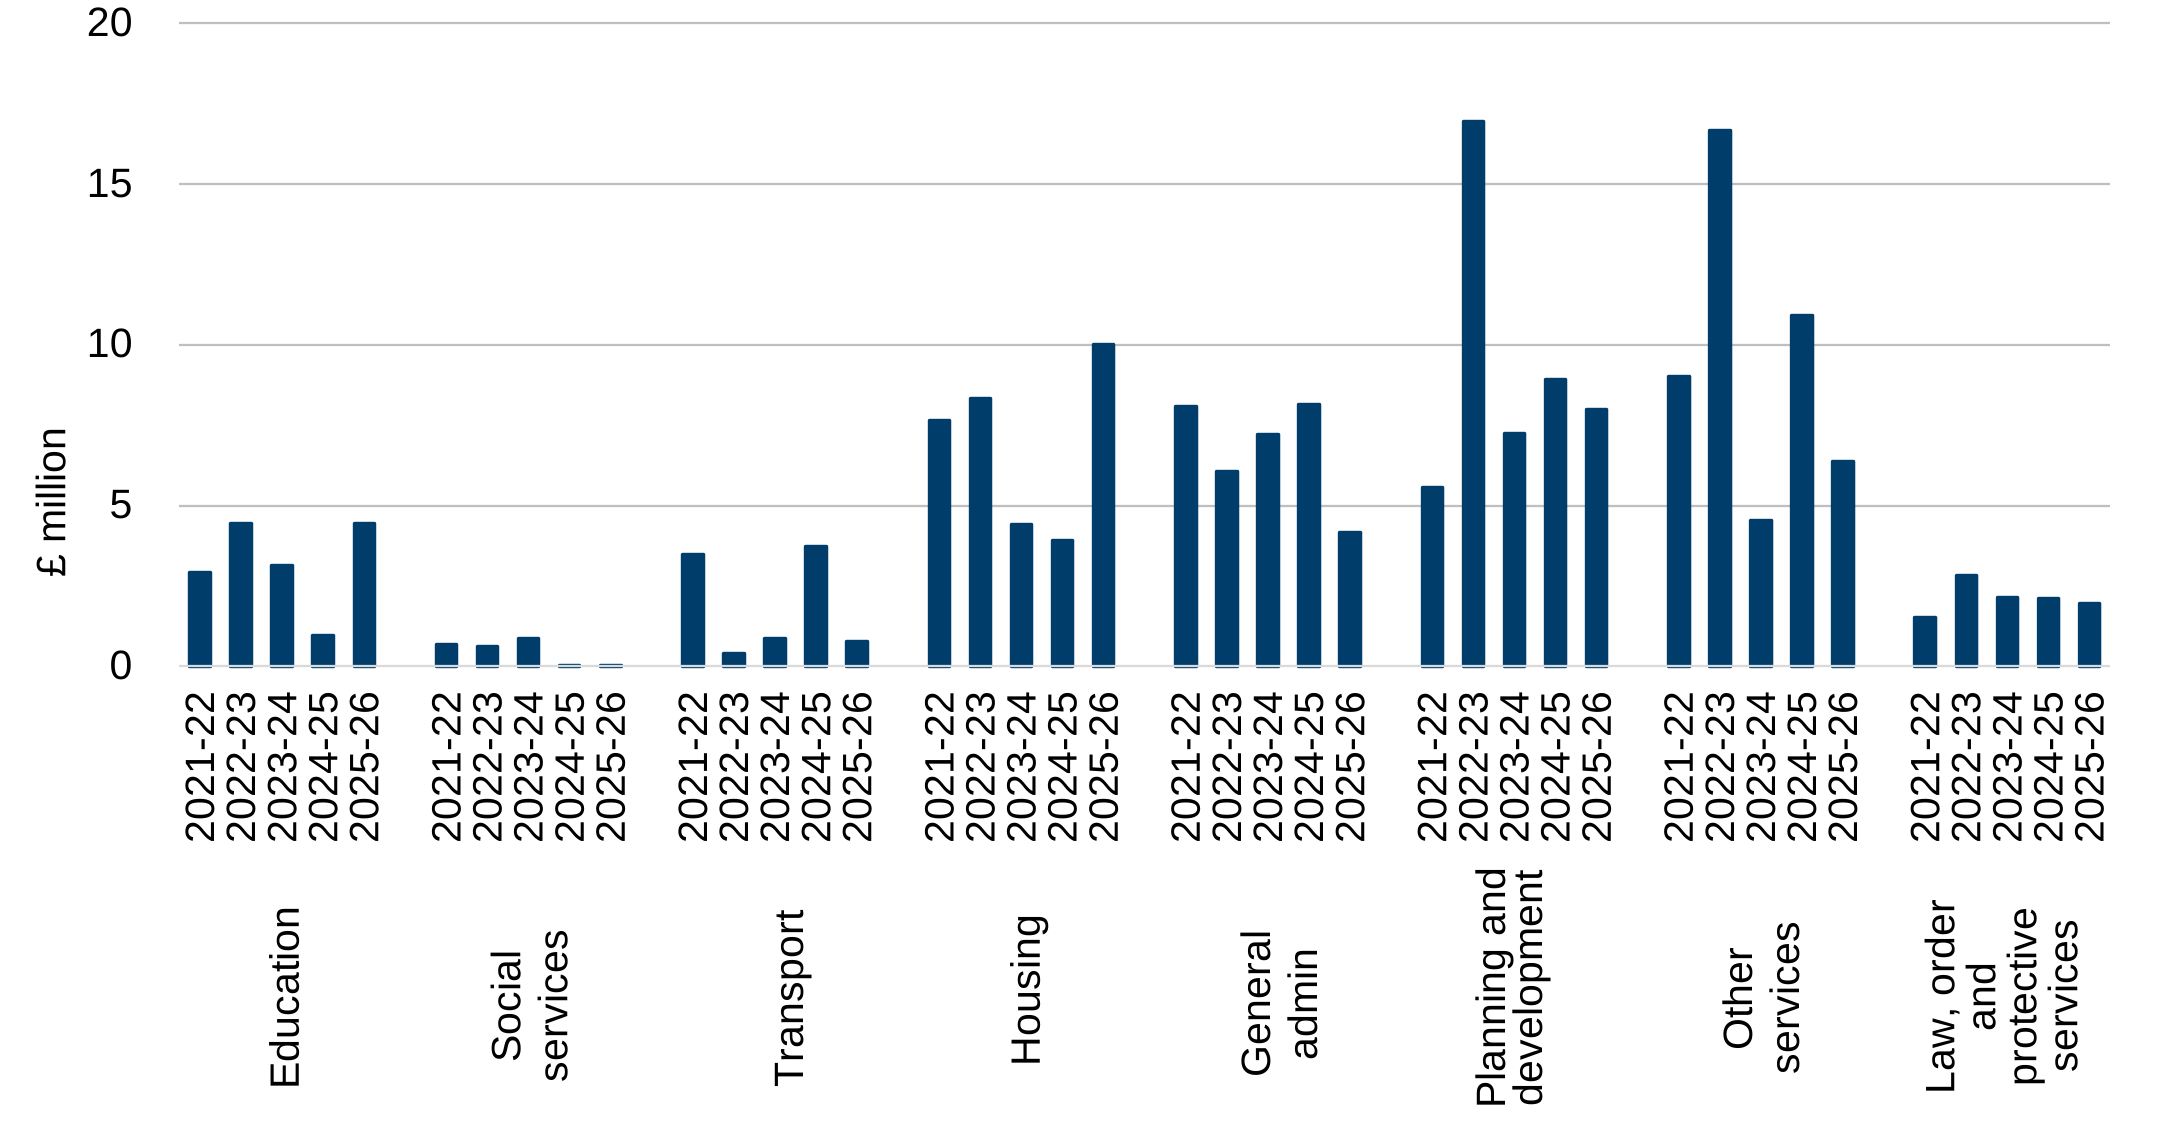
Description of figure 8: a bar chart showing capital receipts by service over time. The largest capital receipts were for housing at £10 million in 2025 to 2026.
Source: Welsh Government capital outturn returns
More data on revenue outturn and capital outturn can be found in the associated data tables (MS Excel) and on the StatsWales website (Revenue) and StatsWales website (Capital).
Figure 9: financing of capital expenditure, between 2021 and 2026
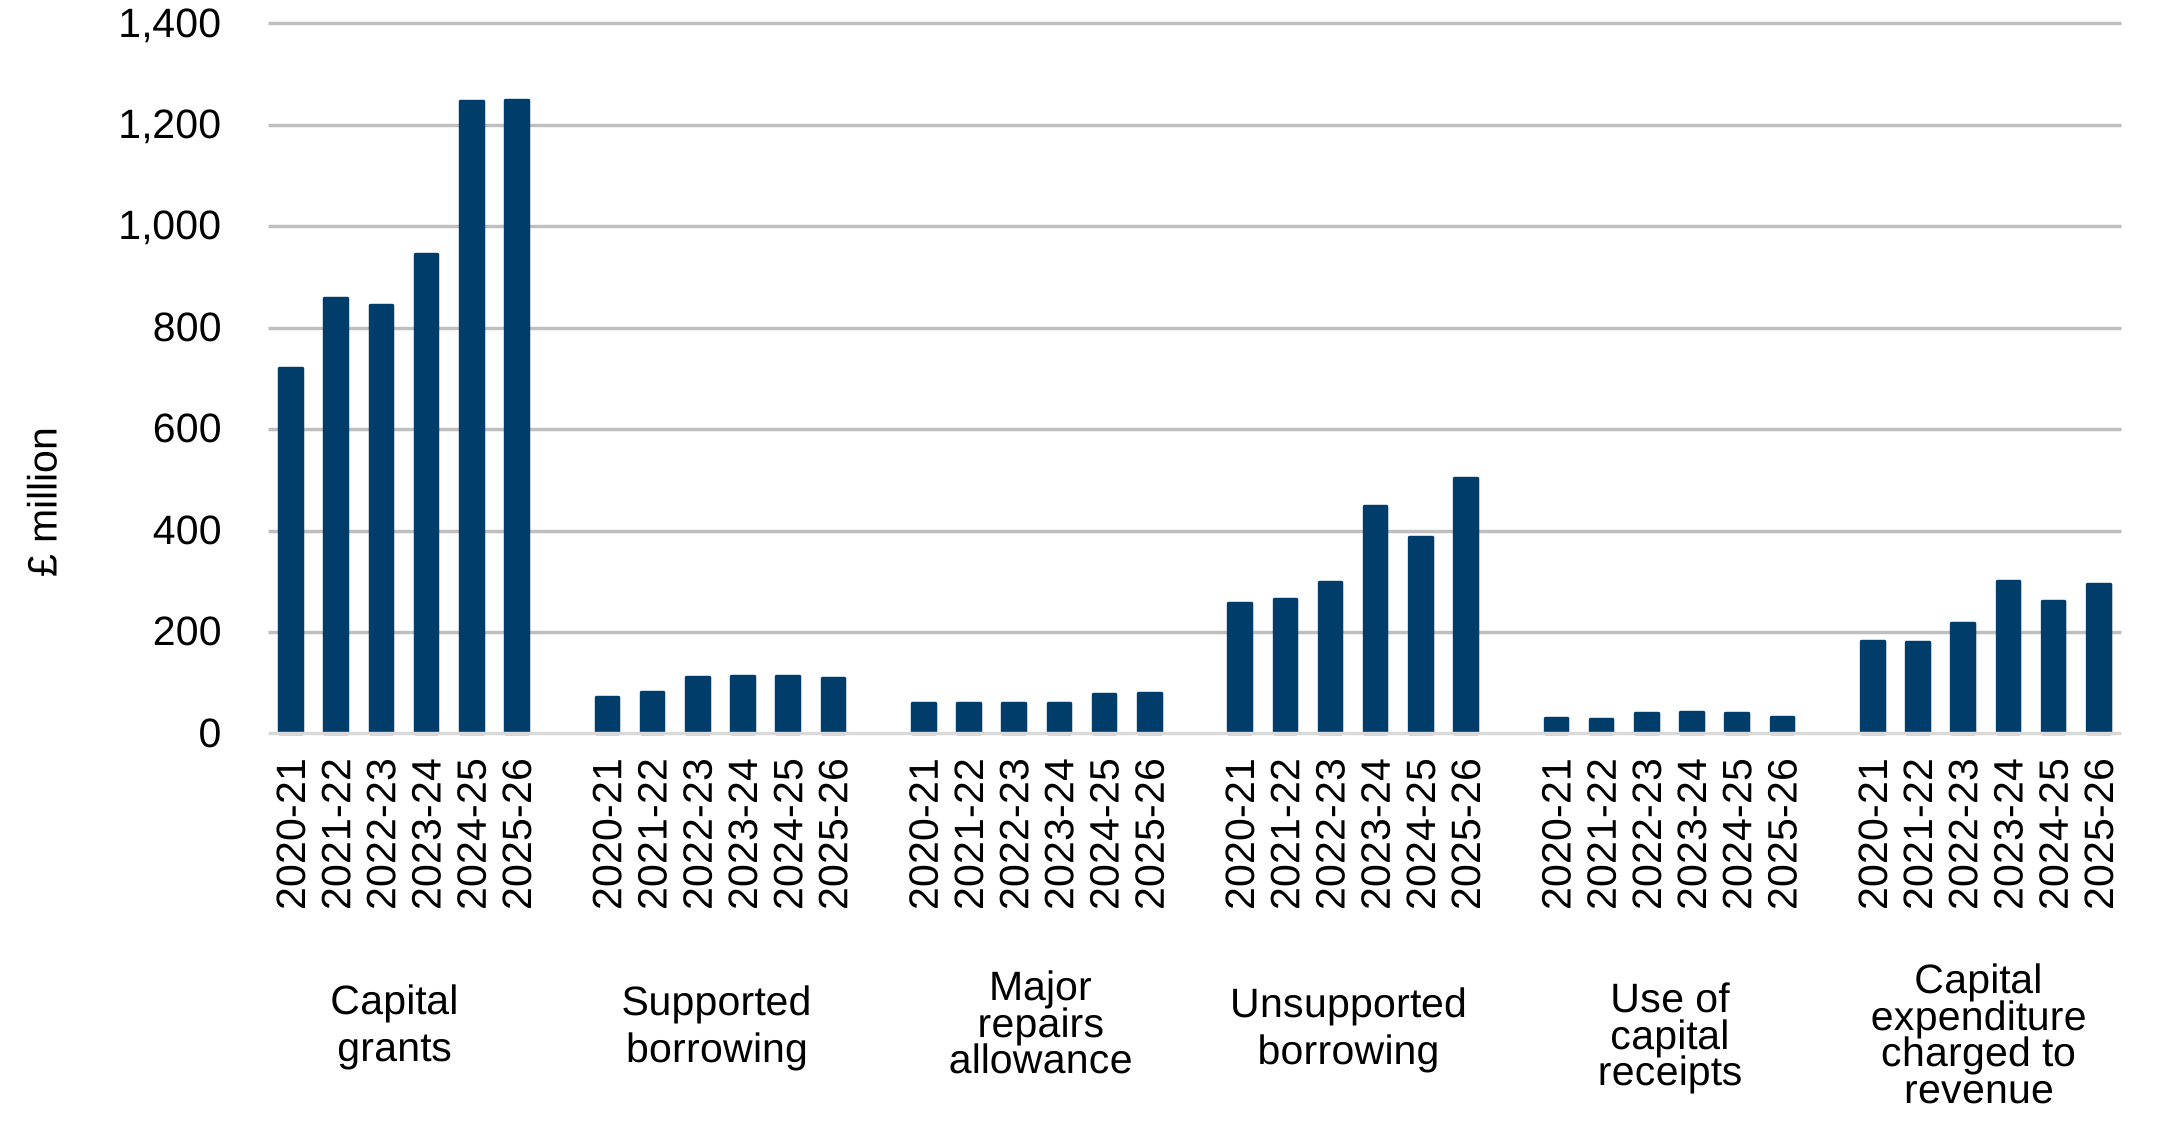
Description of figure 9: a bar chart showing the financing of capital expenditure over time. Capital grants financed £1,248 million (55%) of expenditure in 2025 to 2026.
Source: Welsh Government capital outturn returns
More data on revenue outturn and capital outturn can be found in the associated data tables (MS Excel) and on the StatsWales website (Revenue) and StatsWales website (Capital).
Glossary
Data sources
The main sources of information on revenue outturn and capital outturn in Wales are the revenue outturn (RO) and the capital outturn (COR) returns. Wales collect 100% of returns from all:
- 22 unitary authorities
- 4 police and crime commissioners
- 3 fire and rescue authorities
- 3 national park authorities
Background
Revenue expenditure is the cost of running local authority services such as staffing, heating, lighting and cleaning, together with expenditure on goods and services consumed within the year.
Capital spending is mainly buying, constructing or improving physical assets such as buildings, land and vehicles.
Revenue definitions
Gross revenue expenditure is total local authority expenditure on services, plus debt financing costs, but net of any income from sales, fees, and charges and other non-grant sources. It includes expenditure funded by specific and special government grants and expenditure funded from local authority reserves.
Net revenue expenditure is gross revenue expenditure excluding that funded by specific and special grants (except police grant).
Budget requirement is the amount of expenditure that is funded by council tax and general support from central government, i.e. revenue support grant, police grant, redistributed non-domestic rates, and any transitional grant relief for council tax. It differs from net revenue by the amount drawn from or added to reserves.
Fire authorities and national park authorities
These authorities fall within the general definition of local authorities. Fire authorities receive all their funding as a levy from the unitary authorities, whilst National Park authorities receive about 25% of their funding as a similar levy, and 75% in the form of specific grants from central government. The unitary authority figures in this release have been reduced by the amount of the levies to give the full picture for the expenditure of the fire and national park authorities.
Capital definitions
From 2004 to 2005 onwards
The prudential framework came into force on 1 April 2004. From that date basic and supplementary credit approvals were replaced by hypothecated supported borrowing (Borrowing and credit arrangements that attract central government support), general capital grant and specific grants such as Major Repairs Allowance. Under this framework, authorities are allowed to borrow for capital purposes without Government consent, provided they can afford to service the debt. This is known as prudential or unsupported borrowing. Expenditure and financing figures are on an accruals basis.
Quality and methodology information
Official statistics status
All official statistics should show the standards of the Code of Practice for Statistics (UK Statistics Authority).
These are accredited official statistics. They were independently reviewed by the Office for Statistics Regulation (OSR) in March 2019. They comply with the standards of trustworthiness, quality and value in the Code of Practice for Statistics.
It is Welsh Government’s responsibility to maintain compliance with the standards expected of accreditation. If we become concerned about whether these statistics are still meeting the appropriate standards, we will discuss any concerns with OSR promptly. Accreditation can be cancelled or suspended at any point when the highest standards are not maintained, and reinstated when standards are restored.
Accredited official statistics are called National Statistics in the Statistics and Registration Service Act 2007.
Statement of compliance with the Code of Practice for Statistics
Our statistical practice is regulated by the OSR. OSR sets the standards of trustworthiness, quality and value in the Code of Practice for Statistics that all producers of official statistics should adhere to.
All of our statistics are produced and published in accordance with a number of statements and protocols to enhance trustworthiness, quality and value. These are set out in the Welsh Government’s Statement of Compliance.
These accredited official statistics (OSR) demonstrate the standards expected around trustworthiness, quality and public value in the following ways.
You are welcome to contact us directly with any comments about how we meet these standards. Alternatively, you can contact OSR by emailing regulation@statistics.gov.uk or via the OSR website.
Trustworthiness
The main source of information on local authority revenue outturn and capital outturn are the revenue outturn (RO) and capital outturn (COR) returns.
We collect 100% of returns from all unitary authorities, police and crime commissioners, fire and rescue authorities and national park authorities. The collection is a 100% survey and as such no estimation of the figures is calculated, and hence there is no sampling error.
The data collection is carried out in July and August. The data is normally published in October, this allows time to collect, collate and validate the data.
In tables where figures have been rounded to the nearest final digit there may be an apparent discrepancy between the sum of the constituent items and the total as shown.
The statistics that are collected adhere to recognised professional standards. Specifically, the finance data is required under legislation and also must adhere to CIPFA accounting procedures. However, further guidelines are also available on the interpretation of these standards to ensure consistency.
Adhering to the professional code (CIPFA’s SeRCOP) has meant that changes over time have been minimal. Where there have been time series which are not comparable from the start of the time series to the end this will be shown clearly in the outputs. Where advance warning is known of future changes these will be pre-announced in accordance with Welsh Government arrangements.
The existence of a professional code and our adherence to it provides assurance that the data are consistent across domains, such as local authorities.
The Welsh local government finance statistics are published in an accessible, orderly, pre-announced manner on the Welsh Government website at 9:30am on the day of publication. All releases are available to download for free.
All outputs adhere to the Code of Practice by pre-announcing the data of publication through the upcoming calendar web pages.
Access to the data during processing is restricted to those involved in the production of the statistics, quality assurance and for operational purposes.
Pre-release recipient information can be found on the Welsh Government website.
Quality
The published figures are compiled by professional analysts using the latest available data and applying methods using their professional judgement and analytical skillset.
Statistics published by Welsh Government adhere to the Statistical Quality Management Strategy which supplements the Quality pillar of the Code of Practice for Statistics and the European Statistical System principles of quality for statistical outputs.
When data is received through the returns, validation checks are performed by Welsh Government statisticians and queries referred to local authorities where necessary. The statistical release is then drafted and quality assured by senior statisticians and published in line with the Code of Practice for Statistics (UK Statistics Authority).
The data collection contains multiple validation checks at source to ensure the best quality data is provided. This includes year-on-year tolerance checks and arithmetic consistency checks.
Once we receive the data, it goes through further validation and verification checks, for example:
- spend per head by local authority
- extra arithmetic consistency checks
- cross checks with other relevant data collections
- thorough tolerance checks
- outturn comparison with budgets
- cross checks with data from other government departments
- verification that data outside of tolerances are correct
More detailed guidance on the steps taken to ensure quality can be found in the Local government finance statistics: quality report.
Value
The statistics are important and have a number of uses, for example: advice to Ministers; local government finance revenue settlement calculations; unitary authority comparisons and benchmarking; expenditure in Wales compared to other countries; informing the debate in the Senedd and beyond; assisting in research in public expenditure issues; economic analysis.
More detailed data are also available at the same time on the StatsWales website (Revenue) and StatsWales website (Capital) and this can be filtered online or downloaded into spreadsheets.
Data on revenue outturn and capital outturn are also available for England (gov.uk) and Scotland (Scottish Government).
We aim to use plain English in our outputs and all outputs adhere to the Welsh Government accessibility policy.
Well-being of Future Generations Act (WFG)
The Well-being of Future Generations Act 2015 is about improving the social, economic, environmental and cultural wellbeing of Wales. The Act puts in place seven wellbeing goals for Wales. These are for a more equal, prosperous, resilient, healthier and globally responsible Wales, with cohesive communities and a vibrant culture and thriving Welsh language. Under section (10)(1) of the Act, the Welsh Ministers must (a) publish indicators (“national indicators”) that must be applied for the purpose of measuring progress towards the achievement of the wellbeing goals, and (b) lay a copy of the national indicators before Senedd Cymru. Under section 10(8) of the Well-being of Future Generations Act, where the Welsh Ministers revise the national indicators, they must as soon as reasonably practicable (a) publish the indicators as revised and (b) lay a copy of them before the Senedd. These national indicators were laid before the Senedd in 2021. The indicators laid on 14 December 2021 replace the set laid on 16 March 2016.
Information on the indicators, along with narratives for each of the wellbeing goals and associated technical information is available in the Wellbeing of Wales report.
Further information on the Well-being of Future Generations (Wales) Act 2015.
The statistics included in this release could also provide supporting narrative to the national indicators and be used by public services boards in relation to their local wellbeing assessments and local wellbeing plans.
Further details
A full detailed breakdown over time of the data contained in this release is available on our StatsWales website (Revenue) and StatsWales website (Capital).
Contact details
Local Government Finance Statistics
Email: stats.finance@gov.wales
Media: 0300 025 8099
SFR 80/2026