
Wellbeing of Wales 2026 - A more equal Wales
A summary of progress on improving our social, economic, environmental and cultural wellbeing.
In this page
A more equal Wales
A more equal Wales: A society that enables people to fulfil their potential no matter what their background or circumstances (including their socio-economic background and circumstances).
This chapter is organised by protected characteristic and brings together equality breakdowns for a selection of national indicators where these are available. However, some equality breakdowns are covered in other chapters and the extent and quality of available data varies by protected characteristic.
There is a national milestone to reduce the poverty gap between people in Wales with certain protected characteristics (which mean they are most likely to be in poverty) and those without those characteristics by 2035. Where data sources on income poverty and material deprivation are available by protected characteristics they have been included throughout this chapter.
Data on material deprivation, mental wellbeing and feelings of safety come from the National Survey for Wales. The sample size for financial year 2024 to 2025 (the latest available year of data) was smaller than in previous years and the composition of people in the sample was less representative of the population of Wales than in previous years. This may have an impact on the estimates for these indicators. See the National Survey for Wales quality report for more information.
There is no new National Survey for Wales data this year, so there are fewer areas where the data has been updated.
Progress towards the goal
There has been mixed progress towards achieving the goal. Some of the national indicators show improvement in recent years, in particular, the decreases in the employment gap for disabled people and the pay gap between women and men. However, some of the indicators show little sign of improvement or have deteriorated such as women reporting lower feelings of personal safety and high levels of income poverty in minority ethnic households.
There is a national milestone to eliminate the pay gap for gender, disability and ethnicity by 2050. The gender pay gap for full-time employees has generally been narrowing over the last 2 decades and stood at 1.9% in April 2025. Both the ethnicity and disability pay gap are highly volatile which means we are unable to determine whether there has been a significant change since 2015.
The gap between the employment rate for different groups has generally decreased over the last decade. Between financial years 2015 to 2016 and 2025 to 2026, the gap between the employment rate of disabled and non-disabled individuals has decreased by 4.9 percentage points. Whereas the gap between White individuals and those from a Black, Asian and Minority Ethnic background has decreased by 10.0 percentage points.
The percentage of people living in relative income poverty has been relatively stable over the last two decades with around 1 in 5 people living in relative income poverty. Children remain the age group most likely to be in poverty. Households with a disabled person or a Black, Asian or Minority Ethnic head of household are also more likely to be in poverty.
Self-reported mental wellbeing has decreased from 50.9 in financial year 2016 to 2017 to 48.4 in 2024 to 2025. Older people, non-disabled people and people from a Black, Asian and Minority Ethnic background generally have higher self-reported mental wellbeing.
Between financial years 2016 to 2017 and 2024 to 2025 the percentage of men and women reporting feeling safe at home, walking in the local area and travelling have remained broadly the same at just over 80% for men and around 55% for women.
Sex
The indicators show differences in education, employment, deprivation and wellbeing between men and women. Whilst women achieve better educational outcomes, this does not carry through to employment rates and pay.
This chapter uses a range of data sources on sex. Each data source will have an approach to collecting data on sex or gender that is aligned to its user needs, which means there will be limited consistency between the definitions of sex and gender across the sources. The later section on gender identity includes data on those whose gender identity differs from their sex registered at birth.
Girls continue to achieve better educational outcomes at GCSE. In academic year 2024 to 2025 girls scored 365.7 points on average in the GCSE Capped 9 indicator (interim measure version) compared to 343.7 points for boys. This gap of 21.9 points has narrowed from 22.2 points in 2023 to 2024, and 32.9 points in 2018 to 2019.
In terms of the working age population, an estimated 7.7% of men held no qualifications in 2025 compared with 6.6% of women, and women were more likely to hold qualifications at or above level 4.
Employment rates for people aged 16 to 64 in Wales were lower for women than for men (69.8% and 74.5% respectively in financial year 2025 to 2026). This relates to the higher economic inactivity rates (excluding students) for women (24.2%) than men (18.5%) over this period. This difference is to some extent driven by caring responsibilities (looking after family/home) which represents a higher proportion of women who were economically inactive than men. The employment rate gap narrowed in 2025 to 2026 compared to the previous year and has notably narrowed in the last two decades.
Figure 4.1: employment rate (percentage of population aged 16 to 64) by sex and year, between financial years 2005 to 2006 and 2025 to 2026
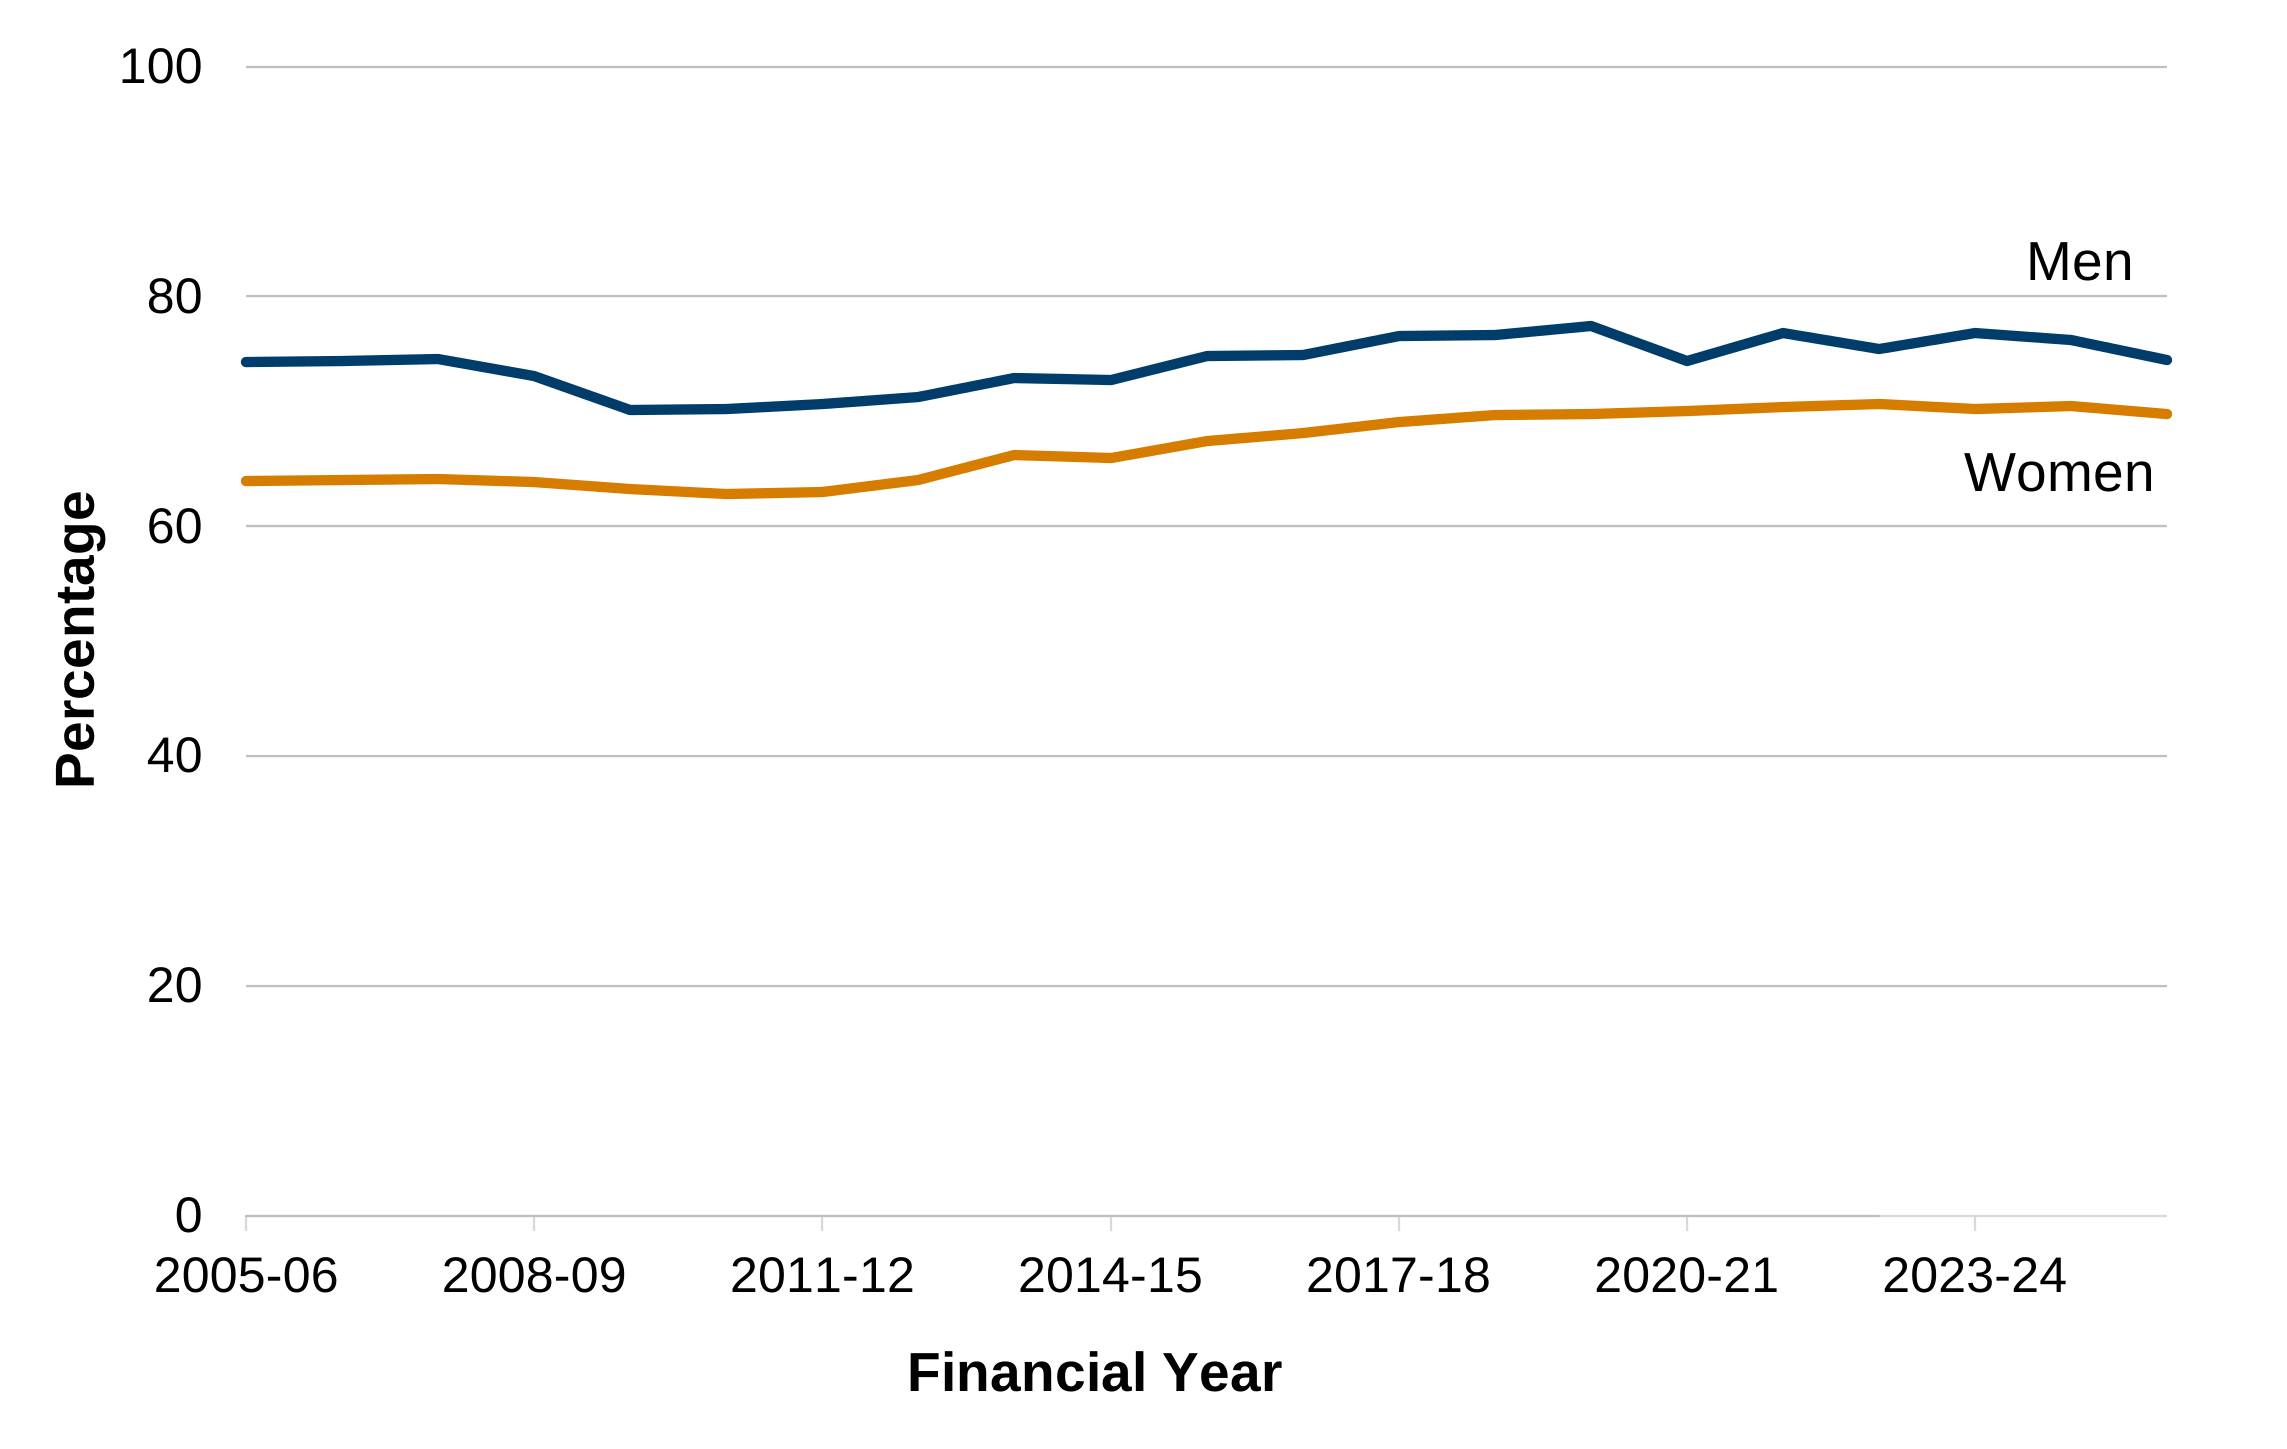
Description of figure 4.1: a line chart showing employment rates for those aged between 16 and 64 by sex between financial years 2005 to 2006 and 2025 to 2026. The employment rate gap narrowed in 2025 to 2026 compared to the previous year, as the employment rate for men decreased to 74.5%, and the employment rate for women decreased slightly to 69.8%.
Source: Welsh Government analysis of the Annual Population Survey, Office for National Statistics
The gender pay gap for full-time employees in Wales, based on median hourly earnings (excluding overtime), stood at 1.9% in April 2025. This is broadly similar to the previous year. Wales had the second smallest (full-time employees) gender pay gap of the 12 UK countries and regions.
For part-time employees in Wales, women were paid 3.1% more than men on average (a decrease of 0.3 percentage points compared to the previous year).
When considering both full-time and part-time employees, the gender pay gap remains considerably higher at 9.7% in April 2025, an increase of 0.7 percentage points compared to the previous year. This is higher than full-time employees and part-time employees separately, because women fill more part-time jobs, which in comparison with full-time jobs have lower hourly median pay.
For full-time and part-time employees combined, the gender pay gap increases with age. In April 2025, women aged 18 to 21 earned 0.8% less than men, compared to women aged 60 and over who earned 12.3% less than men.
Figure 4.2: percentage difference in median hourly full-time earnings between men and women, 1999 to 2025 [Note 1]
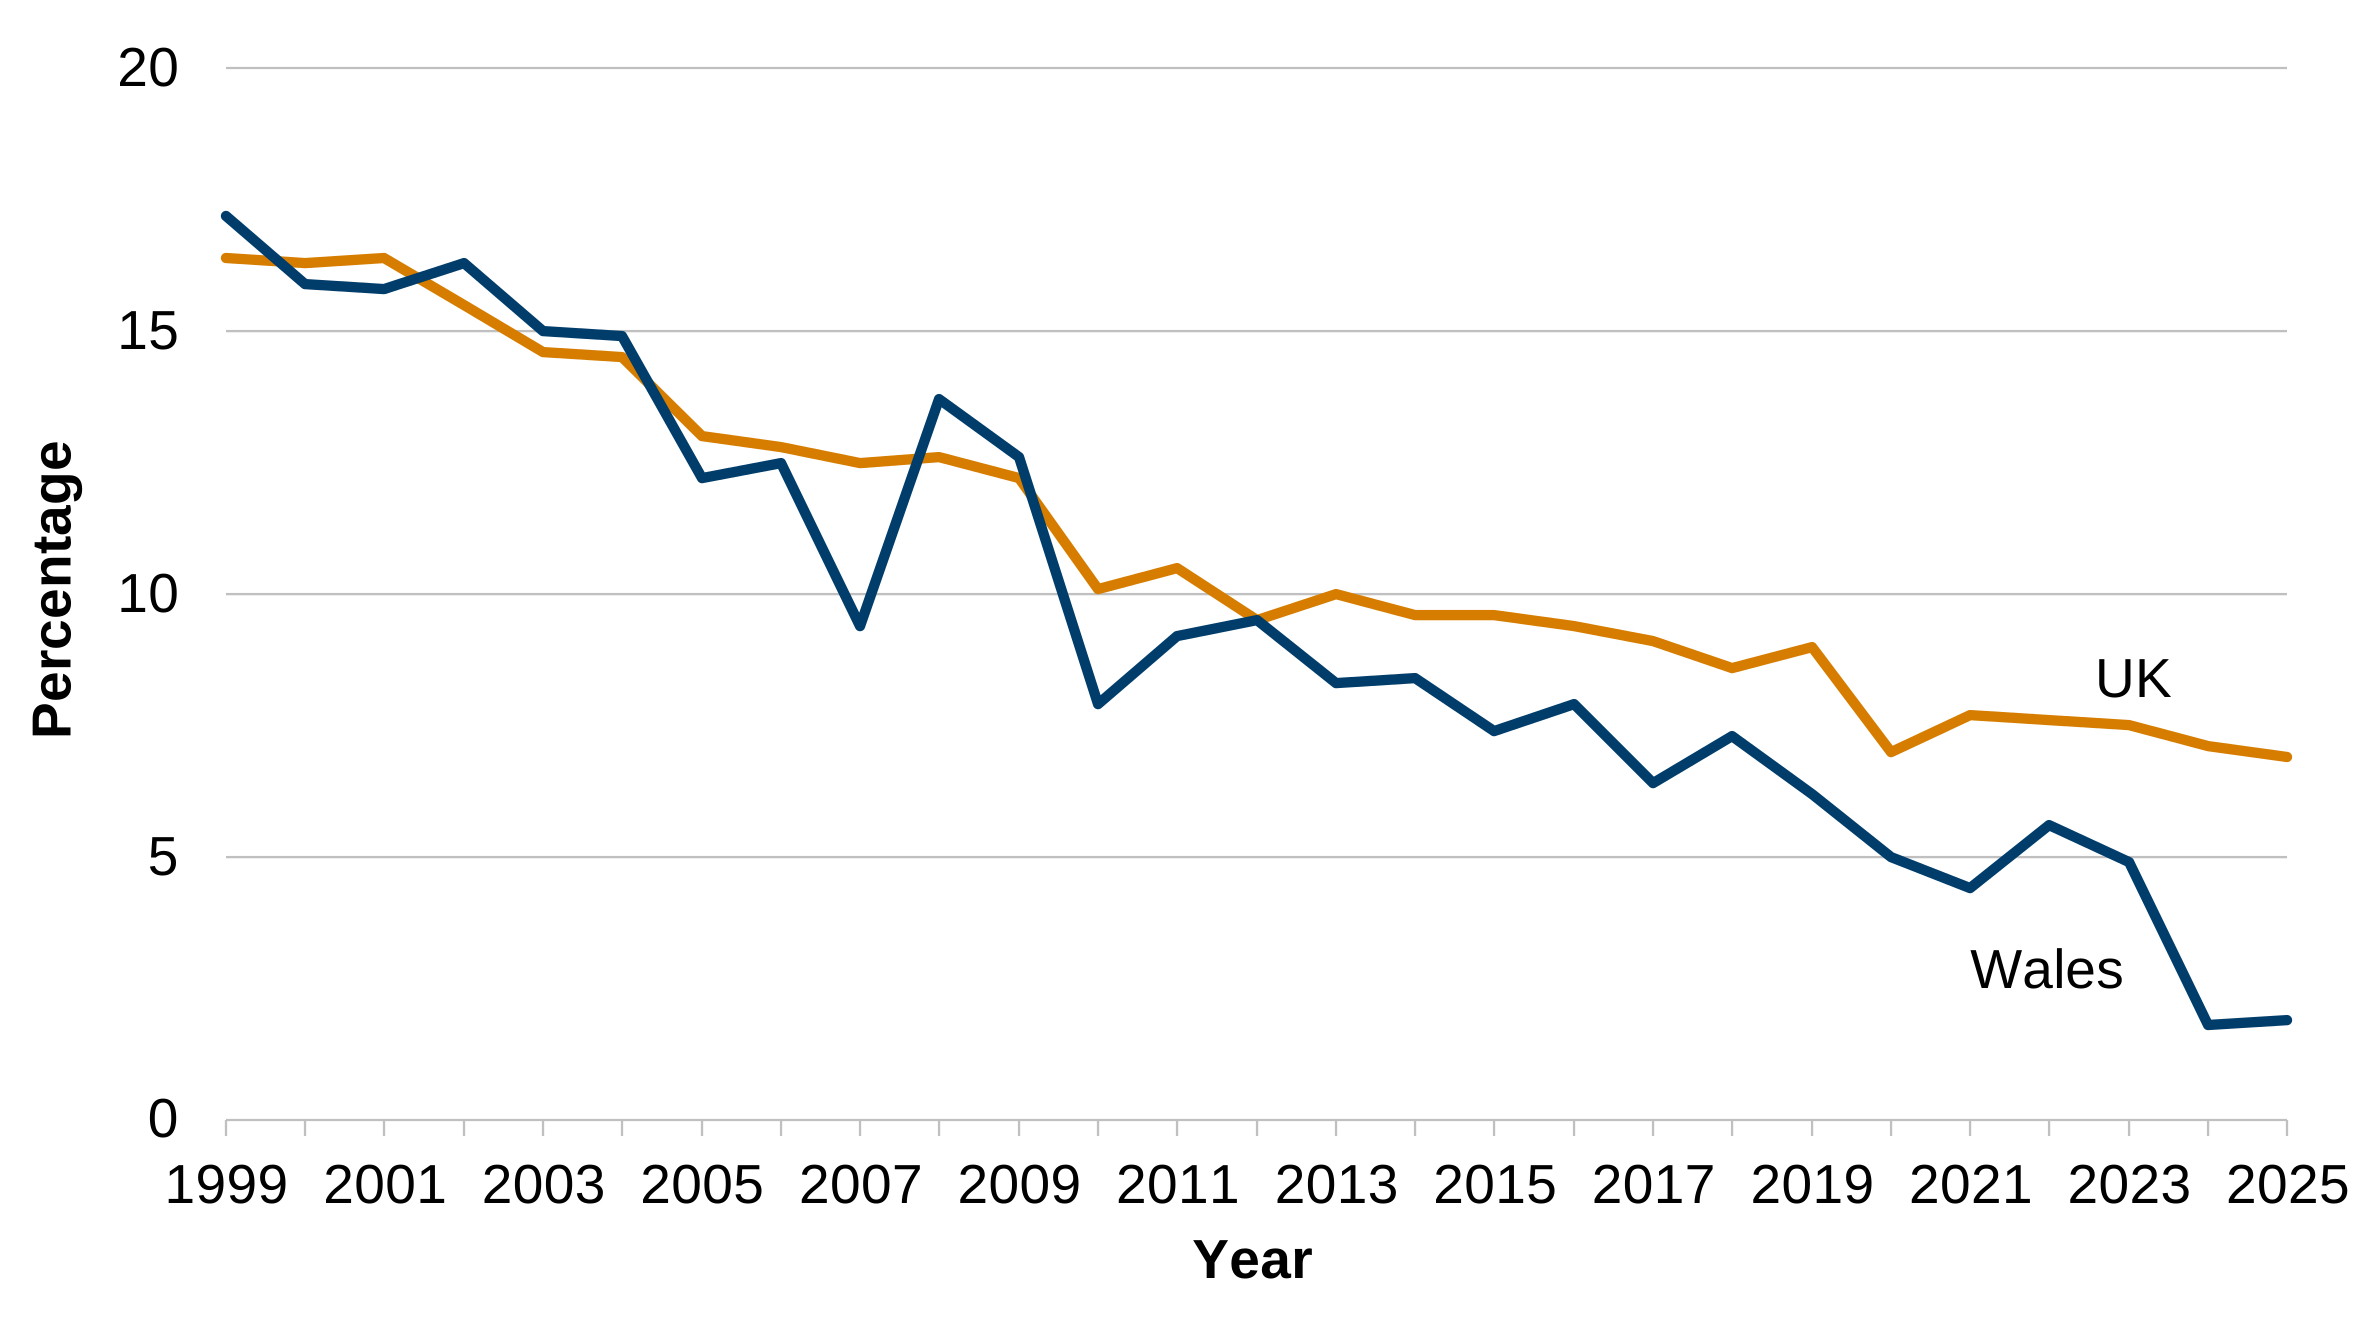
Description of figure 4.2: a line chart showing that the difference in median hourly full-time earnings between men and women has generally decreased over the last 20 years for both Wales and the UK. Wales has had a narrower gender pay gap than the UK since 2013.
[Note 1] A pay difference greater than zero means men’s earnings are higher than women’s.
Source: Welsh Government Analysis of the Annual Survey of Hours and Earnings, Office for National Statistics
A national indicator on the proportion of employees whose pay is set by collective bargaining was introduced in December 2021, based on data from the Annual Survey of Hours and Earnings (ASHE). In 2025, the proportion of women with pay set by collective bargaining (59.6%) was higher than men (46.0%).
The national indicator on fair work and earnings considers the percentage of people in employment, who are on permanent contracts (or on temporary contracts, and not seeking permanent employment) and who earn at least the real living wage. The real living wage is calculated by the Living Wage Foundation who determine the methodology. It aims to reflect the cost of living. In 2025, the proportion of women earning at least the real living wage (61.1%) was much lower than for men (70.4%). This largely reflects the fact that women are more likely to work part-time than men, and part-time jobs tend to be lower paid than full-time jobs.
Material deprivation is a measure of living standards, and a person is defined to be living in material deprivation if they are not able to access a certain number of goods and services. Data on material deprivation is sourced from the National Survey for Wales.
In financial year 2024 to 2025, 11% of adults were living in households in material deprivation. Similar proportions of women and men were classed as materially deprived (12% and 11% respectively). In previous survey years women were consistently more likely to be classed as materially deprived. The National Survey for Wales sample was smaller in 2024 to 2025 than in previous years and included fewer people from low-income areas. This may have impacted on the estimates for material deprivation.
In financial year 2024 to 2025, self-reported mental wellbeing (as measured by the Warwick Edinburgh Mental Well-Being Scale for adults) was slightly higher for men than women, with men having a mean score of 49.0 and women having a mean score of 47.8. Self-reported levels of loneliness were similar for men and women in the latest available data (2022 to 2023).
In financial year 2024 to 2025, women were less likely to report feeling safe at home, in their local area and travelling (56%) compared to men (82%).
Age
The indicators show differences in wellbeing and deprivation across different age groups. Children are more likely to be in poverty and older people have higher mental well-being.
Self-reported wellbeing tends to be higher in older age groups with loneliness also being lower in older adults. In financial year 2024 to 2025, self-reported mental wellbeing (as measured by the Warwick Edinburgh Mental Well-Being Scale for adults) was 47.5 for those aged 16 to 44 compared to 49.7 for those aged 65 and over.
People living in relative income poverty are those who live in a household where the total household income from all sources is less than 60% of the average UK household income (as given by the median).
The latest data published is for the three-year period between financial years 2022 to 2023 and 2024 to 2025.
Improvements have been made to relative income poverty statistics from the three-year period from financial year ending 2021 to 2023, due to the introduction of integrated administrative data on benefits not used previously. Data from this period onwards are not comparable with previous years. More improvements are planned for the next few years, and relative income poverty statistics are now classed as Official Statistics in Development rather than Accredited Official Statistics.
The latest data shows that 22% of all people in Wales were living in relative income poverty. This proportion has been relatively stable in Wales for the last two decades. Children are the consistently the population group most likely to be in relative income poverty. The most recent figures show that 32% of children in Wales were in relative poverty compared to 21% of working-age adults and 11% of pensioners. Since the early 2000s a higher proportion of the working-age population has been in relative income poverty than pensioners.
Figure 4.3: percentage of each age group in Wales living in relative income poverty, by three-financial-year averages, 1997-99 to 2023-25 [Note 1] [Note 2]
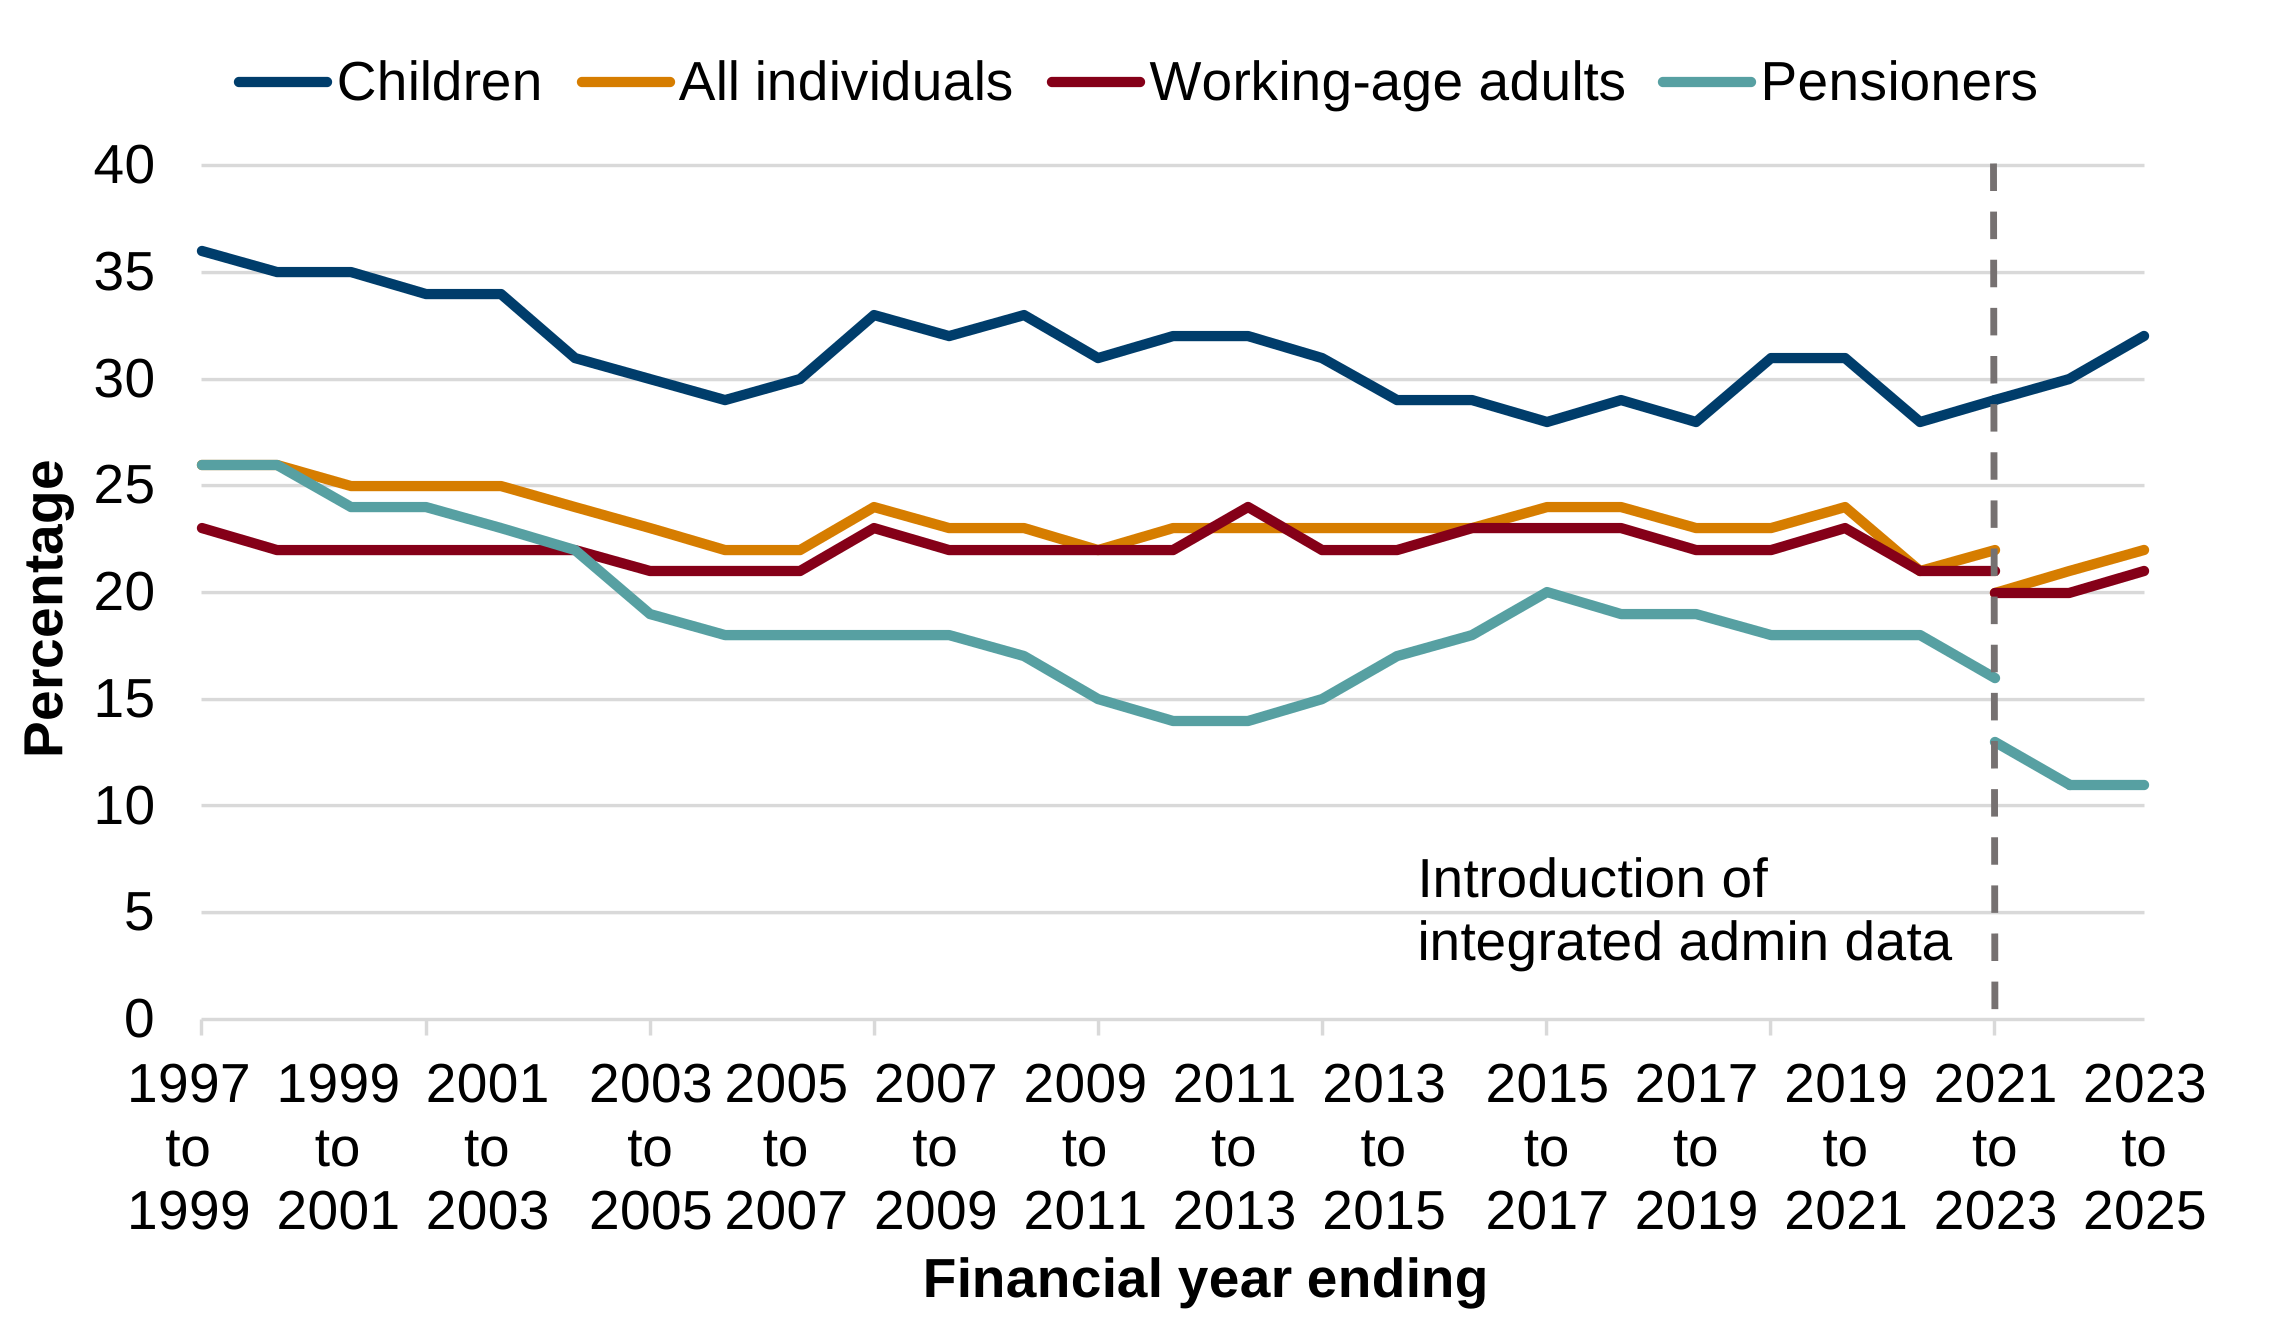
Description of figure 4.3: a line chart showing people in Wales living in relative income poverty (after housing costs were paid) from 1997 onwards. Children are consistently the age group most likely to be in relative income poverty and pensioners are the age group least likely to be in relative income poverty.
[Note 1] Data from the period which spans financial years ending 2021 to 2023 are not comparable with previous periods due to the introduction of integrated administrative data on benefits not used previously. More information is provided in the latest relative income poverty statistical release and a link to this is provided in the Further Reading section at the end of this chapter.
[Note 2] Estimates for periods which span 2020 to 2021 do not include the data collected during 2020 to 2021 in calculations. 2020 to 2021 estimates are unreliable as they are based on data collected during the first year of the coronavirus (COVID-19) pandemic, when lockdown rules severely disrupted the data collection.
Source: Welsh Government analysis of the Households Below Average Income (HBAI) data set
When looking at the proportion of the adult population living in material deprivation in 2024 to 2025, those aged 25 to 44 were most likely to live in material deprivation (16%) and those aged 65 to 74 were least likely (5%).
Figure 4.4: material deprivation by age group and year, between financial years 2016 to 2017 and 2024 to 2025 [Note 1]
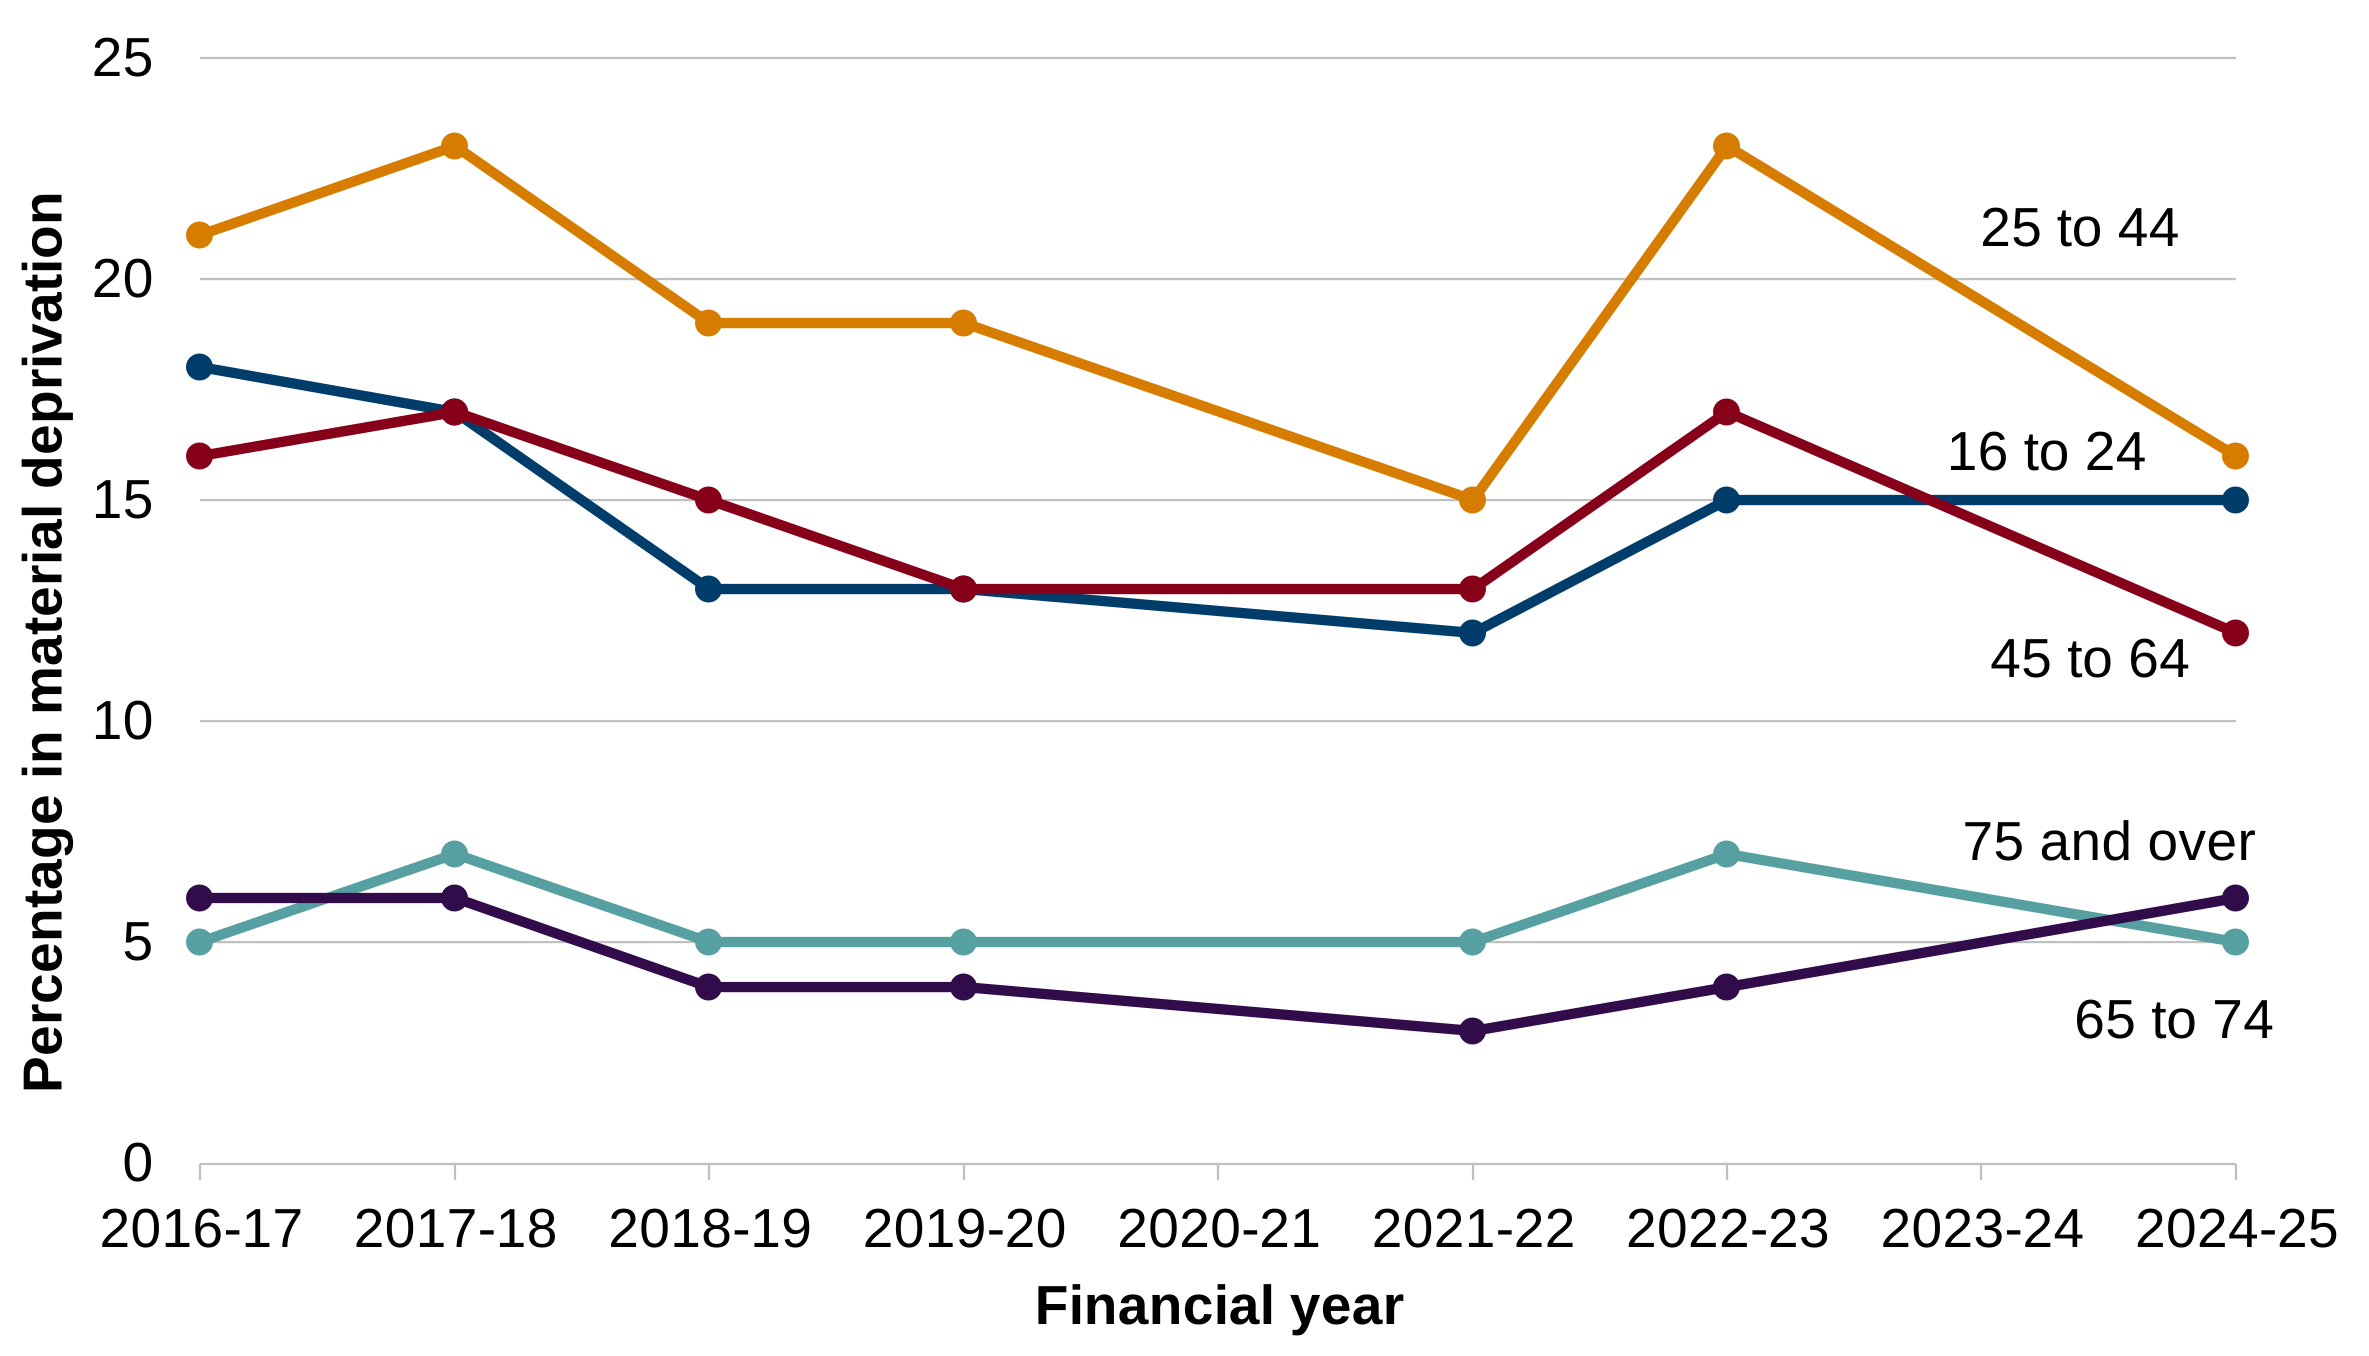
Description of figure 4.4: a line chart showing the percentage of different age groups in material deprivation between financial years 2016 to 2017 and 2024 to 2025. Material deprivation has been highest for the 25 to 44 age group and lowest for the 65 to 74 and 75 and over age groups over this time period. Due to uncertainty in the estimates the changes within age groups are generally not significant, however the differences between age groups are.
[Note 1] The years 2020 to 2021 and 2023 to 2024 have no data.
Source: National Survey for Wales, Welsh Government
Ethnicity
In June 2022 the previous Welsh Government published its Anti-Racist Wales Action Plan (ARWAP) which includes guidance on anti-racist language. This section and chapter uses a range of data sources with different categorisations of ethnic group. In general, we reflect the language of the source data collection which may not align with the ARWAP guidance. However, we have used anti-racist language in this chapter where possible.
The indicators show differences in education, employment, poverty and wellbeing across ethnic groups. In general, people from Black, Asian and Minority Ethnic backgrounds had more positive education outcomes. However, this trend does not continue into outcomes relating to employment, pay and poverty.
GCSE results for academic year 2024 to 2025 show that Black, Asian and Minority Ethnic pupils scored 384.9 on average in the GCSE Capped 9 indicator (interim measure version) compared to 362.3 for White British pupils. This is a gap of 22.6 points, up from 19.9 points in 2023 to 2024, and up from the gap of 17.0 points in 2018 to 2019.
Figure 4.5: GCSE capped 9 indicator (interim measure version) by ethnic group, academic year 2024 to 2025
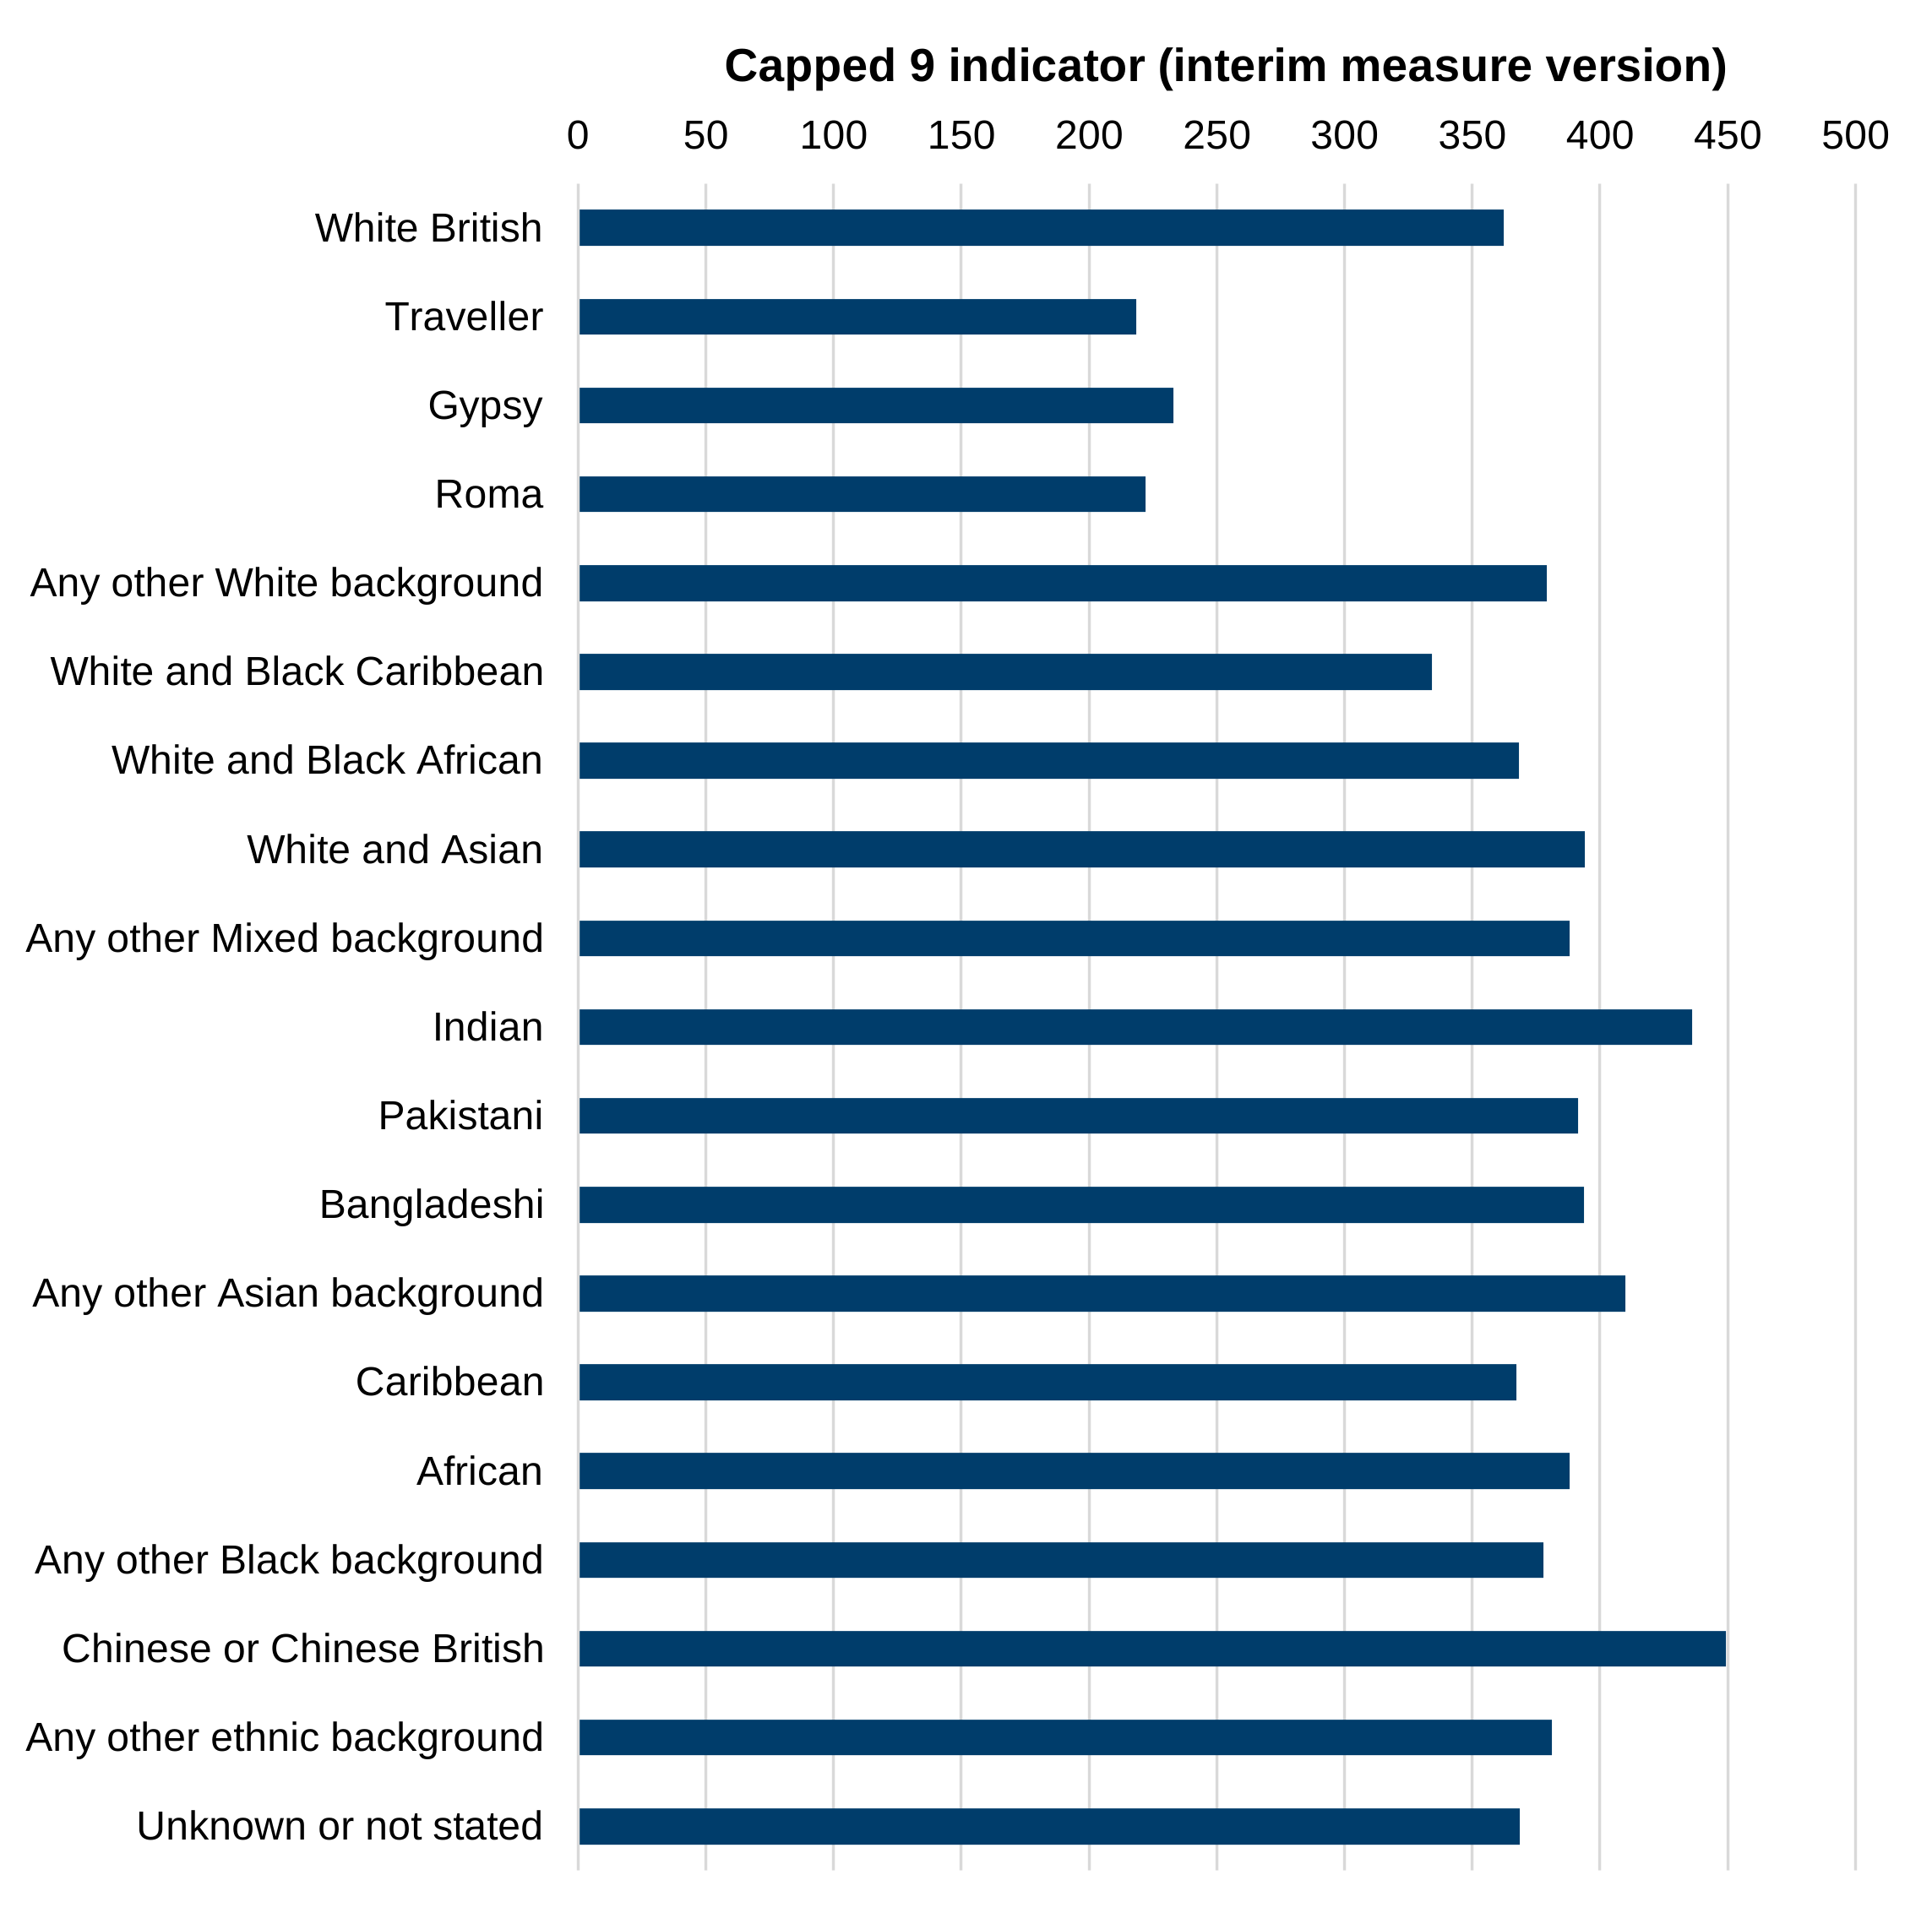
Description of figure 4.5: a bar chart showing the GCSE capped 9 indicator (interim measure version) by ethnic group in the 2024 to 2025 academic year. Those who identify as Gypsy, Traveller and Roma are the only ethnic groups below 250 points, other ethnic groups range from 330 points to 450 points.
Source: Examination Results, Welsh Government
In 2025, 69.0% of working age adults from a Black, Asian and Minority Ethnic background (excluding those from a Gypsy, Traveller or Roma background) held qualifications at levels 4 and above, compared to 46.6% of White working age adults (including those from a Gypsy, Irish Traveller or Roma background). Black, Asian and Minority Ethnic working age adults were also less likely to hold no qualifications (4.6%) than White working age adults (7.6%).
Employment rates in financial year 2025 to 2026 among the Welsh population aged 16 to 64 are higher among individuals from a White ethnic background (72.2%) than for individuals from a Black, Asian and Minority Ethnic background (70.6%). The employment rate gap has narrowed from 10.2 percentage points in 2024 to 2025 to 1.6 percentage points in 2025 to 2026. Over the last decade, the ethnicity employment rate gap has generally narrowed.
Figure 4.6: employment rate (percentage of population aged 16 to 64) by ethnicity and year, between financial years 2011 to 2012 and 2025 to 2026
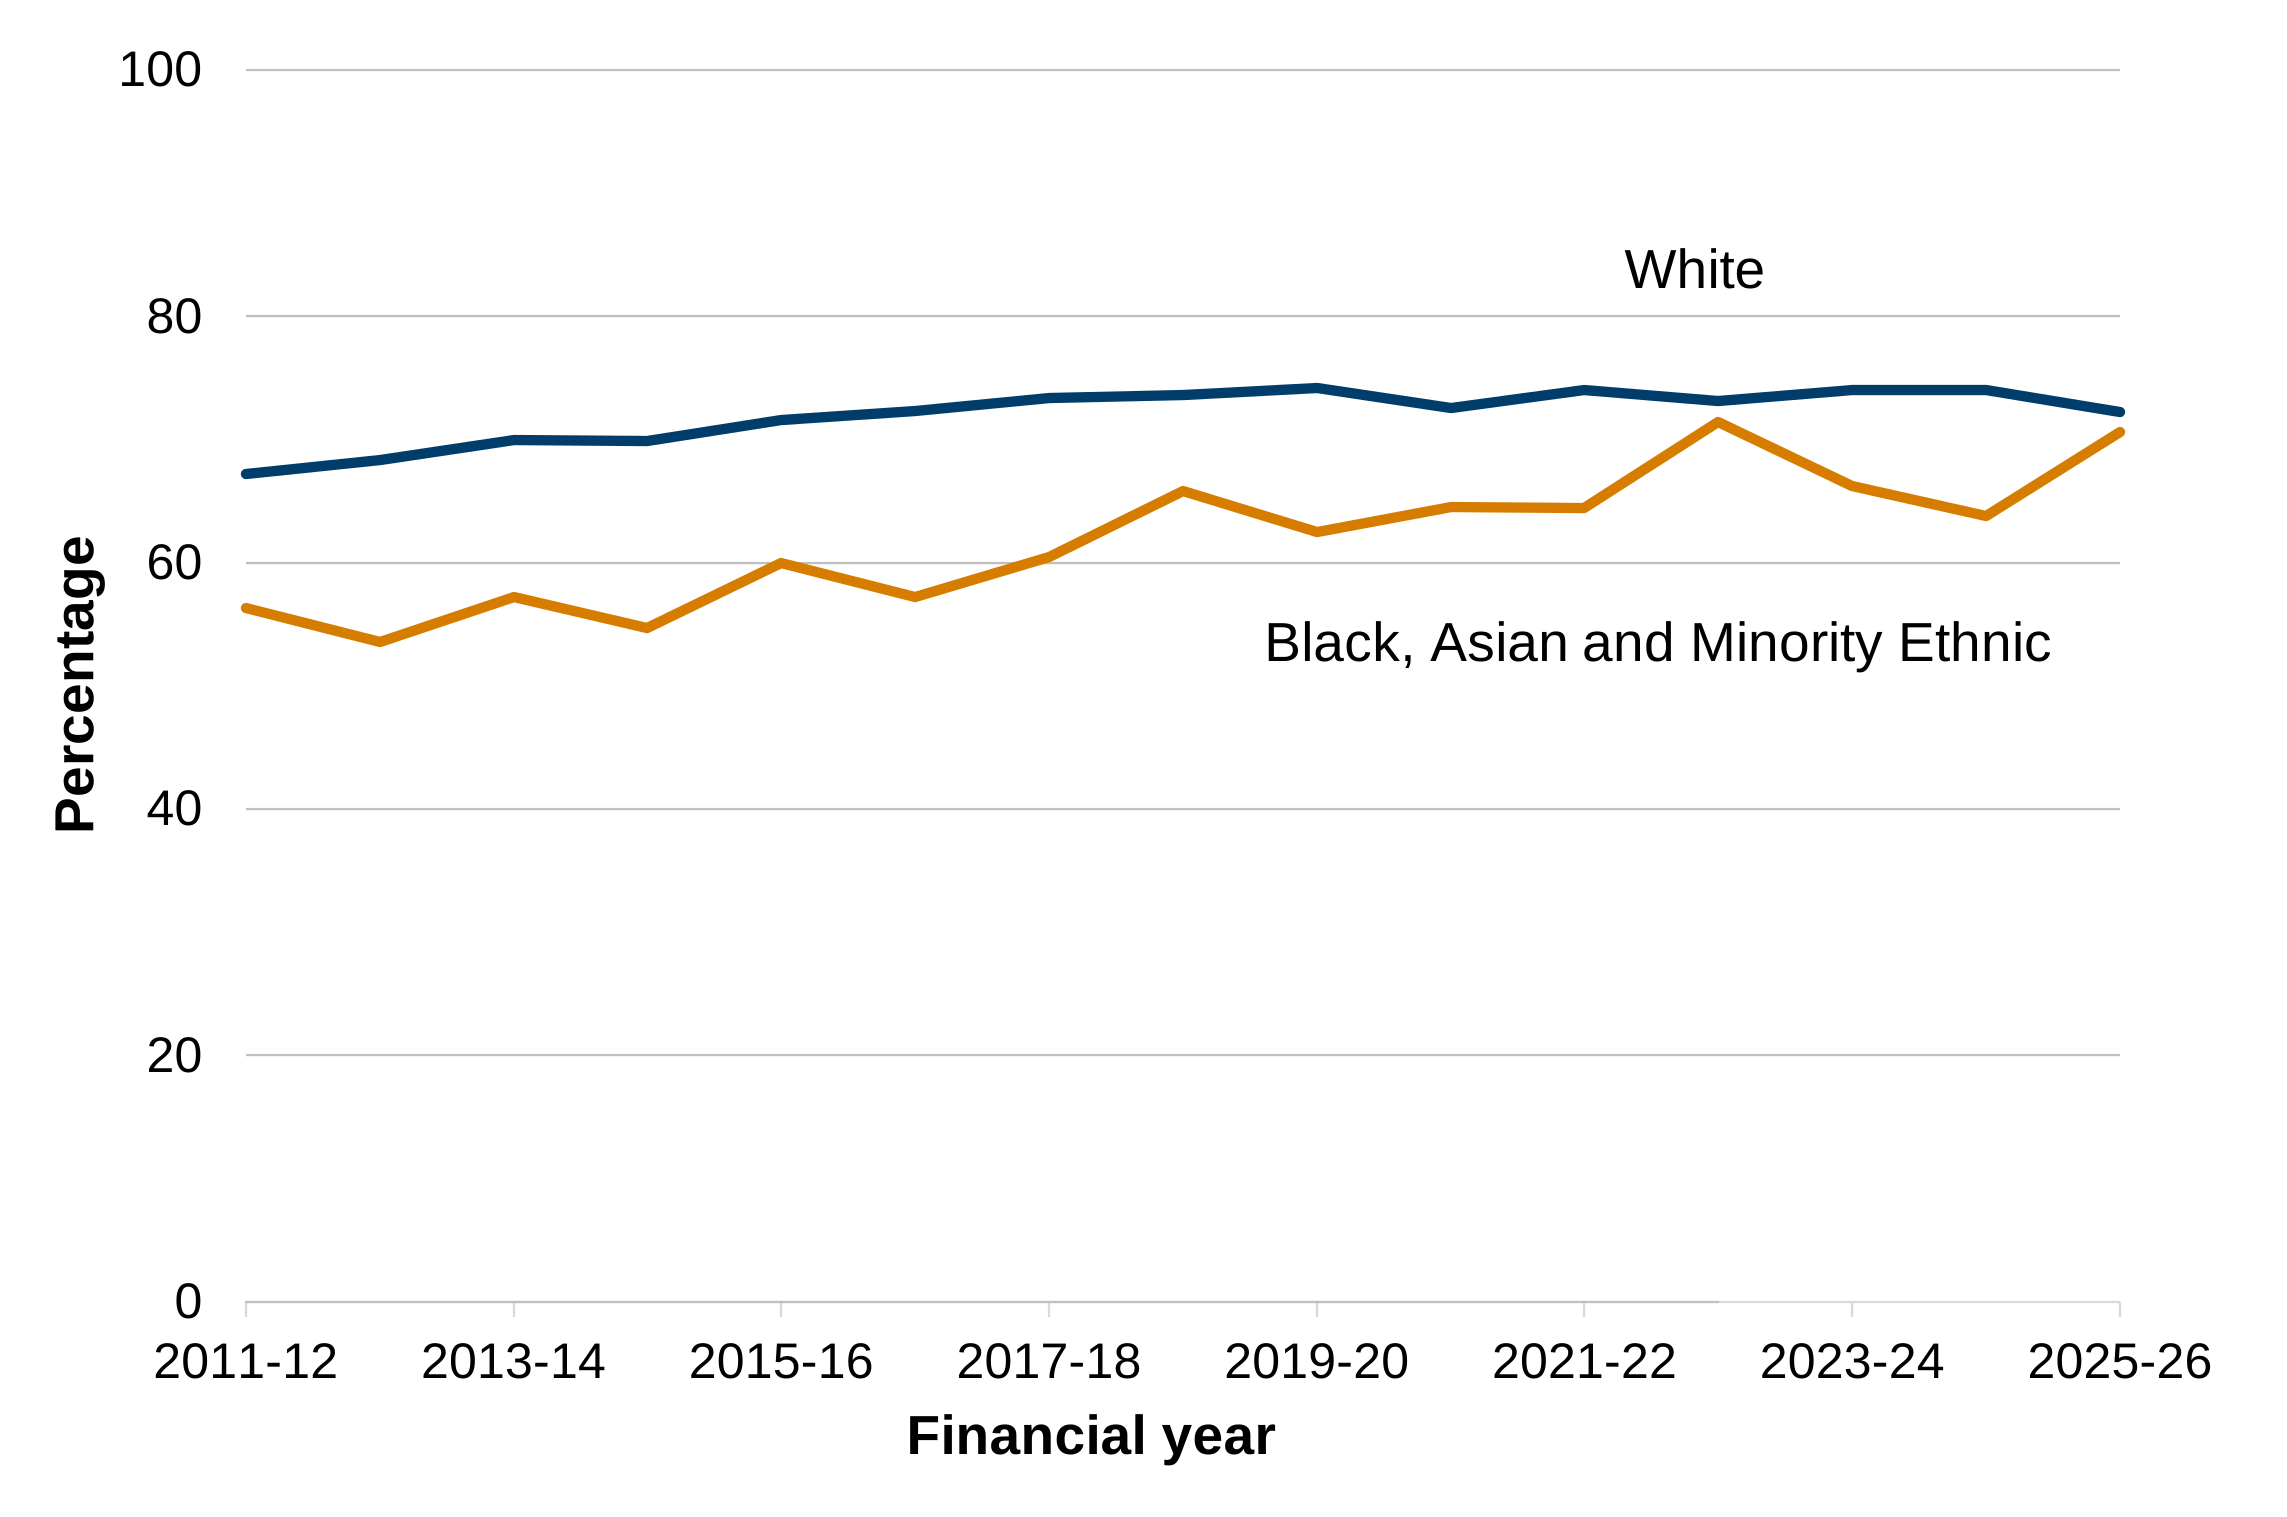
Description of figure 4.6: a line chart showing employment rates for those aged between 16 and 64 by ethnicity between 2011 to 2012 and 2025 to 2026. Those from a Black, Asian and Minority Ethnic background continue to have a lower employment rate than white individuals but the employment rate gap has generally narrowed over the last decade. The employment rate gap has narrowed from 10.2 percentage points in 2024 to 2025 to 1.6 percentage points in 2025 to 2026.
Source: Welsh Government analysis of the Annual Population Survey, Office for National Statistics
Ethnicity pay differences are based on median hourly earnings for all employees aged 16 and over. Black, Asian and Minority Ethnic employees earned, on average £1.32 (8.4%) less per hour than White employees in 2025. This compares to an ethnicity pay difference of £0.54 (or 3.6%) in 2024. However, there is high volatility in the ethnicity pay difference data which means it is not possible to determine whether there has been a significant change since 2015. Median hourly earnings for White employees have increased by 38.7% since 2019, whereas average hourly earnings for Black, Asian and Minority Ethnic employees have increased by 28.9%.
Being part of a Black, Asian or Minority Ethnic group is linked with a greater likelihood of relative income poverty. For the period from financial year 2020 to 2021 to financial year 2024 to 2025 there was a 48% likelihood of people whose head of household identifies as Black, Asian or part of a Minority Ethnic group to be living in relative income poverty. This compares to a 19% likelihood for those whose head of household identifies as White.
Those who identify as Black, Asian, or part of a Minority Ethnic group had higher levels of self-reported loneliness in 2022 to 2023 at 24% compared to 12% for those who identify as White. However, self-reported mental wellbeing (as measured by the Warwick Edinburgh Mental Well-Being Scale for adults) was higher in 2024 to 2025 for those who identified as Black, Asian, or part of a Minority Ethnic group (50.9) or White (Irish, Gypsy, Irish Traveller or any other white background) (51.5) than White (Welsh, English, Scottish, Northern Irish) (48.1).
Religion
The indicators show differences in education, employment, wellbeing and feelings of safety across religious groups. Religious people had higher mental wellbeing than non-religious people. Christians and non-religious people were less likely to be lonely.
In the 2021 Census, people who identified as Muslim, Sikh or Christian had the highest level of individuals with no qualifications. Those who identified as Hindu or an ‘other’ religion had the lowest level of individuals with no qualifications.
In the 2021 Census, people who identified as Hindu or as having no religion were the most likely to be employed. Those who identified as Jewish, Muslim or Christian were the least likely to be employed.
Those who identified as Christian or with no religion had similar levels of self-reported loneliness in financial year 2022 to 2023 at 10% and 13% respectively. This compared to 29% for those who identified with another religious affiliation. Although, in 2024 to 2025, self-reported mental wellbeing (as measured by the Warwick Edinburgh Mental Well-Being Scale for adults) was higher for Christians (49.3) and those with another religious affiliation (50.8) than those with no religion (47.4).
In 2024 to 2025, those with no religious affiliation were more likely to report feeling safe at home, in their local area and travelling (70%) compared to Christians (66%).
Sexual orientation
The available data show differences in education, employment, deprivation, wellbeing, and feelings of safety between sexual orientations.
In the 2021 Census, 8.4% of LGB+ people reported having no formal qualifications, compared to 19.5% of people who identified as Straight/Heterosexual. The percentage of people with no qualifications was lower for LGB+ people across all age groups.
In the 2021 Census, people who identified as “Gay or Lesbian”, and people who identified as “Straight/Heterosexual” were the most likely to be employed (69.9% and 69.8% respectively). People who identified as “Bisexual” and people who identified with another sexual orientation were less likely (52.5% and 49.9% respectively).
For the period from financial year 2022 to 2023 to financial year 2024 to 2025, 23% of people in households where the head of the household identified as Straight/Heterosexual were in relative income poverty compared with 25% of people in households where the head of household identified as LGB+.
The 2022 to 2023 National Survey for Wales indicated that people who identify as Lesbian, Gay or Bisexual are about twice as likely to report feeling lonely than others.
Those who identified as Straight/Heterosexual in the 2024 to 2025 national survey were more likely to report feeling safe at home, in their local area and travelling (69%) compared to those who identified as Lesbian, Gay or Bisexual (52%).
Gender identity
A voluntary question on gender identity was asked for the first time in Census 2021. Respondents aged 16 and over were asked “Is the gender you identify with the same as your sex registered at birth?” and had the option of selecting either “Yes” or selecting “No” and writing in their gender identity. Caution should be used when interpretating these results due to the uncertainty associated with the Census 2021 gender identity estimates. Users should refer to the specific advice in the Census 2021 gender identity estimates for England and Wales, additional guidance on uncertainty and appropriate use statistical article published by ONS for guidance on the confidence in different variables broken down by gender identity.
The 2021 Census also found that 41.2% of people aged 16 and over whose gender identity was different from their sex registered at birth reported being employed, compared to 54.5% of people whose gender identity was the same as their sex registered at birth.
The School Health Research Network’s Student Health and Wellbeing survey collects data on mental wellbeing for 11 to 16 year olds. In academic year 2023 to 2024 those who selected ‘neither word describes me’ for their gender reported lower mental wellbeing and higher levels of loneliness than those who selected the gender ‘boy’ or ‘girl’.
The School Health Research Network’s Student Health and Wellbeing survey also collects data on healthy lifestyle behaviours for pupils aged 11 to 16. In academic year 2023 to 2024, pupils who selected ‘neither word describes me’ for their gender were less likely than boys or girls to report having two or more healthy lifestyle behaviours.
Disability
In 2002 the Welsh Government adopted the social model of disability. Rather than defining people as disabled by their impairment (the medical model of disability), people with impairments or long-term health conditions are considered to be disabled by physical, attitudinal and organisational barriers created by society. Many of the data sources in this chapter use medical model definitions of disability in line with the Equality Act 2010 definition. In the Equality Act a “disability” means a physical or a mental condition which has a substantial and long-term impact on your ability to do normal day to day activities. However, we have used social model language in this section and chapter where possible.
The indicators show differences in education, employment, deprivation, wellbeing, and feelings of safety for disabled and non-disabled individuals. Disabled people had a lower employment rate and earned less than non-disabled people. Disabled people were also more likely to be in poverty, had lower mental well-being and were less likely to feel safe at home, in their local area and travelling.
In academic year 2024 to 2025, pupils with special educational needs scored 250.6 on average in the GCSE Capped 9 indicator (interim measure version), a decrease from 263.9 points in 2023 to 2024 and 282.0 points in 2018 to 2019.
Of the working-age population in 2025, disabled people were more likely to have no qualifications (13.2%) than non-disabled people (4.6%) and were less likely to hold qualifications at level 4 or higher. Compared to 2024 the proportion of disabled adults of working age with no qualifications decreased by 1.6 percentage points.
For the year ending 31 March 2026, the employment rate among disabled people aged 16 to 64 in Wales was 50.3% whilst the rate for people who are not disabled was 80.8%. The employment rate gap for disabled people in 2025 to 2026, of 30.5 percentage points, has reduced from 35.4 percentage points in 2015 to 2016.
Figure 4.7: employment rates (percentage of population aged 16 to 64) of disabled and non-disabled people by financial year, 2013-14 to 2025-26 (rates for year ending March)
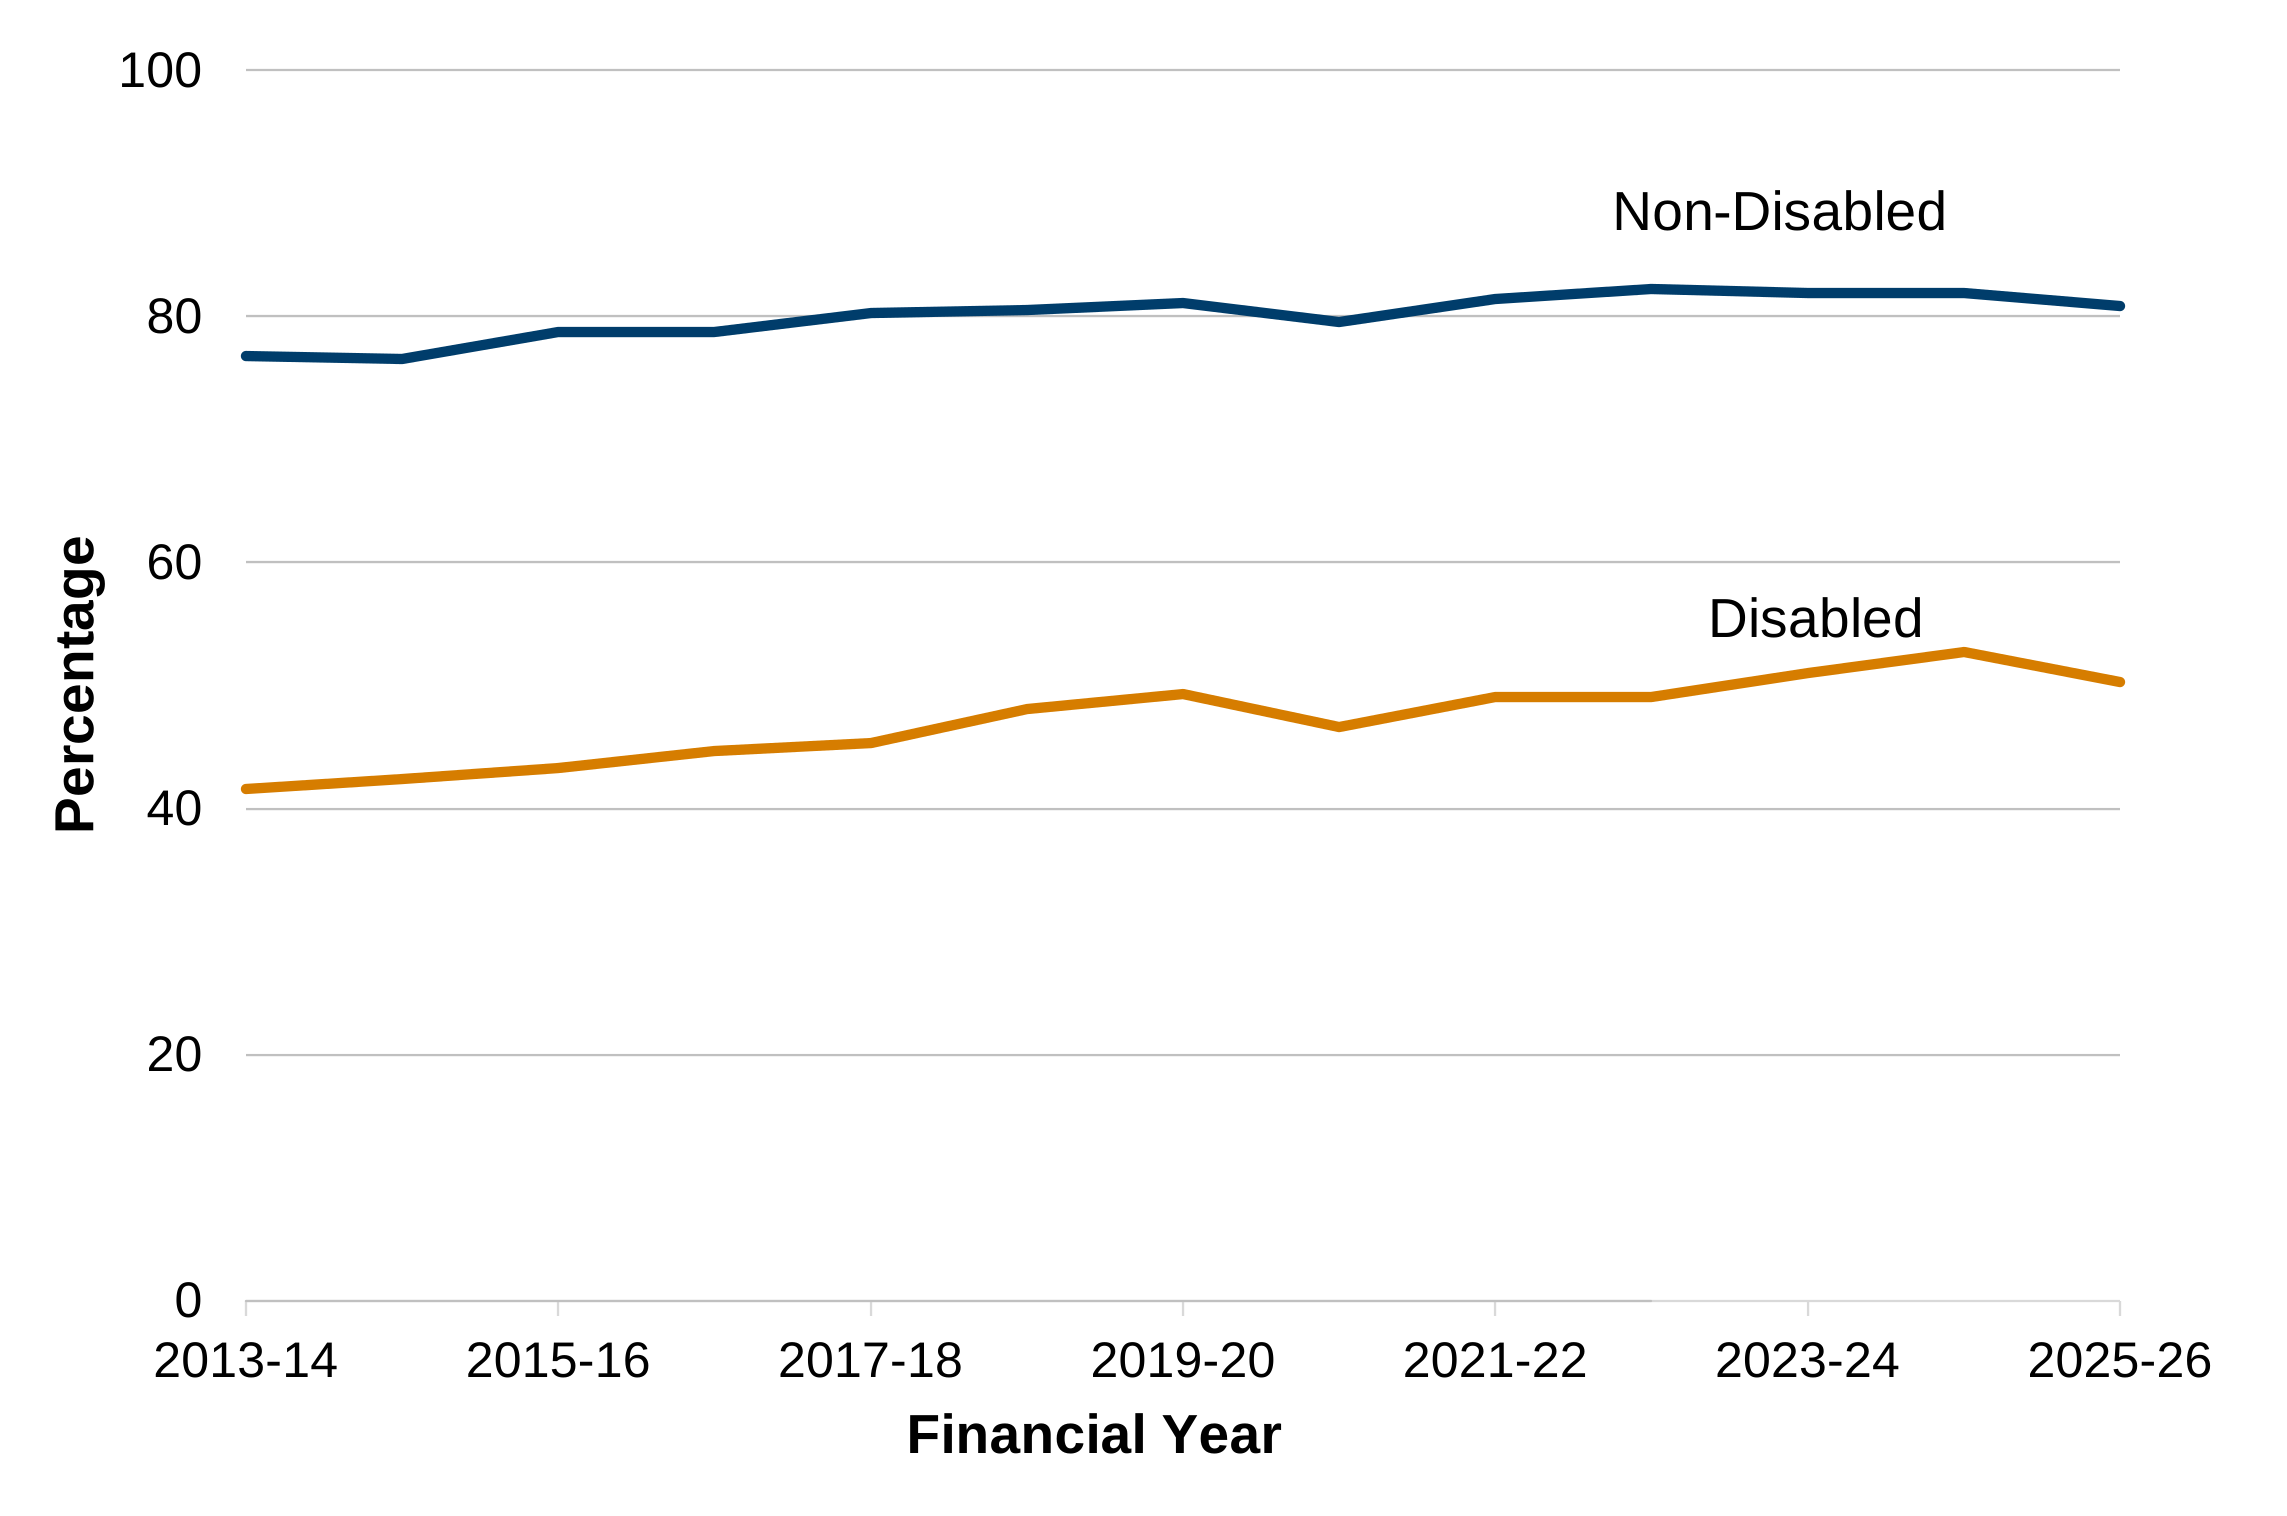
Description of figure 4.7: a line chart showing employment rates for disabled and non-disabled individuals aged between 16 and 64 between financial years 2013 to 2014 and 2025 to 2026. The employment rate gap has generally decreased over time, although disabled people continue to have an employment rate that is 30.5 percentage points lower than non-disabled people in 2025 to 2026.
Source: Welsh Government analysis of the Annual Population Survey, Office for National Statistics
Disability pay differences are based on median hourly earnings for all employees aged 16 to 64. The pay difference between disabled and non-disabled people in Wales was £1.06 (6.6%) in 2025. This means that disabled people in Wales earned, on average, £1.06 less per hour than non-disabled people. This is a decrease on the previous year when the pay gap was £1.18 (7.8%). However, there is high volatility in the disability pay difference data which means it is not possible to determine whether there has been a significant change since 2015.
In the latest period (financial year 2022 to 2023 to financial year 2024 to 2025), for working-age adults, 25% of individuals who lived in a family where someone was disabled were in relative income poverty compared with 19% of those in families where no-one was disabled. For the same period, 35% of children who lived in a family where someone was disabled were in relative income poverty compared with 31% of those in families where no-one was disabled.
Figure 4.8: percentage of working age adults in relative income poverty in households with disabled and non-disabled people by combined financial years, 2015-17 to 2023-25 (year ending March) [Note 1] [Note 2]
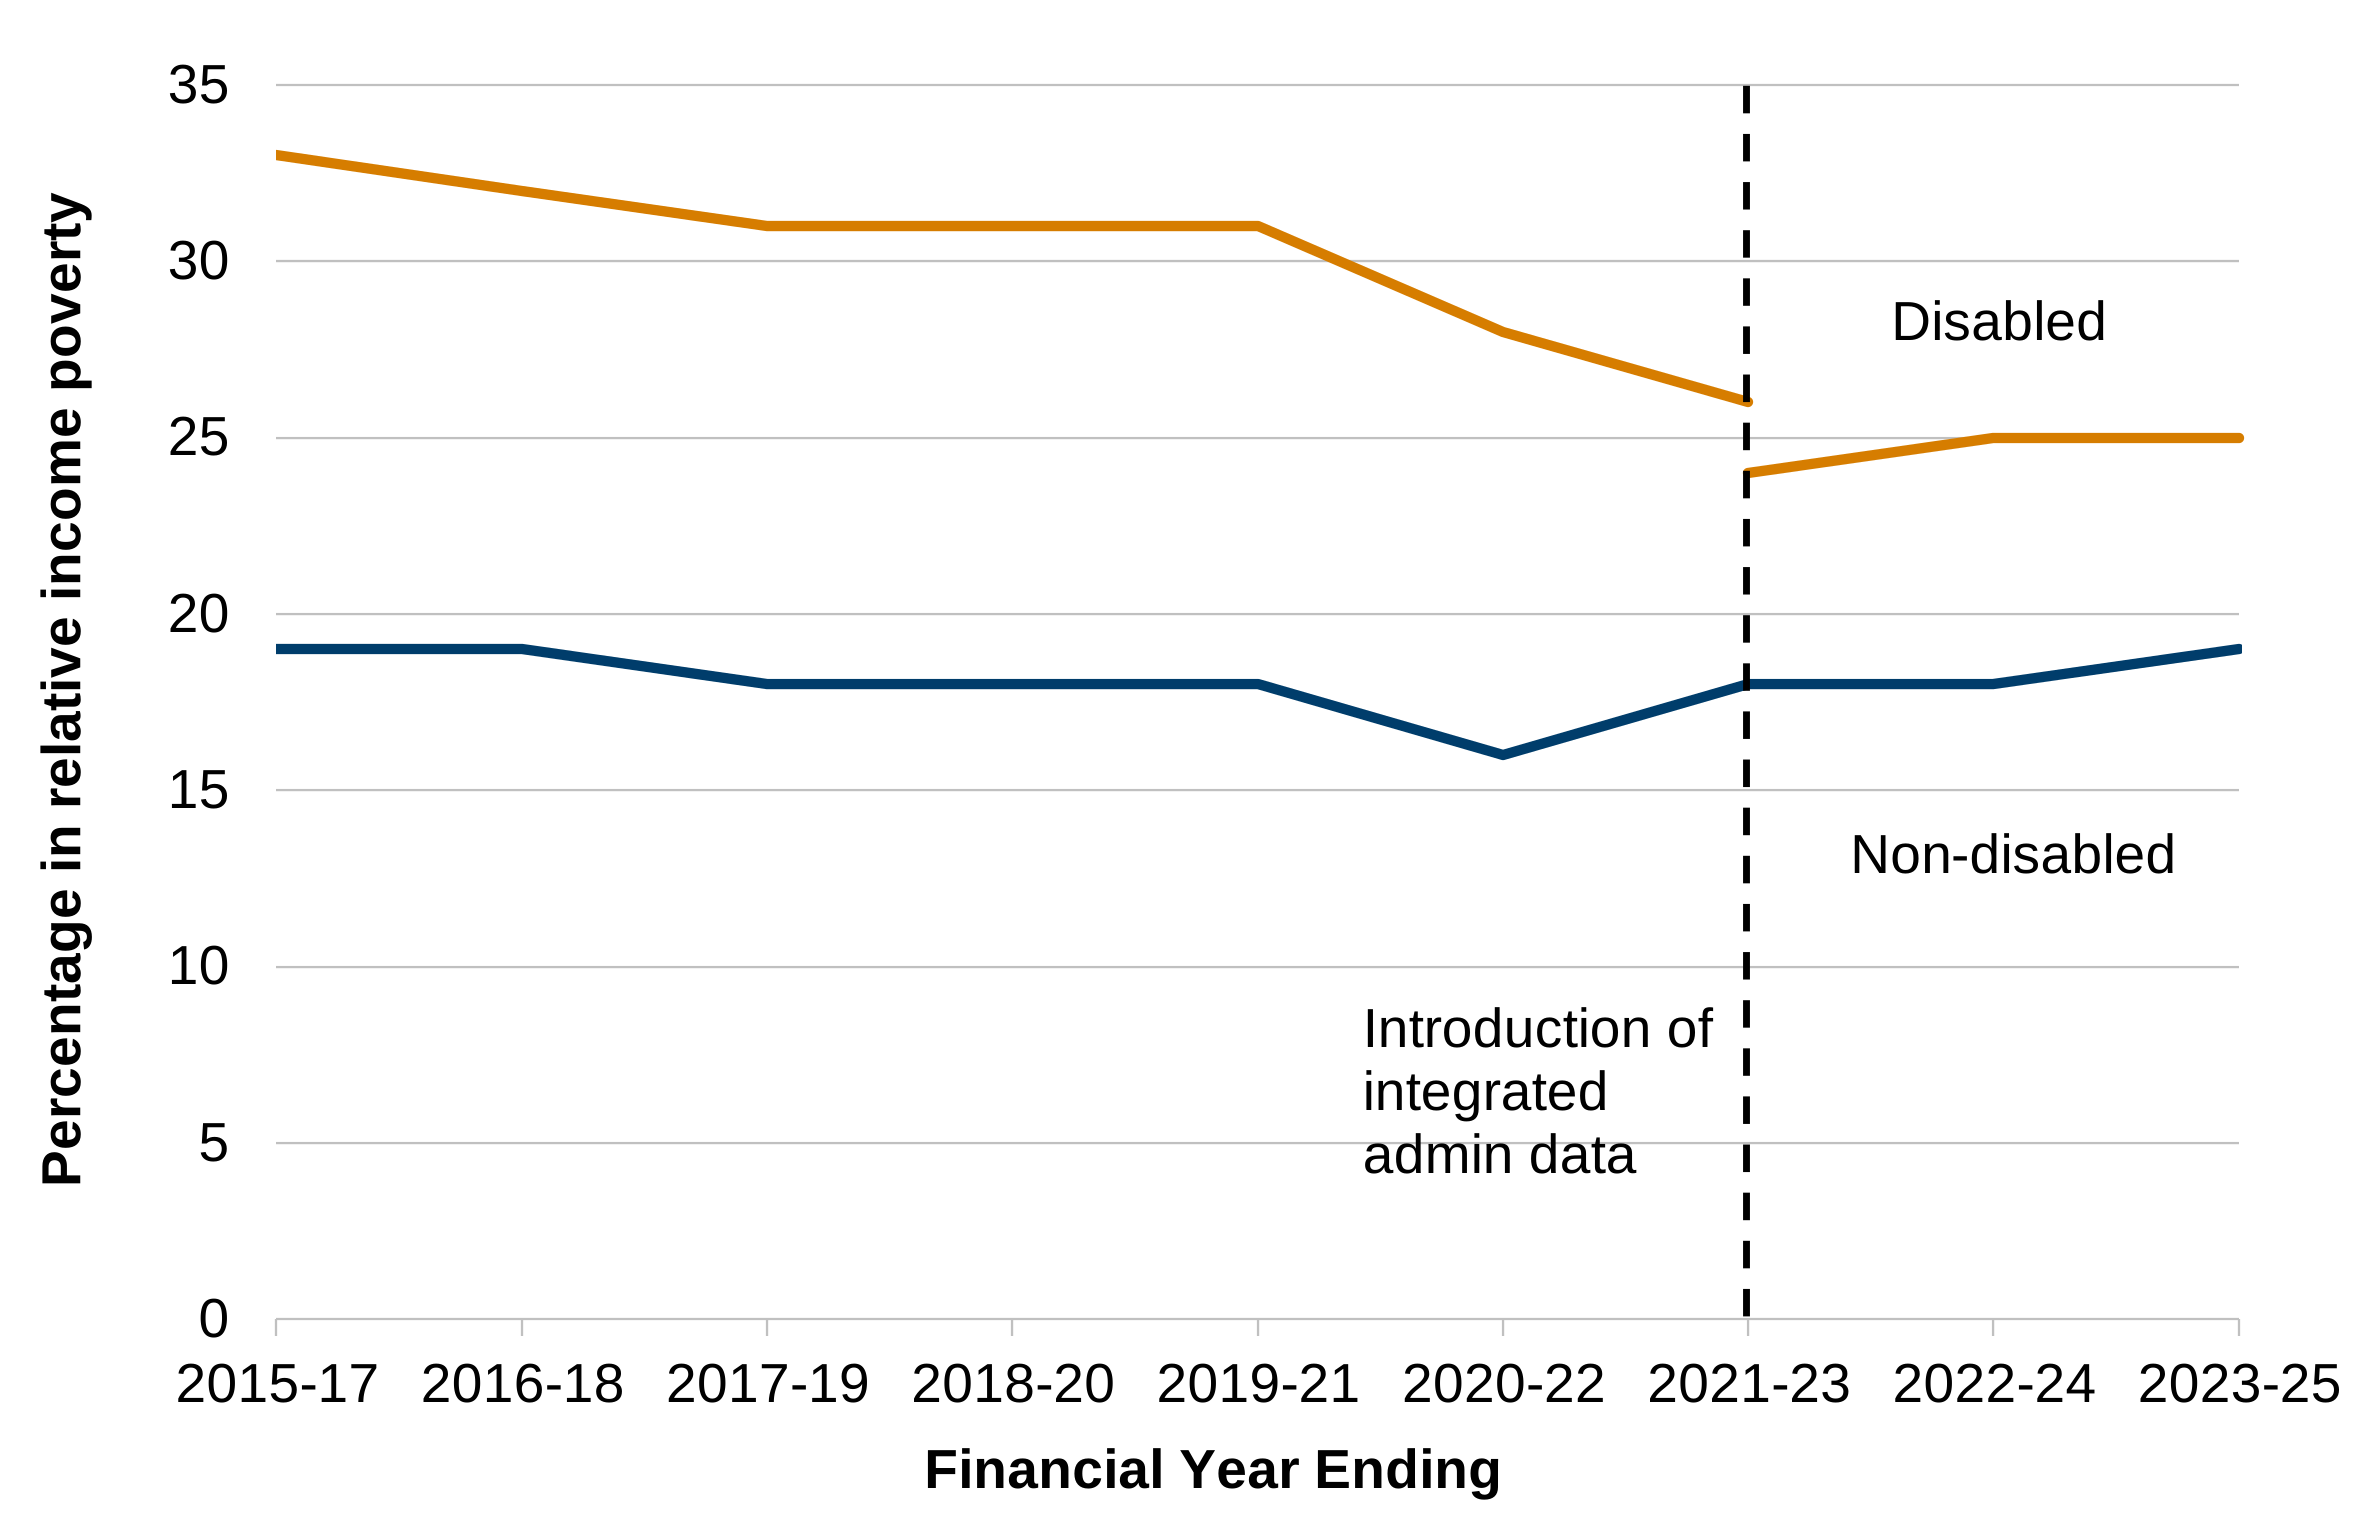
Description of figure 4.8: a line chart showing the percentage of working age adults in relative income poverty in households with disabled and non-disabled people. Adults of working age living in a family where someone is disabled are more likely to be in relative income poverty compared with those in families where no-one is disabled.
[Note 1] Data from the period which spans financial years ending 2021 to 2023 are not comparable with previous periods due to the introduction of integrated administrative data on benefits not used previously. More information is provided in the latest relative income poverty statistical release and a link to this is provided in the Further Reading section at the end of this chapter.
[Note 2] Estimates for periods which span 2020 to 2021 do not include the data collected during 2020 to 2021 in calculations. 2020 to 2021 estimates are unreliable as they are based on data collected during the first year of the coronavirus (COVID-19) pandemic, when lockdown rules severely disrupted the data collection.
Source: Welsh Government analysis of the Households Below Average Income (HBAI) data set
In financial year 2024 to 2025, 1 in 7 disabled people or people with a limiting long-standing illness (14%) lived in a household in material deprivation compared with 10% of people who were not disabled. In previous survey years around 1 in 4 or 5 disabled people or people with a limiting long-standing illness lived in a household in material deprivation. The National Survey for Wales sample was smaller in 2024 to 2025 than in previous years and included less people from low-income areas. This may have impacted on the estimates for material deprivation.
In 2024 to 2025, disabled adults or those with a limiting long-standing illness had lower mental wellbeing (43.6) compared to non-disabled individuals (50.8) and in 2022 to 2023 disabled individuals were more likely to report feeling lonely.
In 2024 to 2025 disabled adults were less likely to report feeling safe at home, in their local area and travelling (60%) than non-disabled people (73%).
Marital status
In financial year 2024 to 2025, married people had better mental wellbeing than those who were single. Married people had an average mental wellbeing score of 49.7, compared with 47.1 for single people.
In 2022 to 2023, people who were married were least likely to report being lonely (8%), while people who were separated but legally married were the most likely (21%). People who were single, divorced, or widowed were also more likely to report loneliness than people who were married (17%, 17% and 14% respectively).
Further reading
Equality, Race, and Disability Evidence Units (Welsh Government)
The Anti Racist Wales Action plan: measuring its impact on people's lives (Welsh Government)
Anti-racist Wales Action Plan interactive dashboard: 2026 (Welsh Government)
Is Wales Fairer? (2023) (Equality and Human Rights Commission)
Centre for Equality and Inclusion (Office for National Statistics)
GSS Equalities Data Navigator Tool (Government Statistical Service)