
Wellbeing of Wales 2026 - Progress towards national milestones
A summary of progress on improving our social, economic, environmental and cultural wellbeing.
In this page
National milestones
The milestones are generational targets which describe the pace and scale of change needed in important areas under the 7 wellbeing goals. There are 17 national milestones in total, covering 16 national indicators.
This chapter aims to assess progress of the national milestones. Change is assessed since 2015 (the year of the Well-being of Future Generations Act) although the milestones themselves were not set until later. Where data is not available for 2015, the nearest possible year has been used.
The assessment in this chapter helps us understand and communicate progress towards the goals and milestones. It should not necessarily be used to evaluate the impact of the Well-being of Future Generations Act as many other factors will influence the direction of some indicators. It is also important to consider indicators and milestones in the context of longer-term trends prior to 2015, which are presented in the other chapters of this report.
We assign each measure as either improved, deteriorated, no change or not assessed. Where possible, we have used measures such as statistical significance to make this assessment. In our assessment, we have not considered whether the milestones are on course to be met, simply the direction of change.
Progress towards the milestones
Some of the 17 milestones have multiple parts to them, so in total we made 20 assessments of progress. 10 of these were assessed as improved since 2015 (or the nearest possible year), suggesting that Wales is heading in the right direction towards the milestone. However, in some cases, even though the trend may be moving in the right direction, we will need to move faster to reach the target by 2050. 5 milestones showed a deterioration and 5 showed little or no change.
For one milestone (energy performance of homes) progress cannot yet be assessed because there is only one year of data.
In most cases, the milestones continued to follow a longer-term trend that was established before 2015. Longer term trends, and more detailed analysis of the milestones are included within the relevant chapters throughout the Wellbeing of Wales report.
The following sections of this chapter provide the progress assessment for each milestone.
Healthy life expectancy
To increase the healthy life expectancy of adults and narrow the gap in healthy life expectancy between the least and the most deprived by at least 15% by 2050.
Deteriorated
- Adult healthy life expectancy between 2015 to 2017 and 2022 to 2024.
- The gap in adult healthy life expectancy between most and least deprived areas between 2015 to 2017 and 2022 to 2024.
Figure 1: gap in healthy life expectancy between the most and least deprived areas, females and males, 2015 to 2017 to 2022 to 2024 [Note 1]
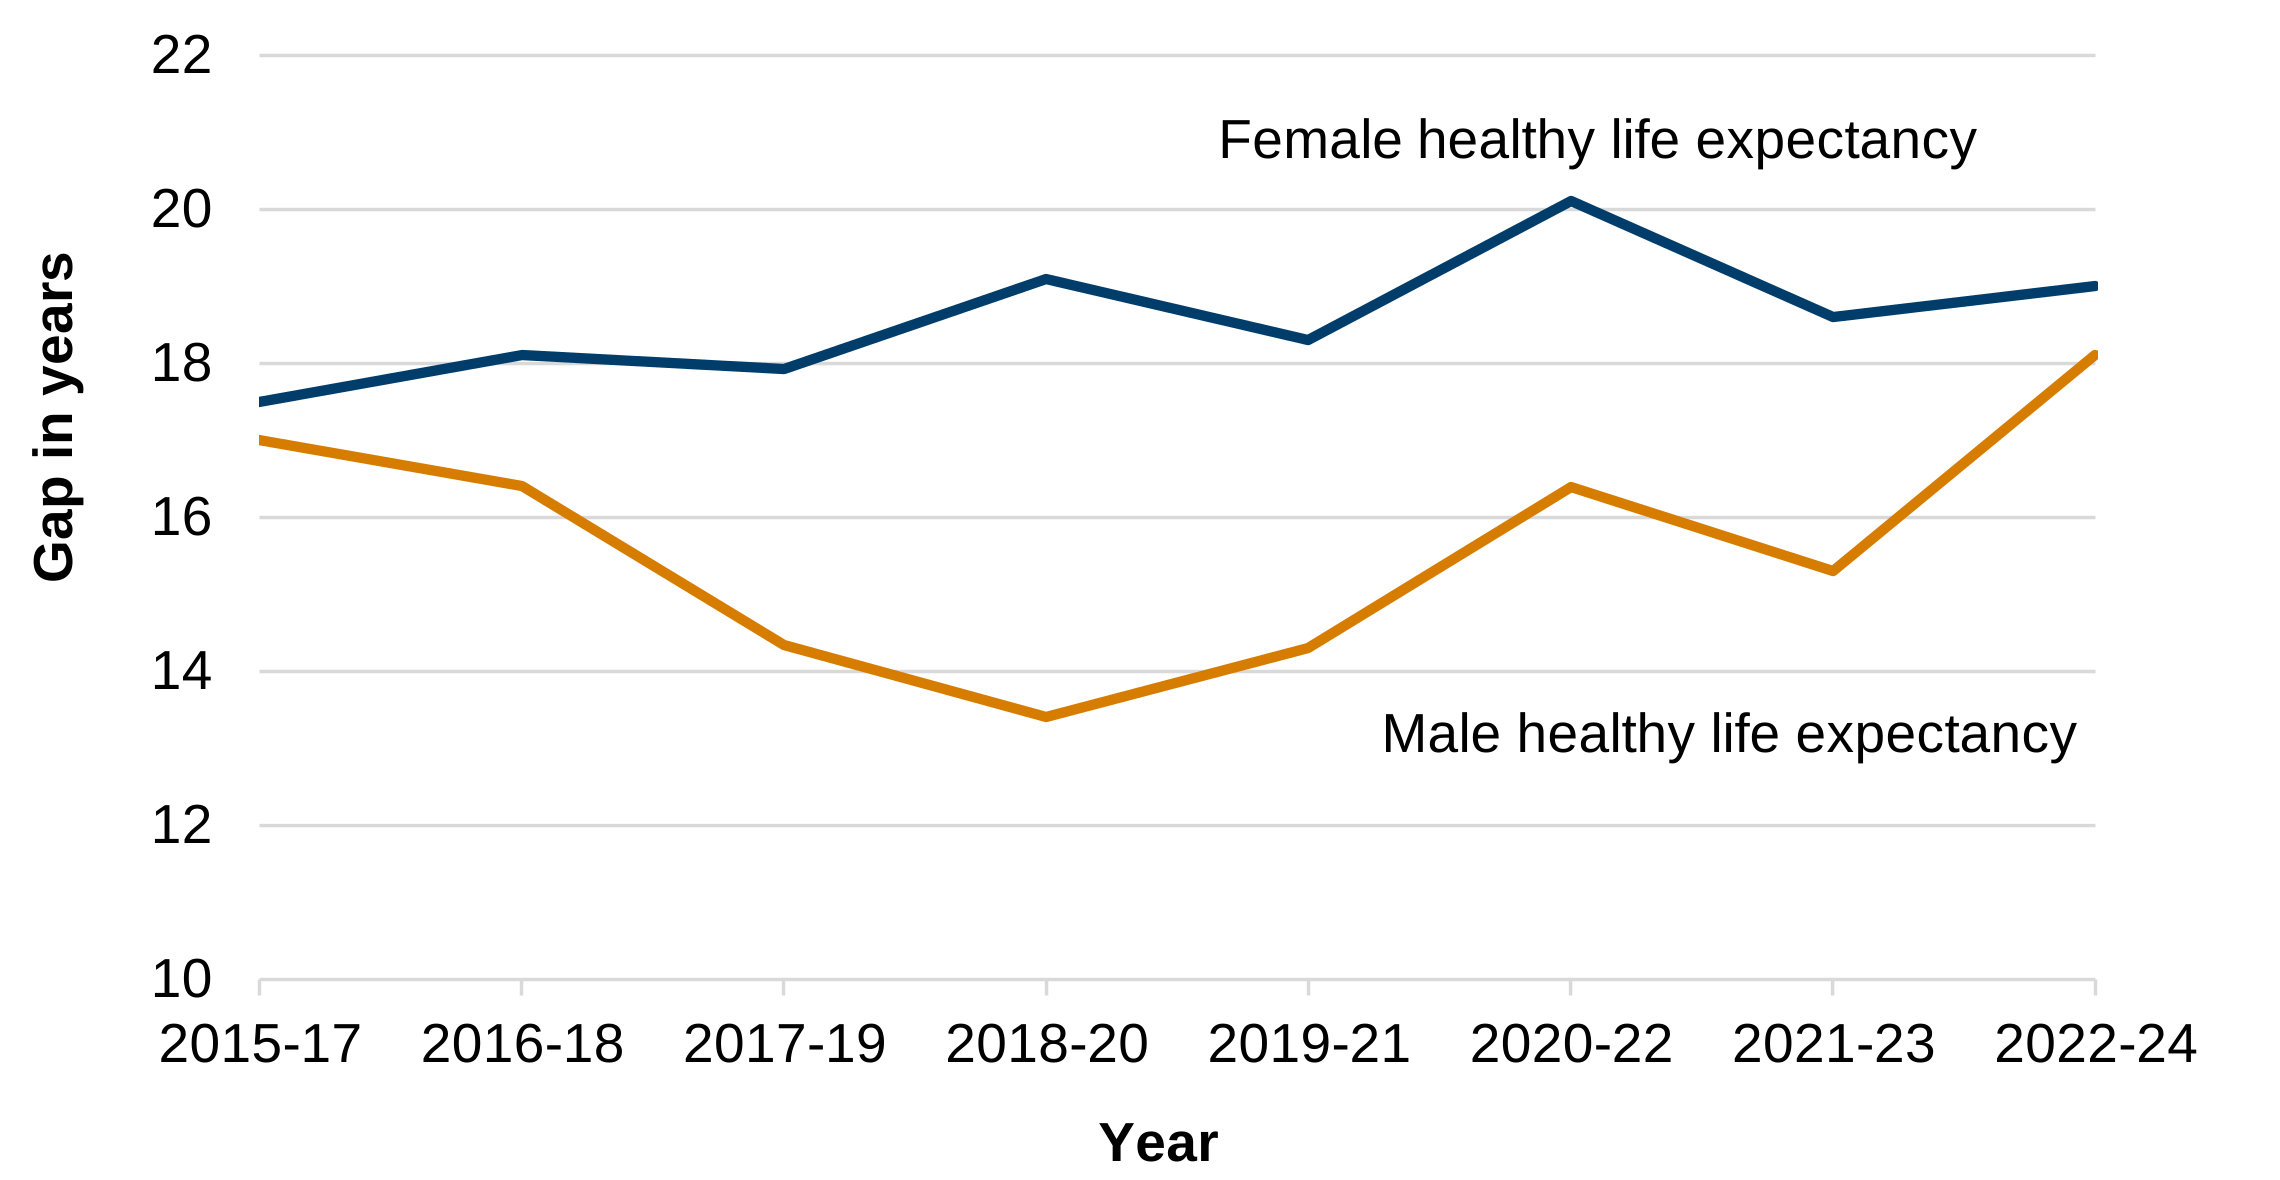
Description of figure 1: a line chart showing that healthy life expectancy at birth has fallen for females from 62.0 years in 2015 to 2017 to 58.5 years in 2022 to 2024 and males from 61.2 years in 2015 to 2017 to 59.2 years in 2022 to 2024. The gap in healthy life expectancy between the most and least deprived areas has deteriorated for females during this period (from 17.5 in 2015 to 2017 to 19.0 years in 2022 to 2024). The gap in male healthy life expectancy between the most and least deprived areas has also deteriorated during this period (from 17.0 in 2015 to 2017 to 18.1 years in 2022 to 2024).
Source: healthy life expectancy, Office for National Statistics.
[Note 1] The y-axis does not start at zero.
Healthy lifestyle behaviours
To increase the percentage of adults with 2 or more healthy lifestyle behaviours to more than 97% by 2050.
Improved
Between financial years 2020 to 2021 and 2024 to 2025.
Figure 2: percentage of adults with 2 or more healthy lifestyle behaviours, 2016-17 to 2024-25 [Note 1], [Note 2], [Note 3], [Note 4]
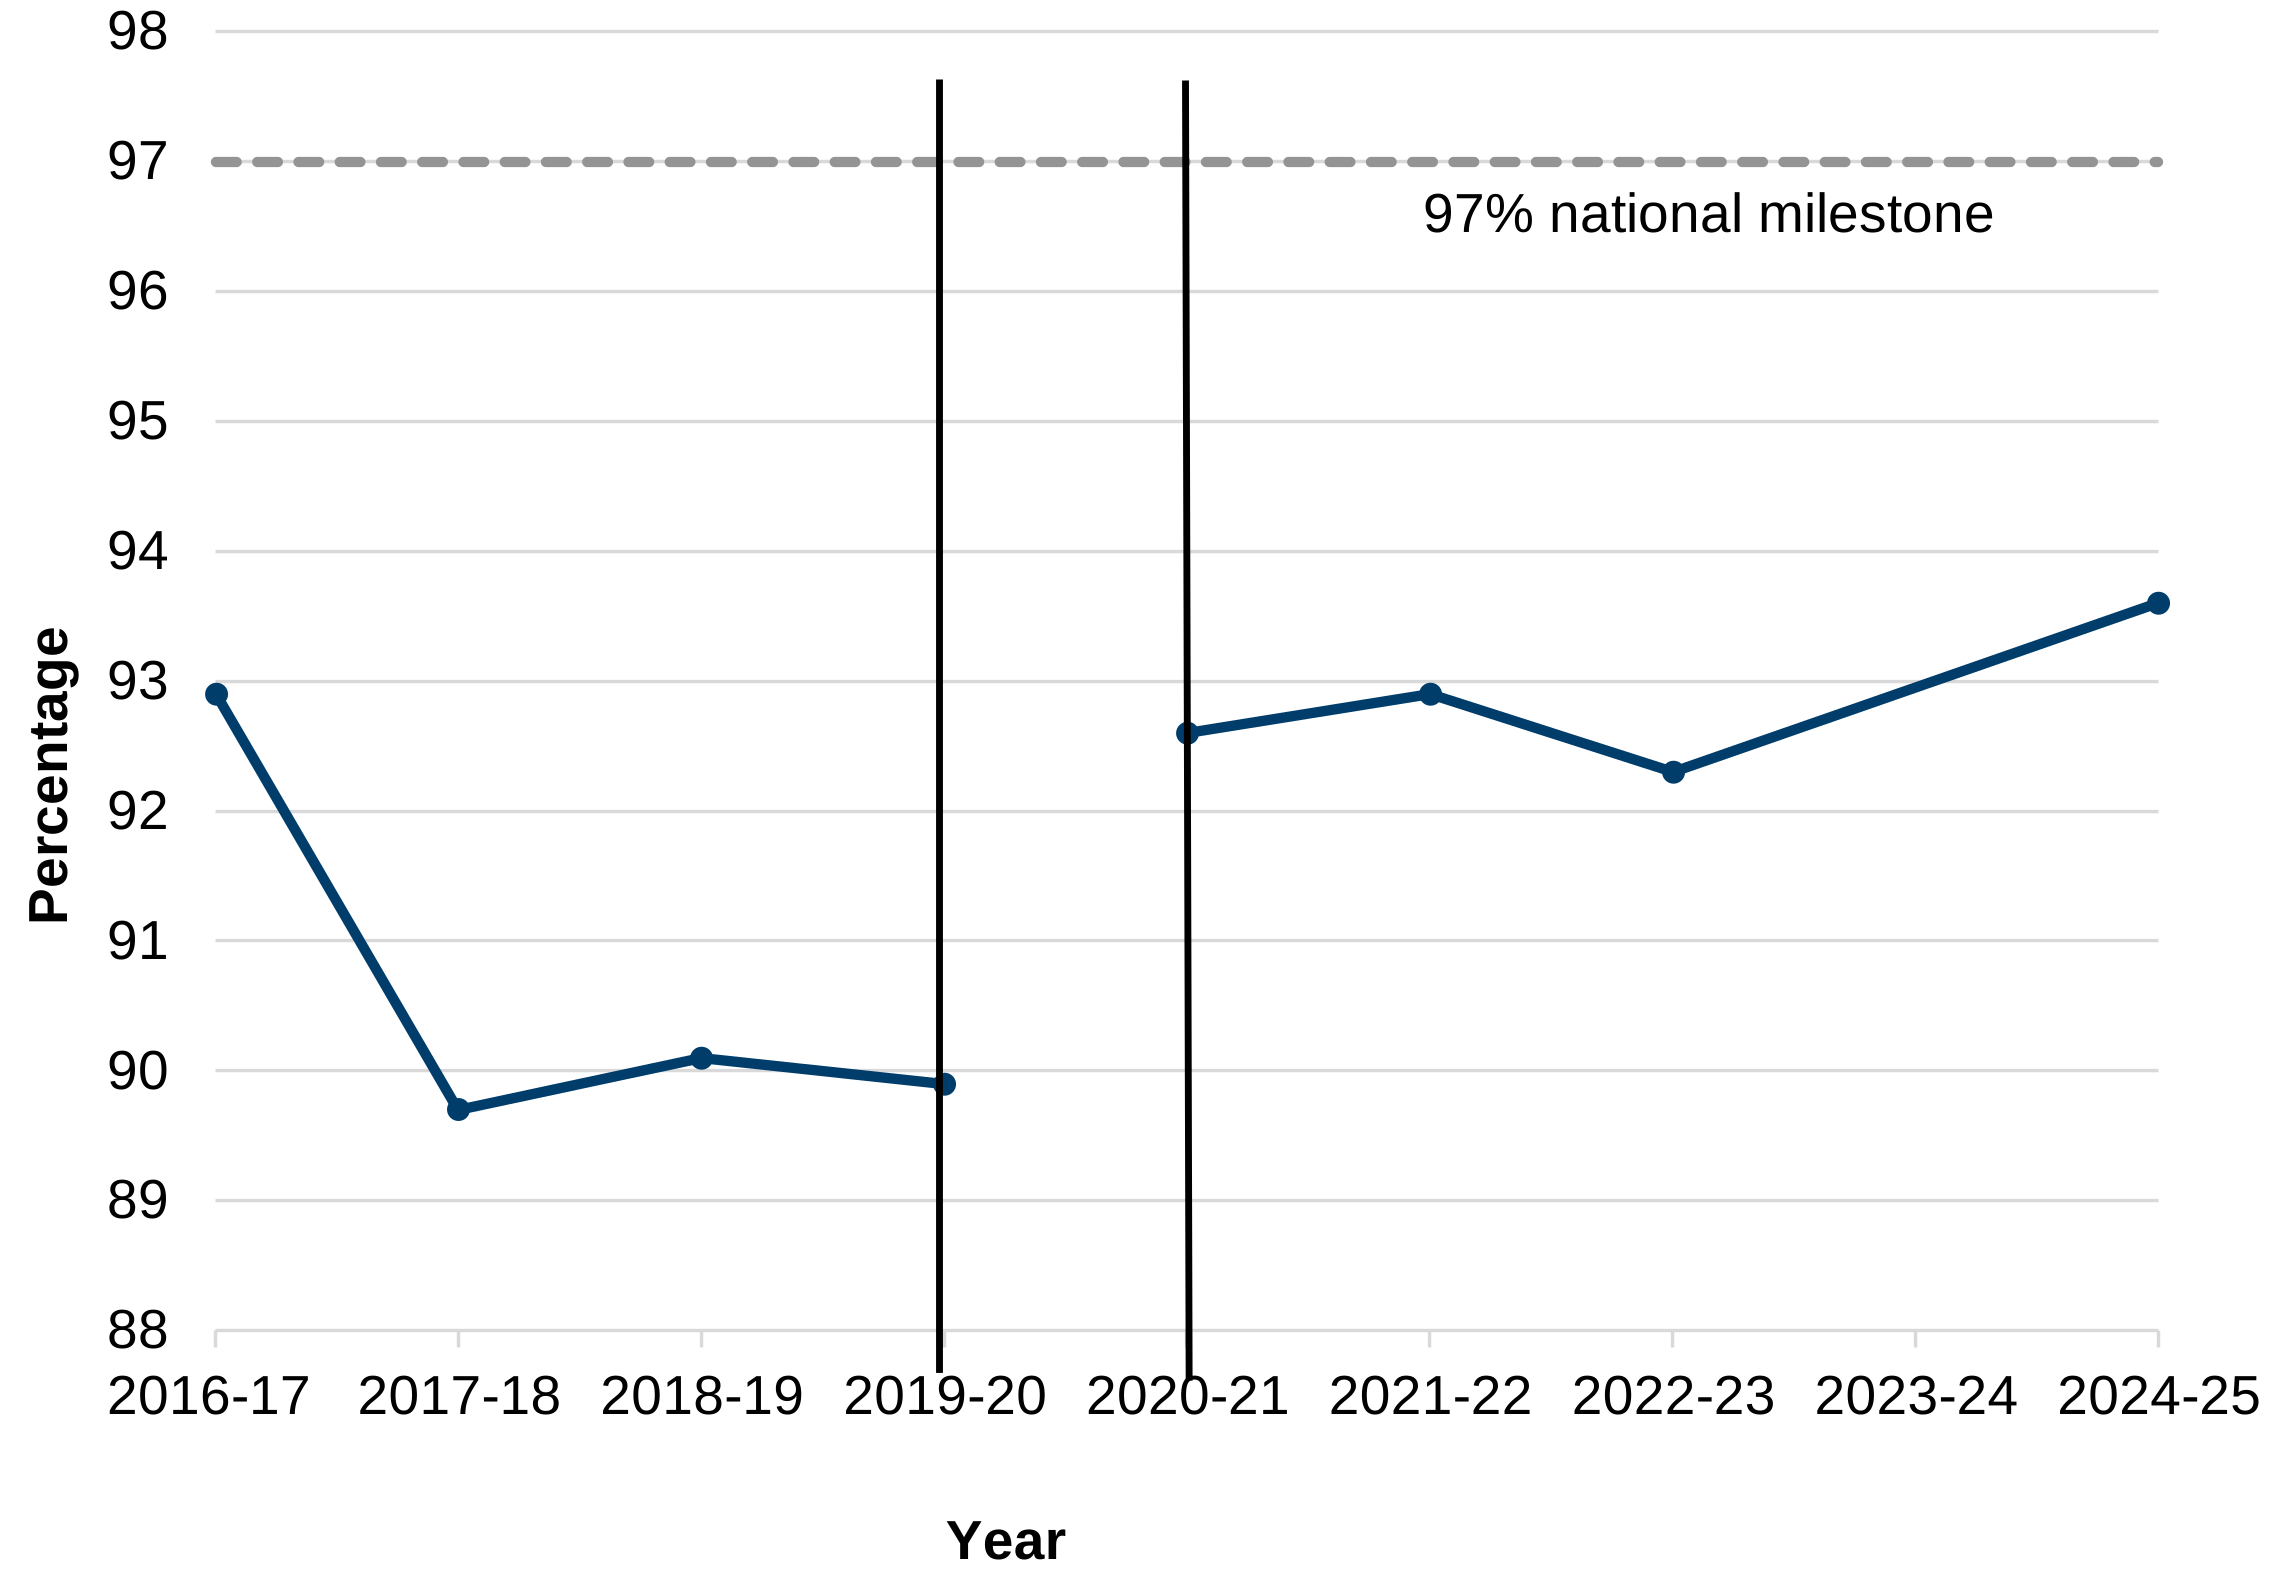
Description of figure 2: a line chart showing that the percentage of adults with 2 or more healthy behaviours deteriorated from 2016 to 2017 to 2019 to 2020. The trend since 2020 to 2021 appears to have improved to around similar levels seen in 2016 to 2017 but is not directly comparable, due to a change in the method of reporting.
Source: National Survey for Wales, Welsh Government.
[Note 1] Results from 2020 to 2021 are not comparable with previous years due to changes in the survey.
[Note 2] Results from 2020 to 2021 are for January to March only and not annual data.
[Note 3] The National Survey did not take place in 2023 to 2024 therefore there are no data for that year.
[Note 4] The y-axis does not start at zero.
Healthy lifestyle behaviours in children
To increase the percentage of children with 2 or more healthy behaviours to 94% by 2035 and more than 99% by 2050.
Improved
Between academic years 2017 to 2018 and 2023 to 2024.
Figure 3: percentage of young people aged 11 to 16 with 2 or more healthy behaviours, 2017 to 2018 (academic year) to 2023 to 2024 [Note 1]
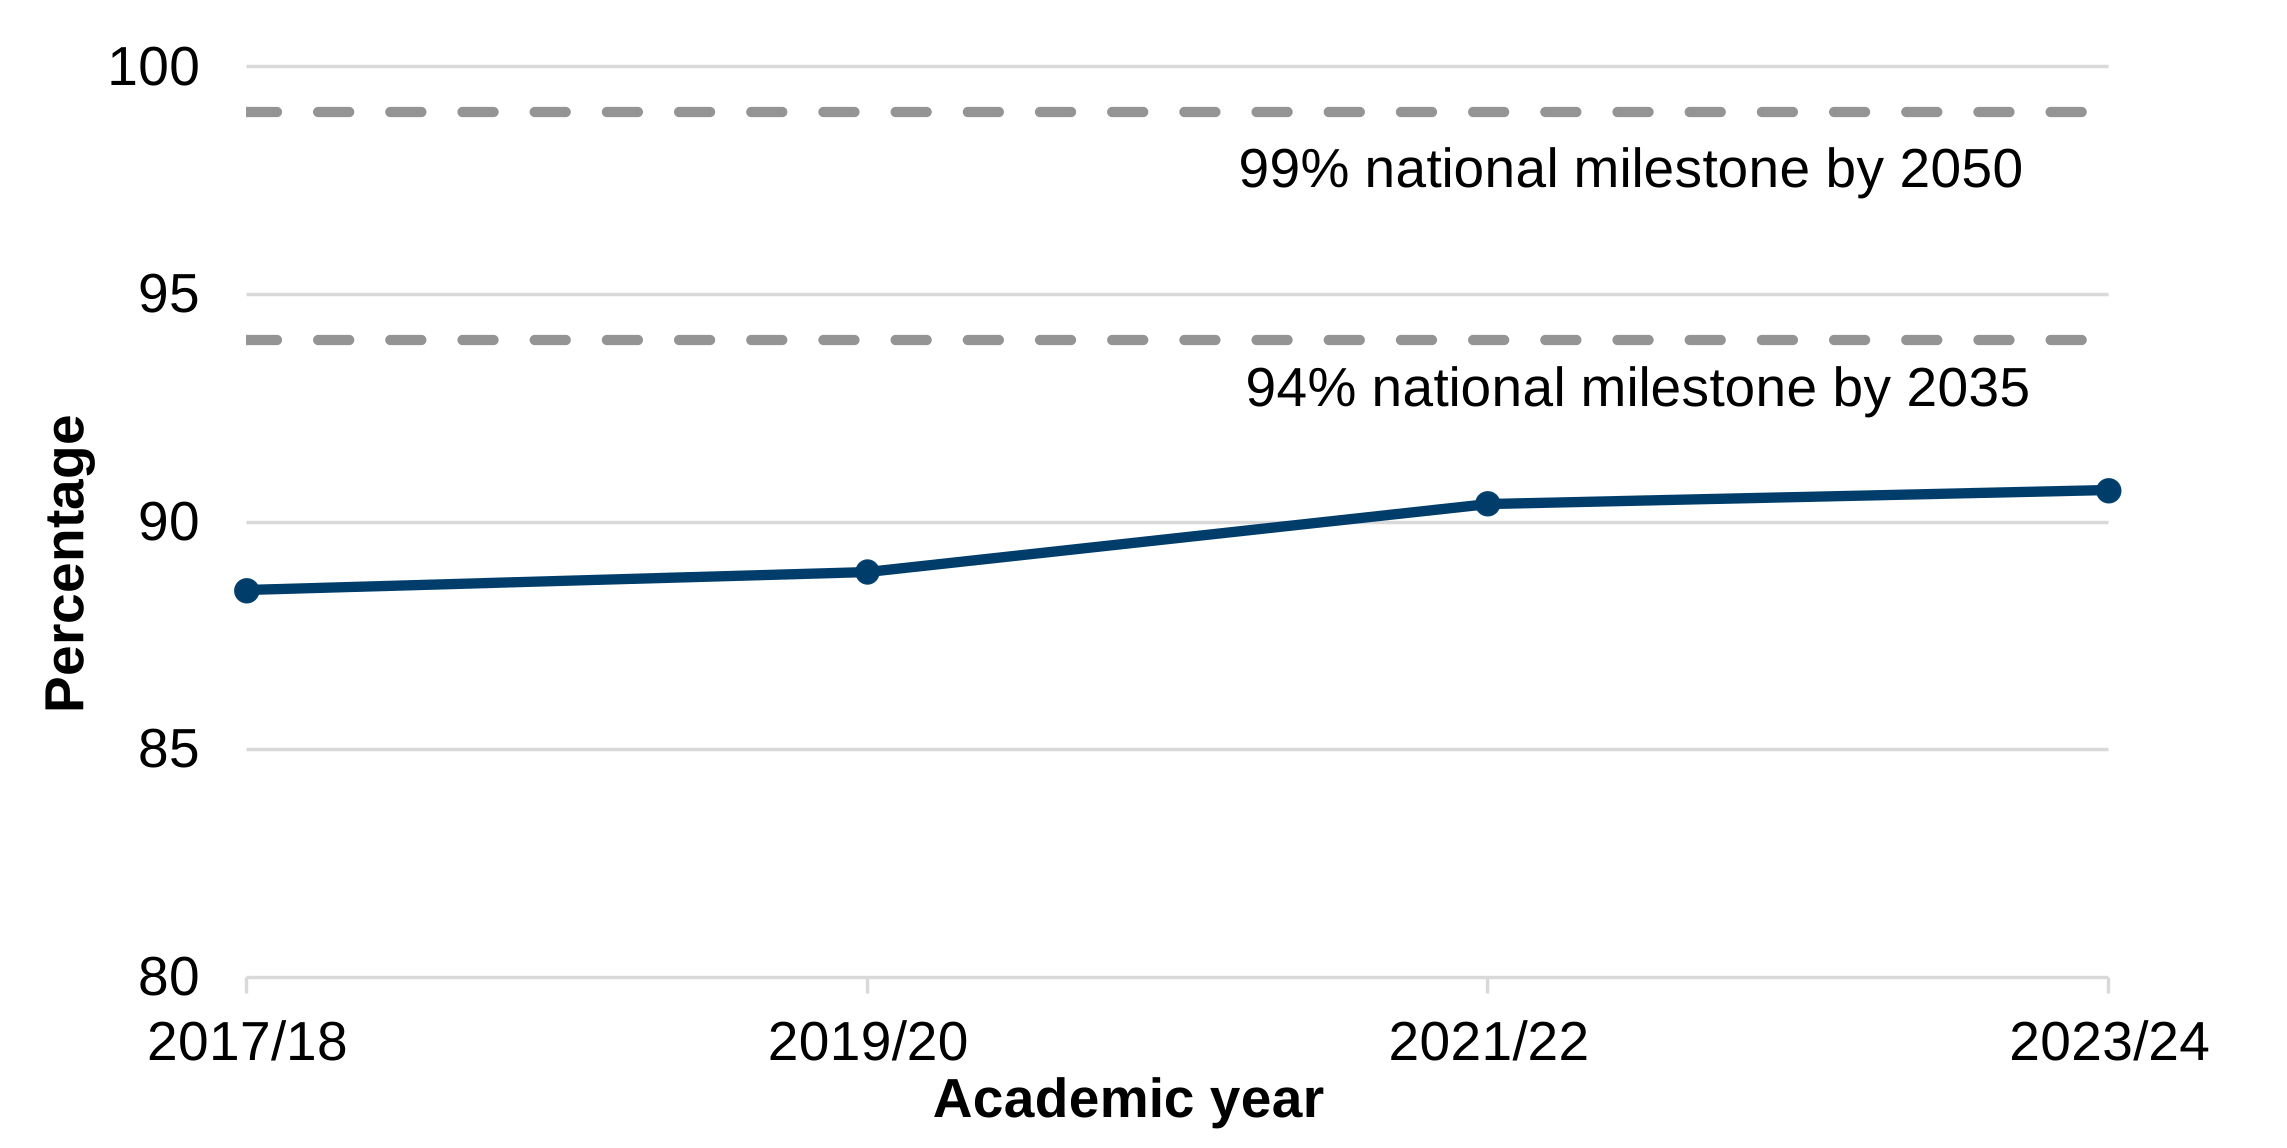
Description of figure 3: a line chart showing that the percentage of young people aged 11 to 16 with 2 or more healthy behaviours has improved from 88.5% in 2017 to 90.7% in academic year 2023 to 2024.
Source: school health research network student health and wellbeing survey.
[Note 1] The y-axis does not start at zero.
Working age adults with level 3 qualifications
75% of working age adults in Wales will be qualified to level 3 or higher by 2050
Improved
Between 2015 and 2025.
Figure 4: percentage of adults of working age (18 to 64) with a qualification at level 3 or above, 2015 to 2025
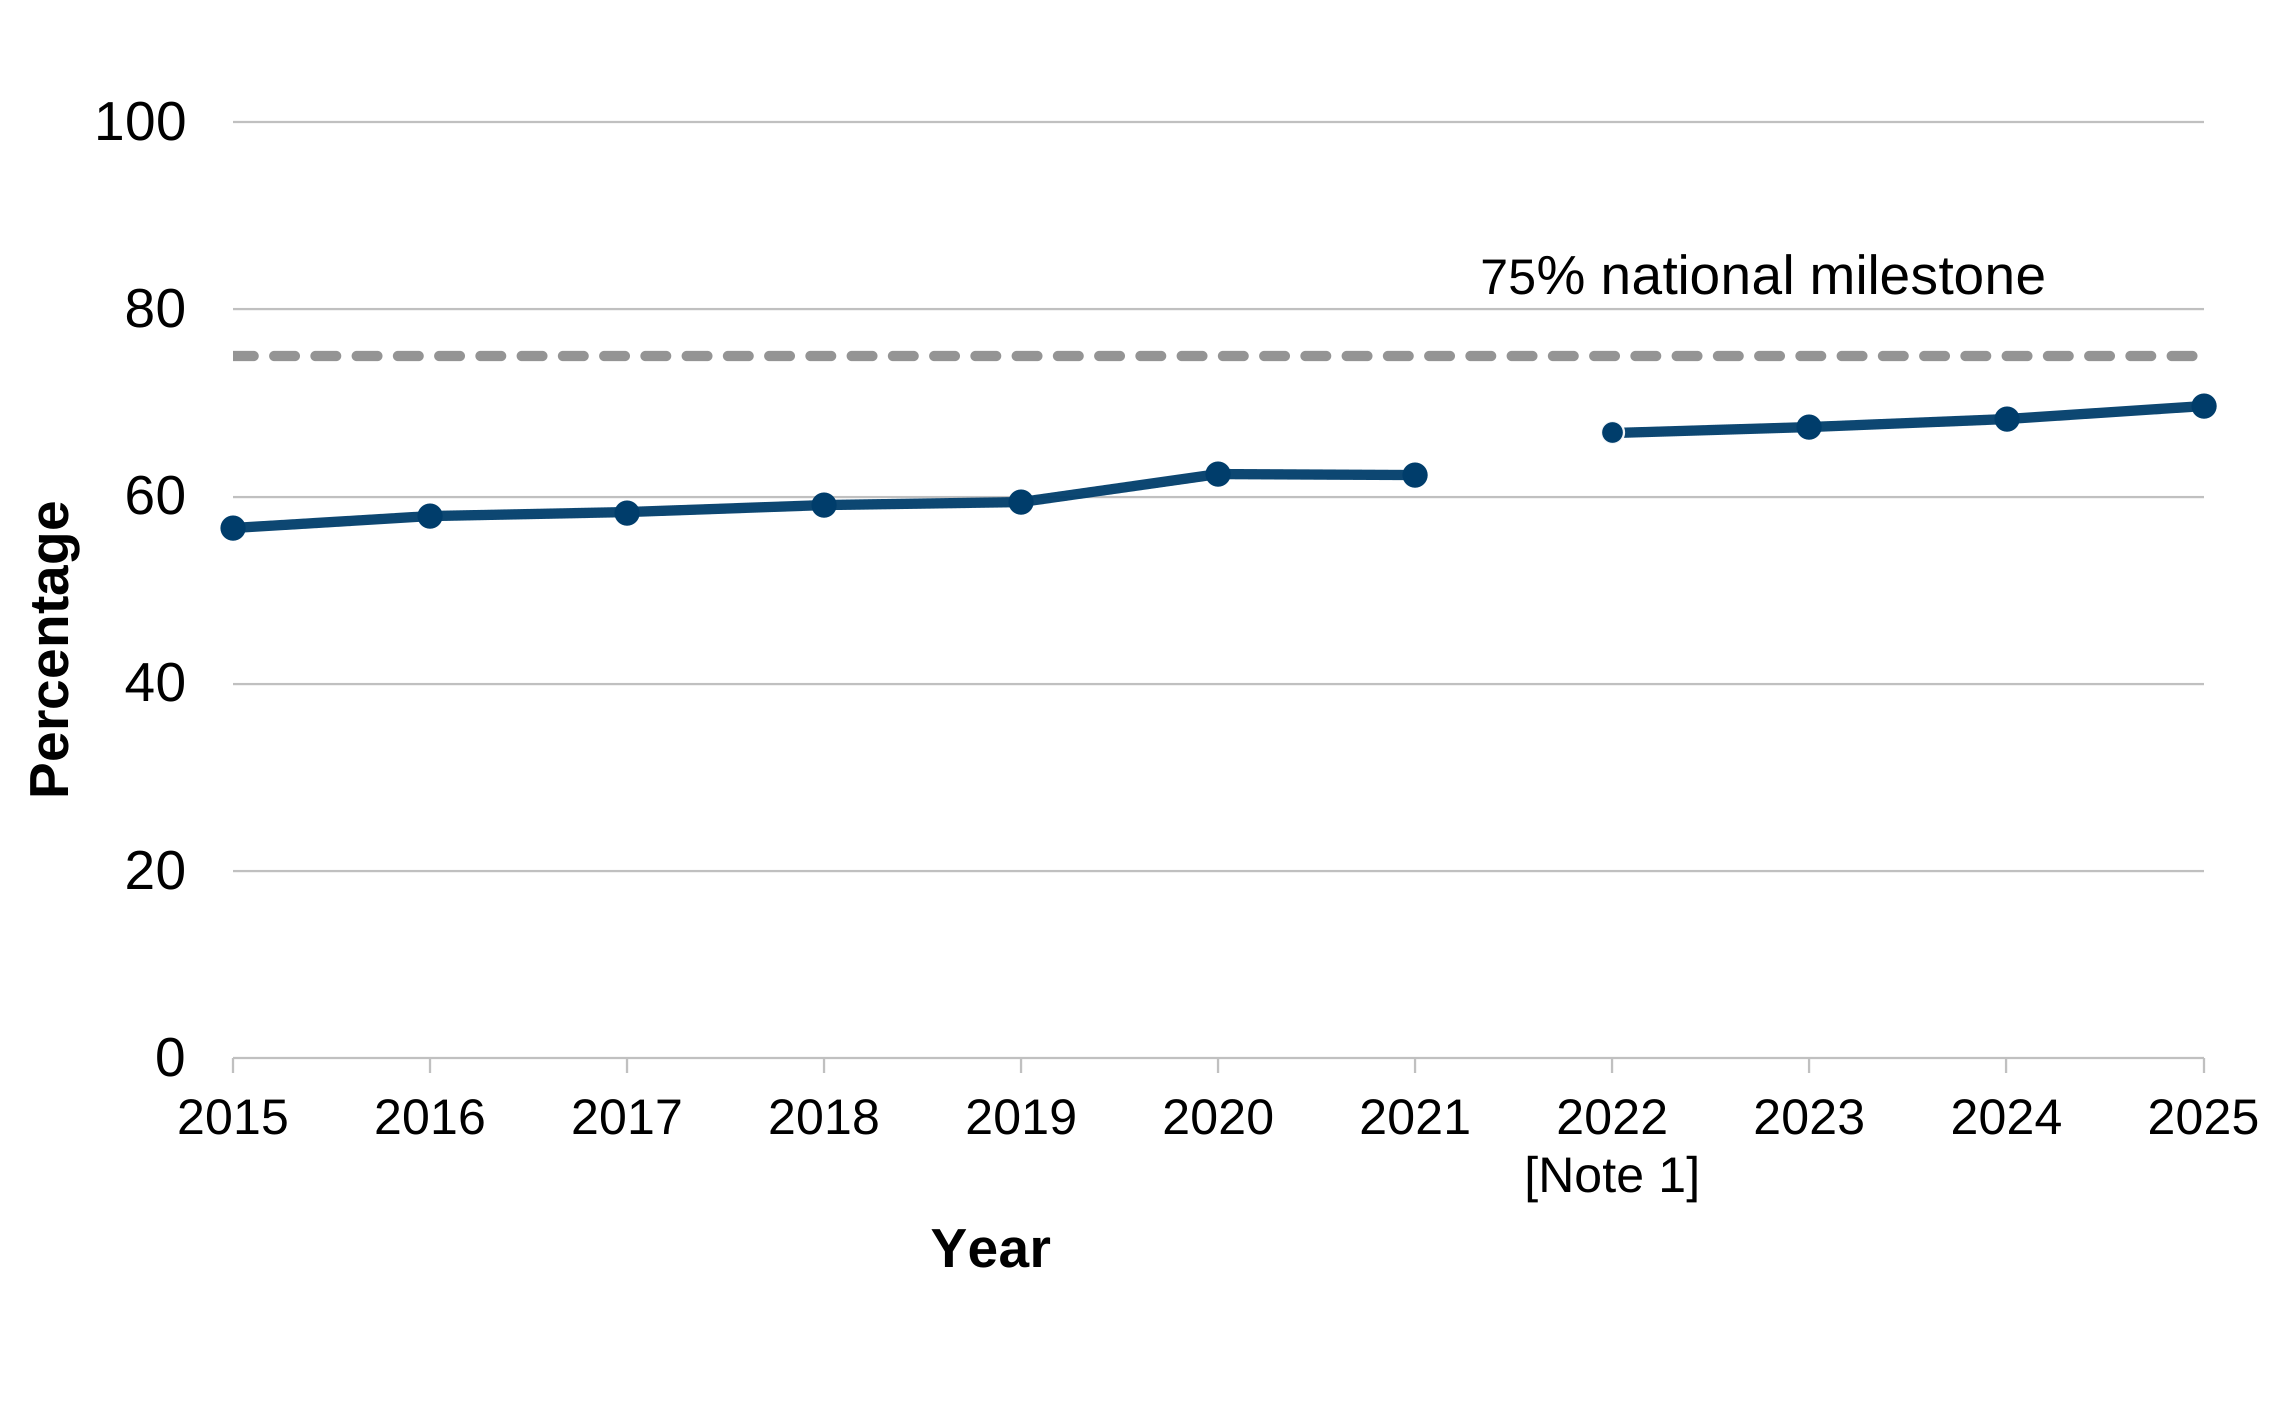
Description of figure 4: A line chart showing that an estimated 69.7% of working age adults in Wales were qualified to level 3 or higher in 2025. The survey question was updated in 2022 to reflect the new qualification framework, which has affected comparability compared to previous years. In 2015 an estimated 56.6% of working age adults were qualified to level 3 or higher according to the qualifications framework in place at that time.
Source: Welsh Government analysis of Annual Population Survey, Office for National Statistics
[Note 1] Estimates for 2022 onwards cannot be compared to previous years following changes to the questions on qualifications in the Annual Population Survey.
Working age adults with no qualifications
The percentage of working age adults with no qualifications will be 5% or below in every local authority in Wales by 2050.
Improved
Between 2015 and 2025.
Figure 5: proportion of working age adults with no qualification by local authority, 2025
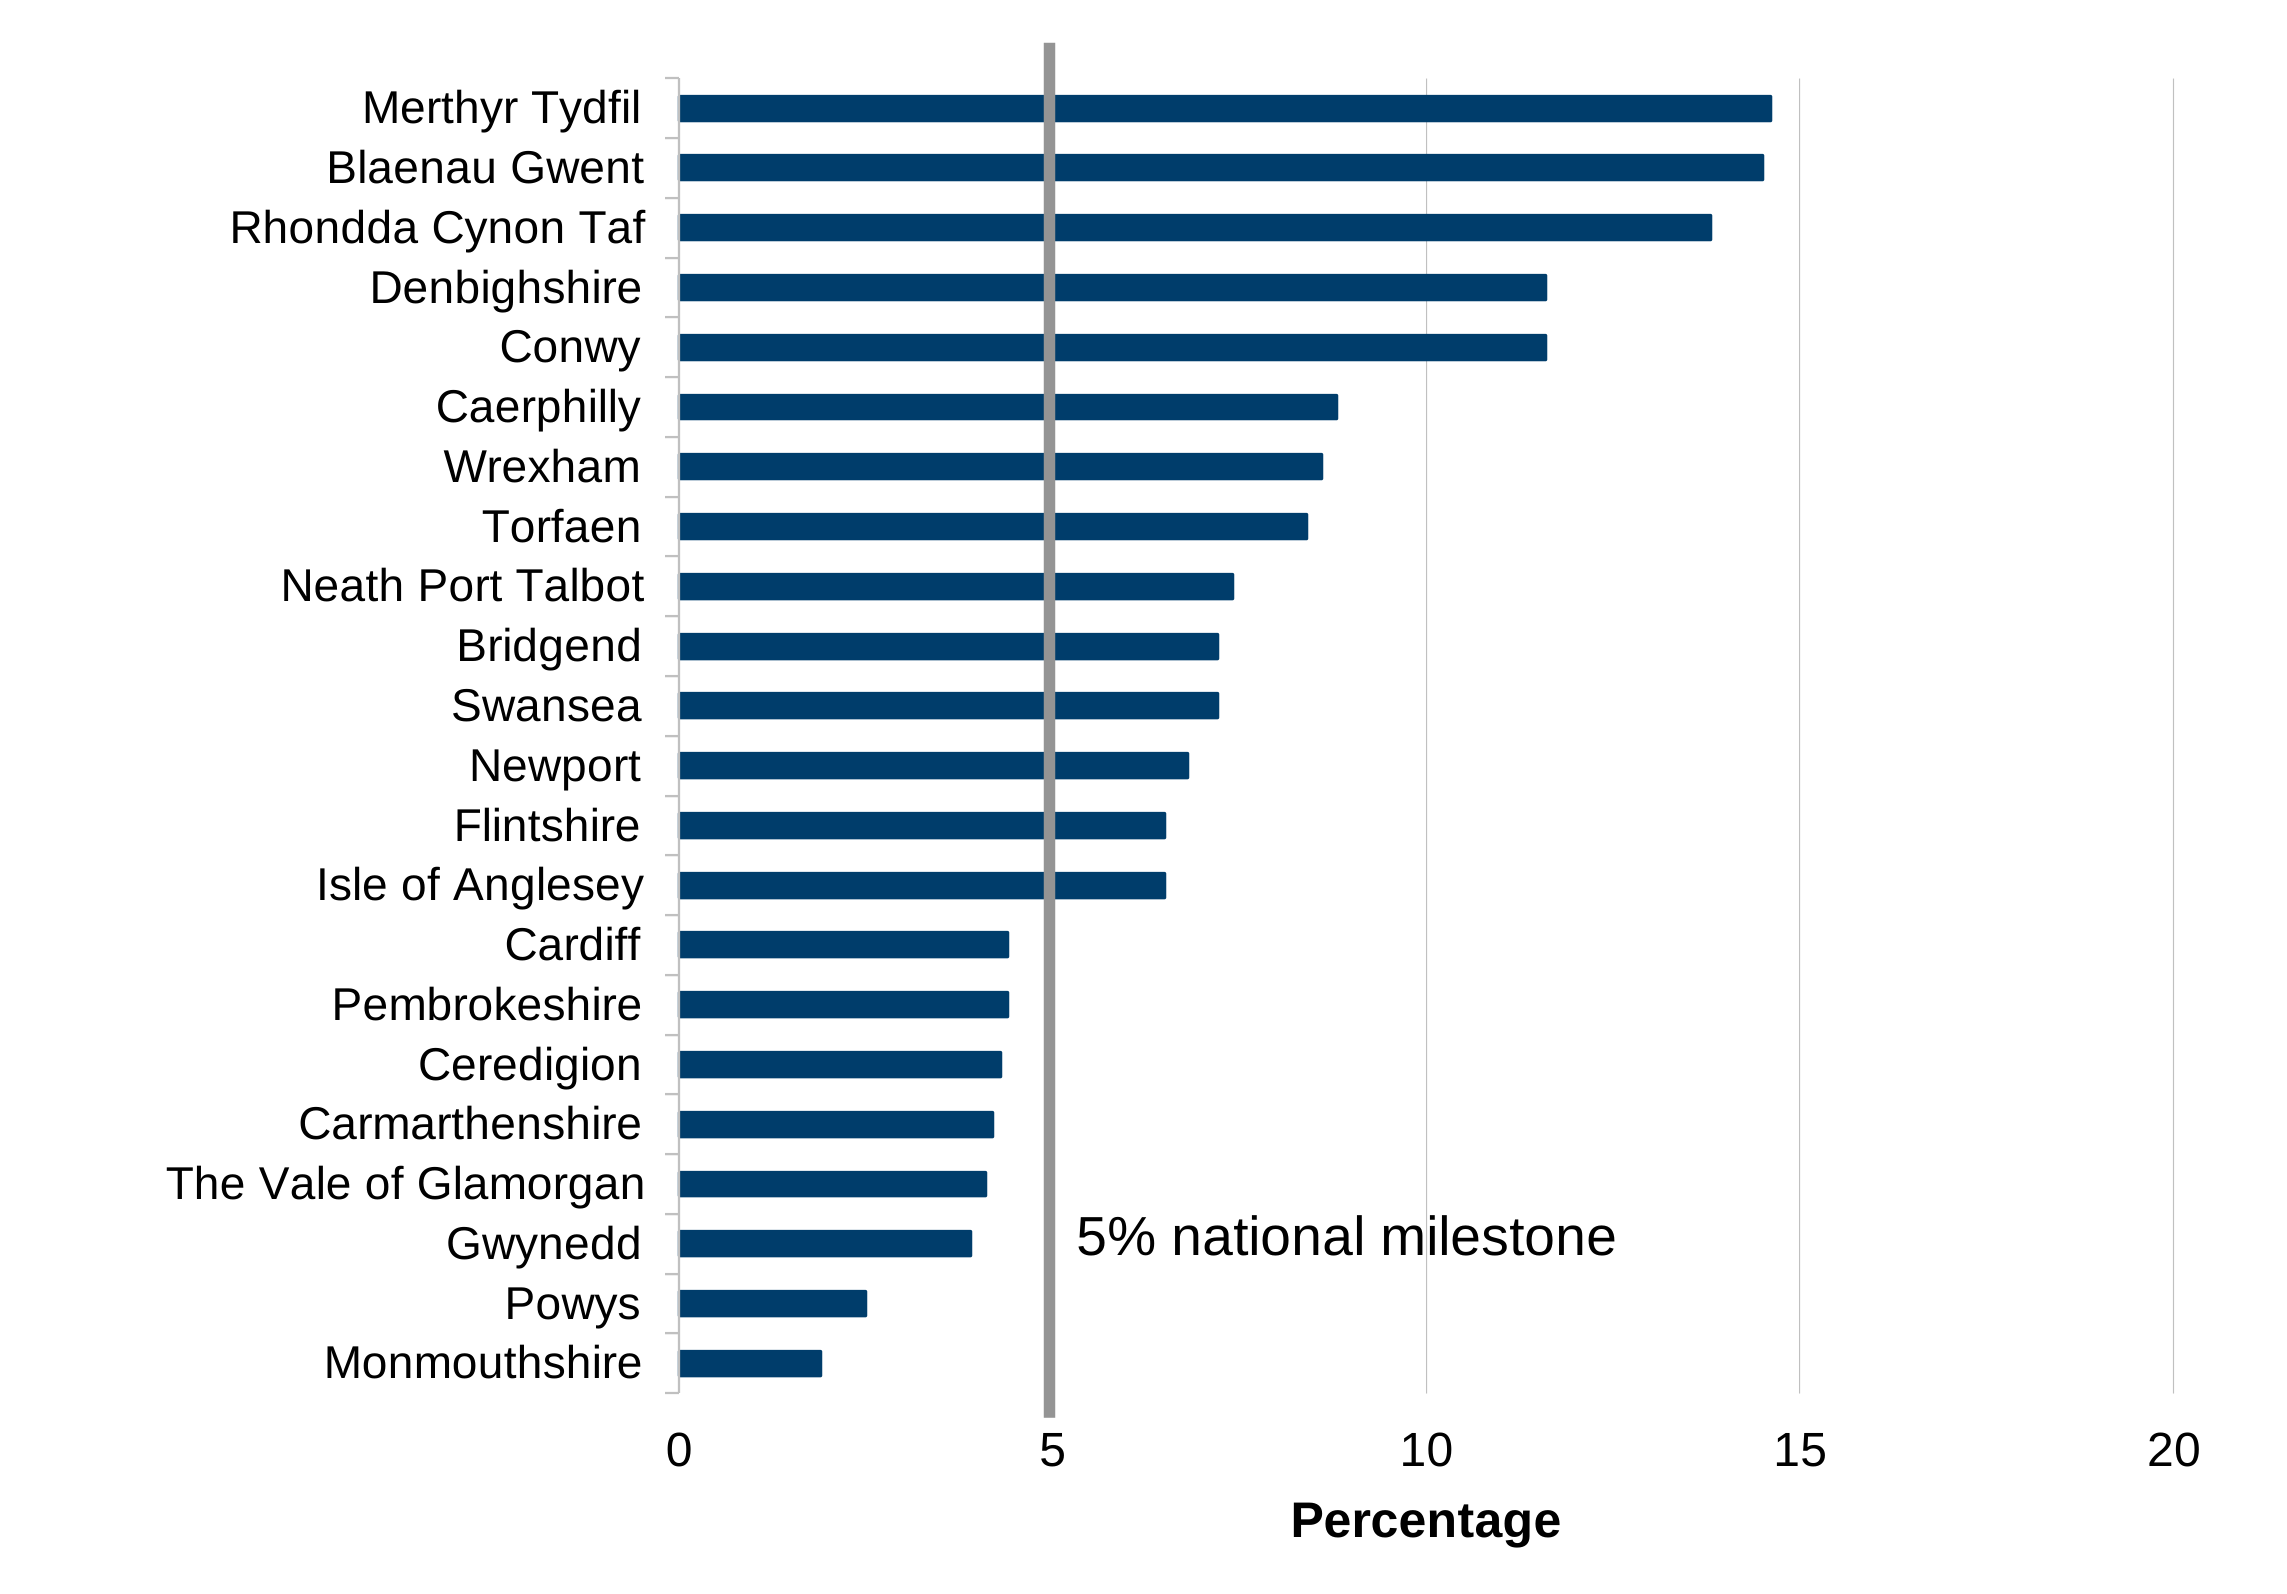
Description of figure 5: a bar chart showing that there are currently 8 local authorities where the percentage of working age adults with no qualifications is below 5%: Monmouthshire, Powys, Gwynedd, Vale of Glamorgan, Carmarthenshire, Ceredigion, Pembrokeshire and Cardiff. In 2015 there were none.
Source: Welsh Government analysis of Annual Population Survey, Office for National Statistics
Gross disposable household income
Improve gross disposable household income (GDHI) per head in Wales by 2035 and commit to setting a stretching growth target for 2050
Improved
Between 2015 and 2024.
Figure 6: GDHI per head in Wales, £ and index (UK = 100), 2015 to 2024
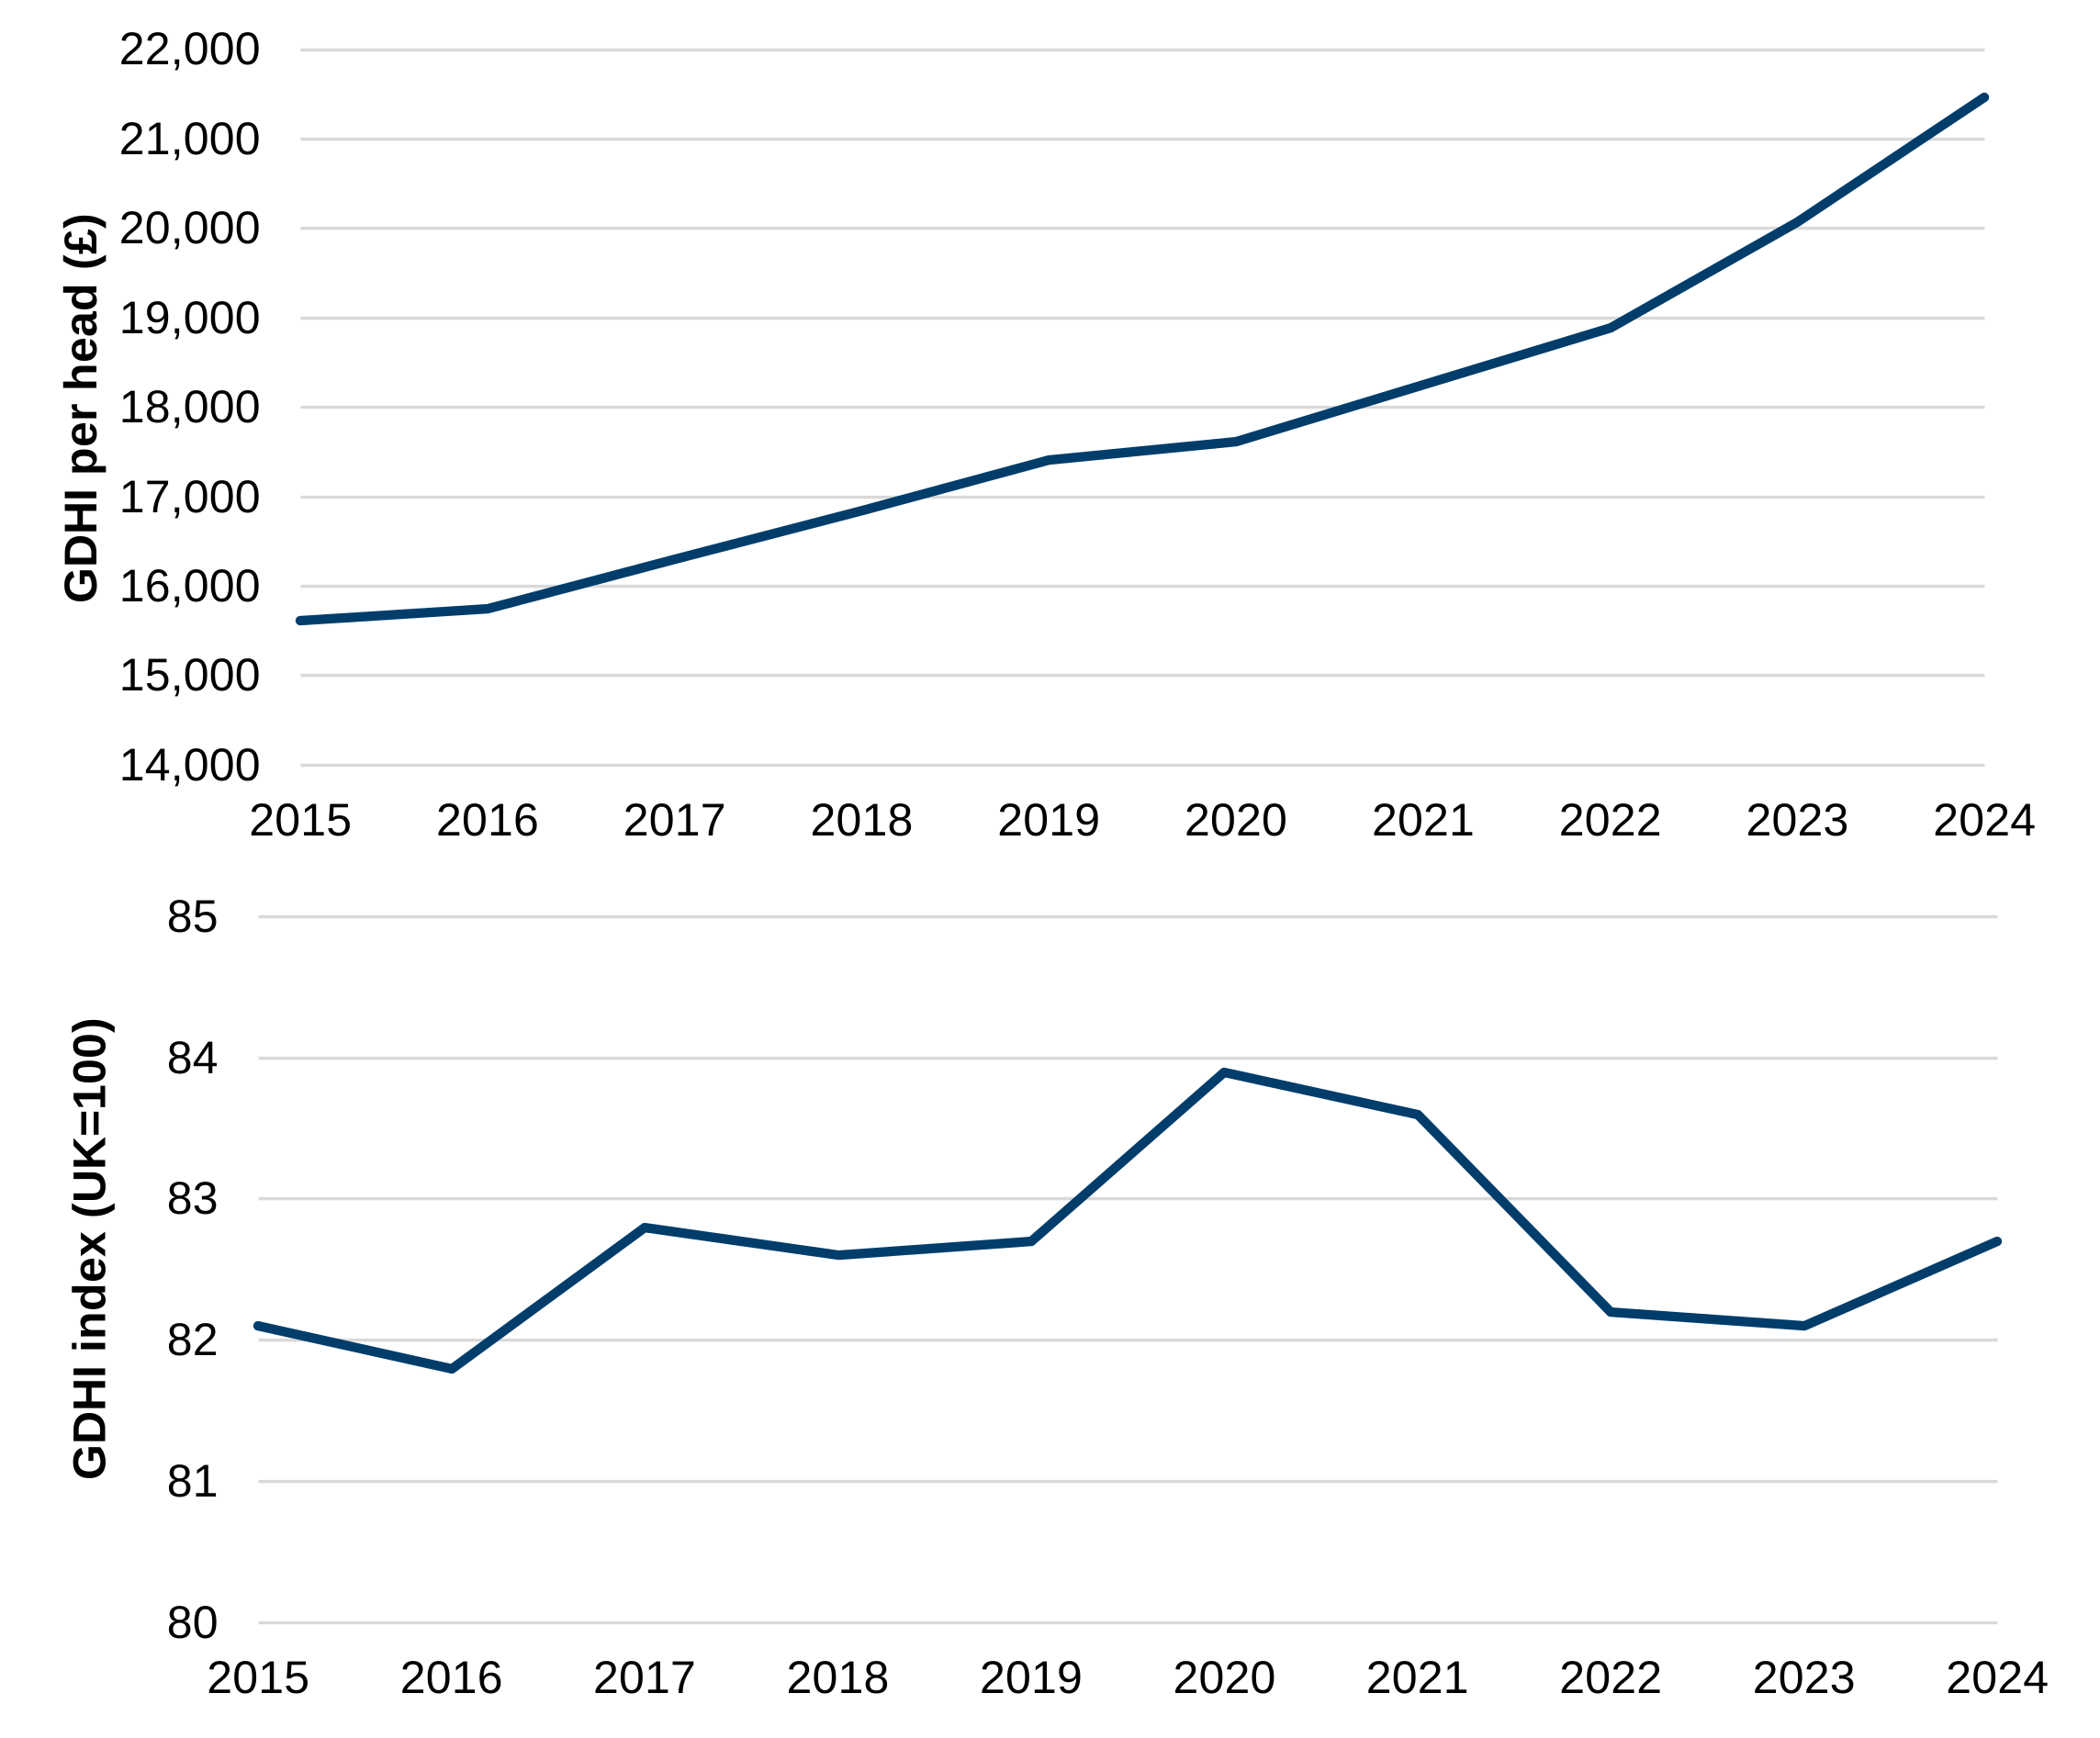
Description of figure 6: 2 line charts showing GDHI per head and GDHI index, relative to the UK. GDHI per head in Wales has increased in cash value over the period 2015 to 2024, from £15,600 in 2015 to £21,500 in 2024; an increase of 37.5%. This does not account for inflation over the period. However, GDHI per head relative to the UK (as shown by the index), which does account for inflation by looking at the relative change, has slightly increased over the period 2015 to 2024 from 82.1% to 82.7%.
Source: regional GDHI, regional accounts, ONS
Global footprint
Wales will use only its fair share of the world’s resources by 2050
Improved
Between 2014 and 2018.
Figure 7: global footprint (gha) per person, 2014 to 2018
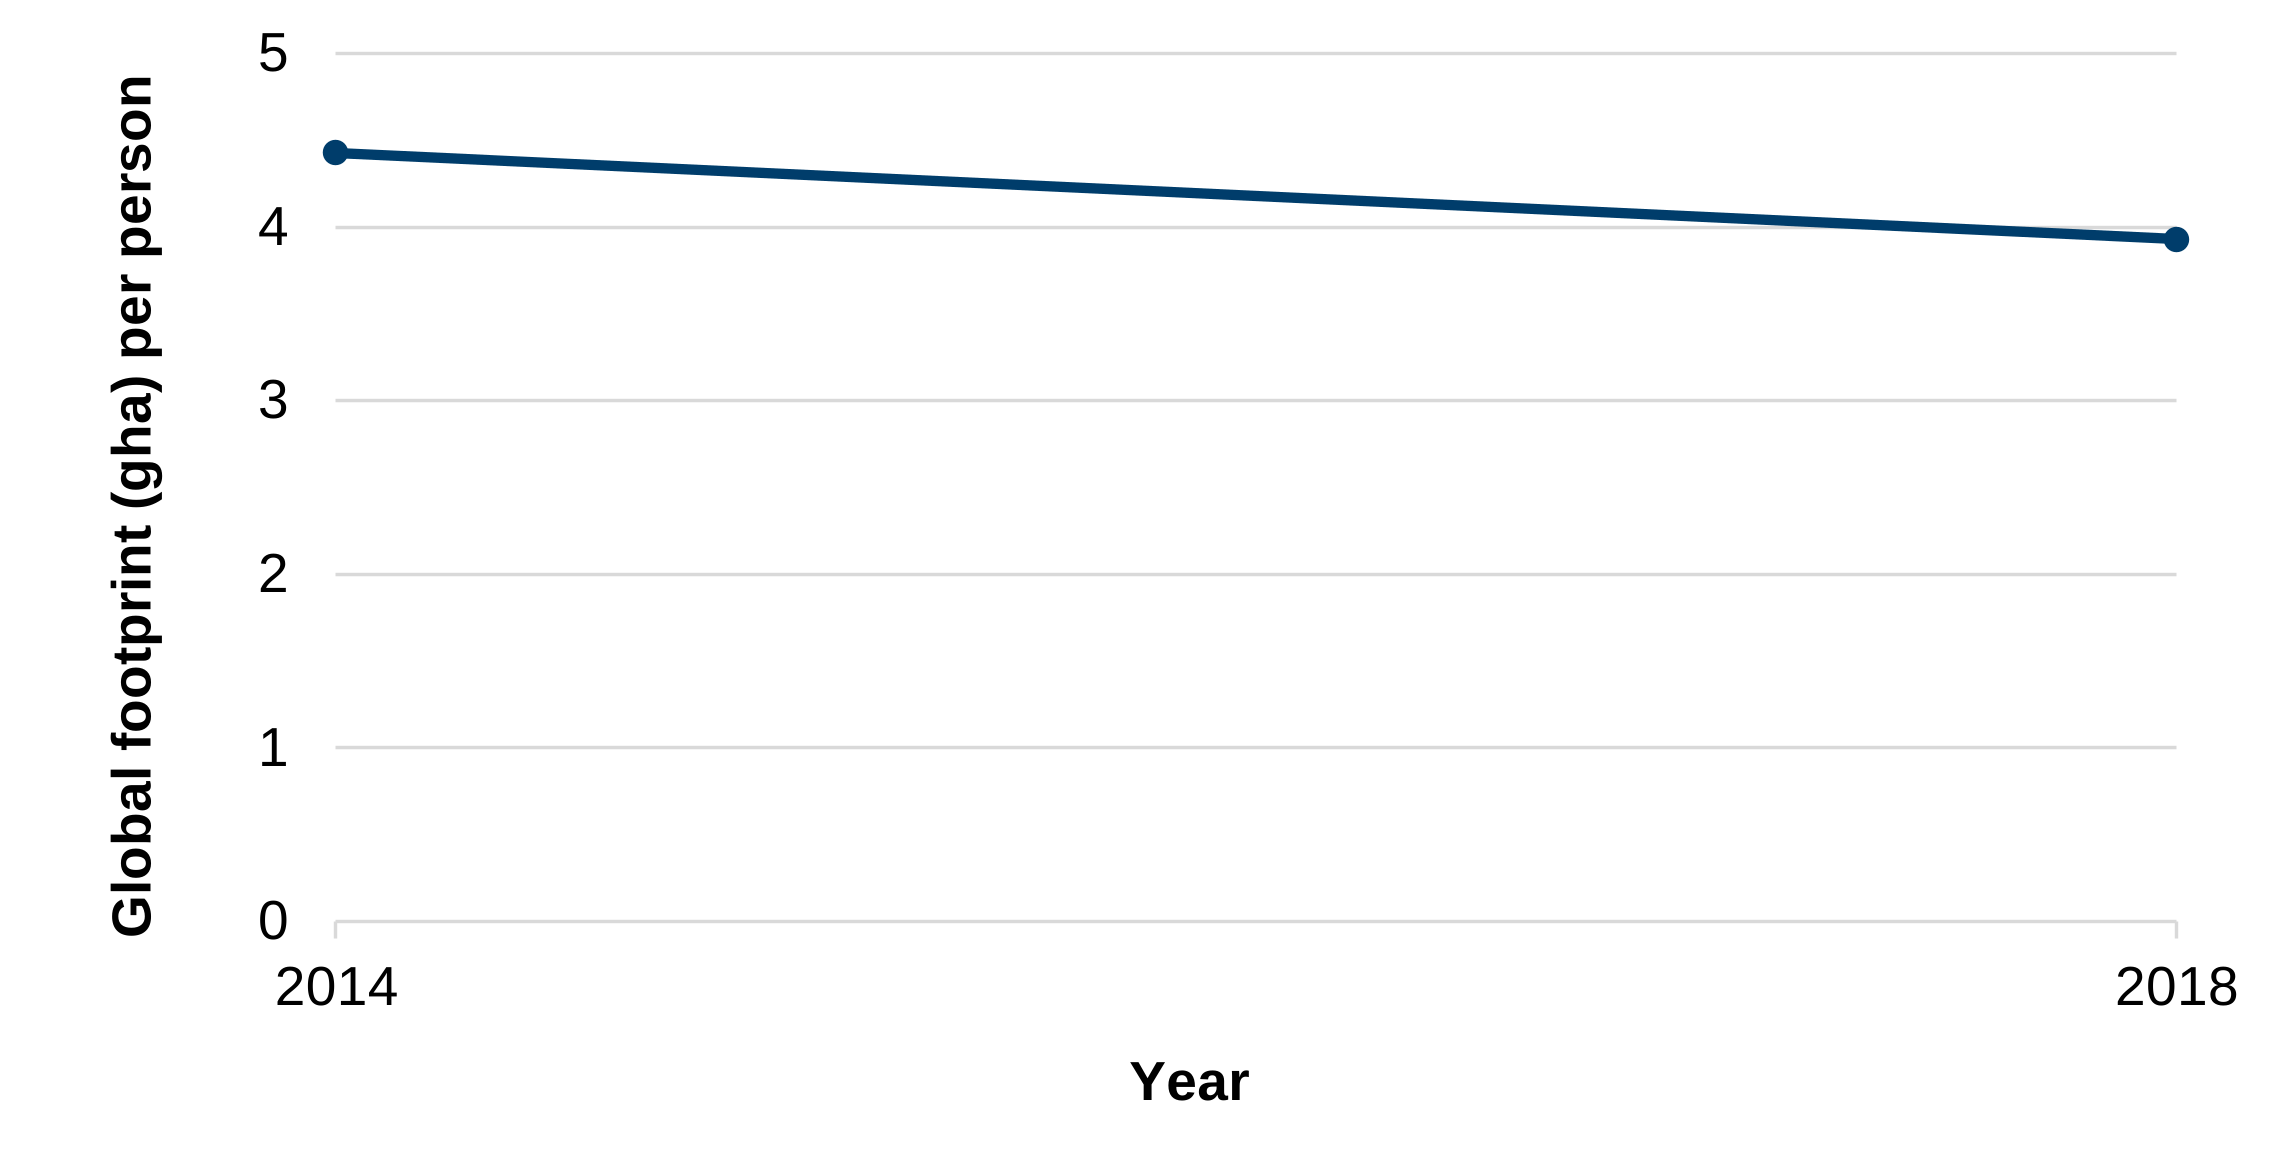
Description of figure 7: a line chart showing that the global footprint per person has reduced by 11% between 2014 and 2018. The global footprint per person was 3.9 gha per person in 2018, compared to 4.4 gha per person in 2014.
Source: understanding the global environmental footprint and impacts of Welsh consumption, JNCC
Pay equality
An elimination of the pay gap for gender, disability and ethnicity by 2050
Gender pay gap
Improved between 2015 and 2025.
Disability pay gap
No change between 2015 and 2025.
Ethnicity pay gap
No change between 2015 and 2025.
Figure 8: gender pay difference in Wales (median hourly earnings full-time employees excluding overtime), April 2015 to April 2025
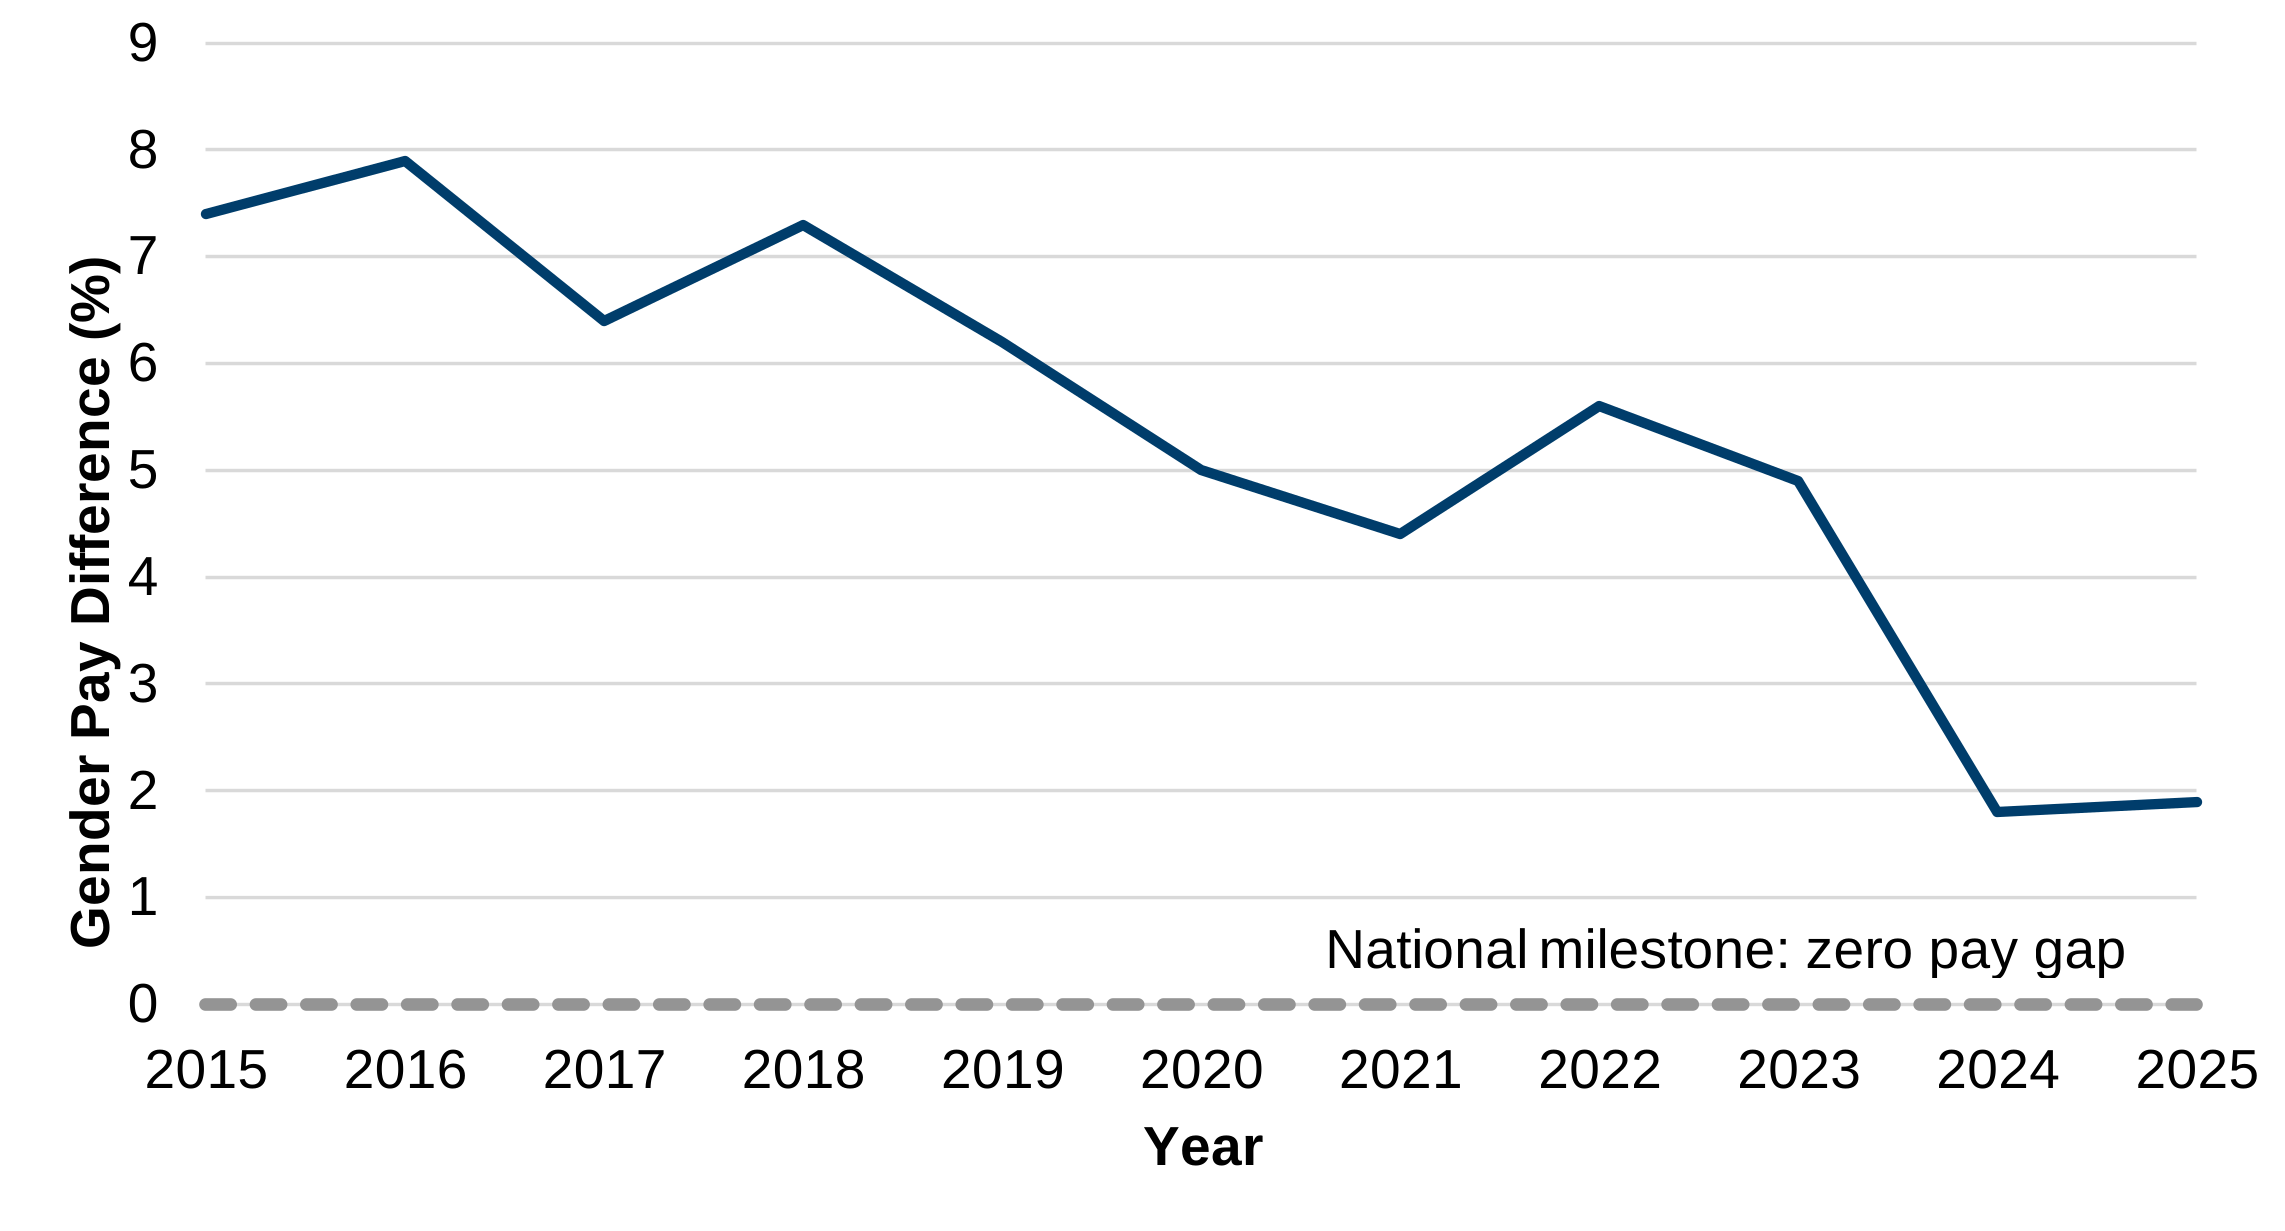
Description of figure 8: a line chart showing that since April 2015 the gender pay gap on a median hourly full-time basis (excluding overtime) has narrowed, from 7.4% to 1.9% in April 2025.
Source: Welsh Government analysis of the annual survey of hours and earnings (ASHE).
Figure 9: ethnicity and disability pay differences in Wales (median hourly earnings, all employees), year ending December 2015 to December 2025
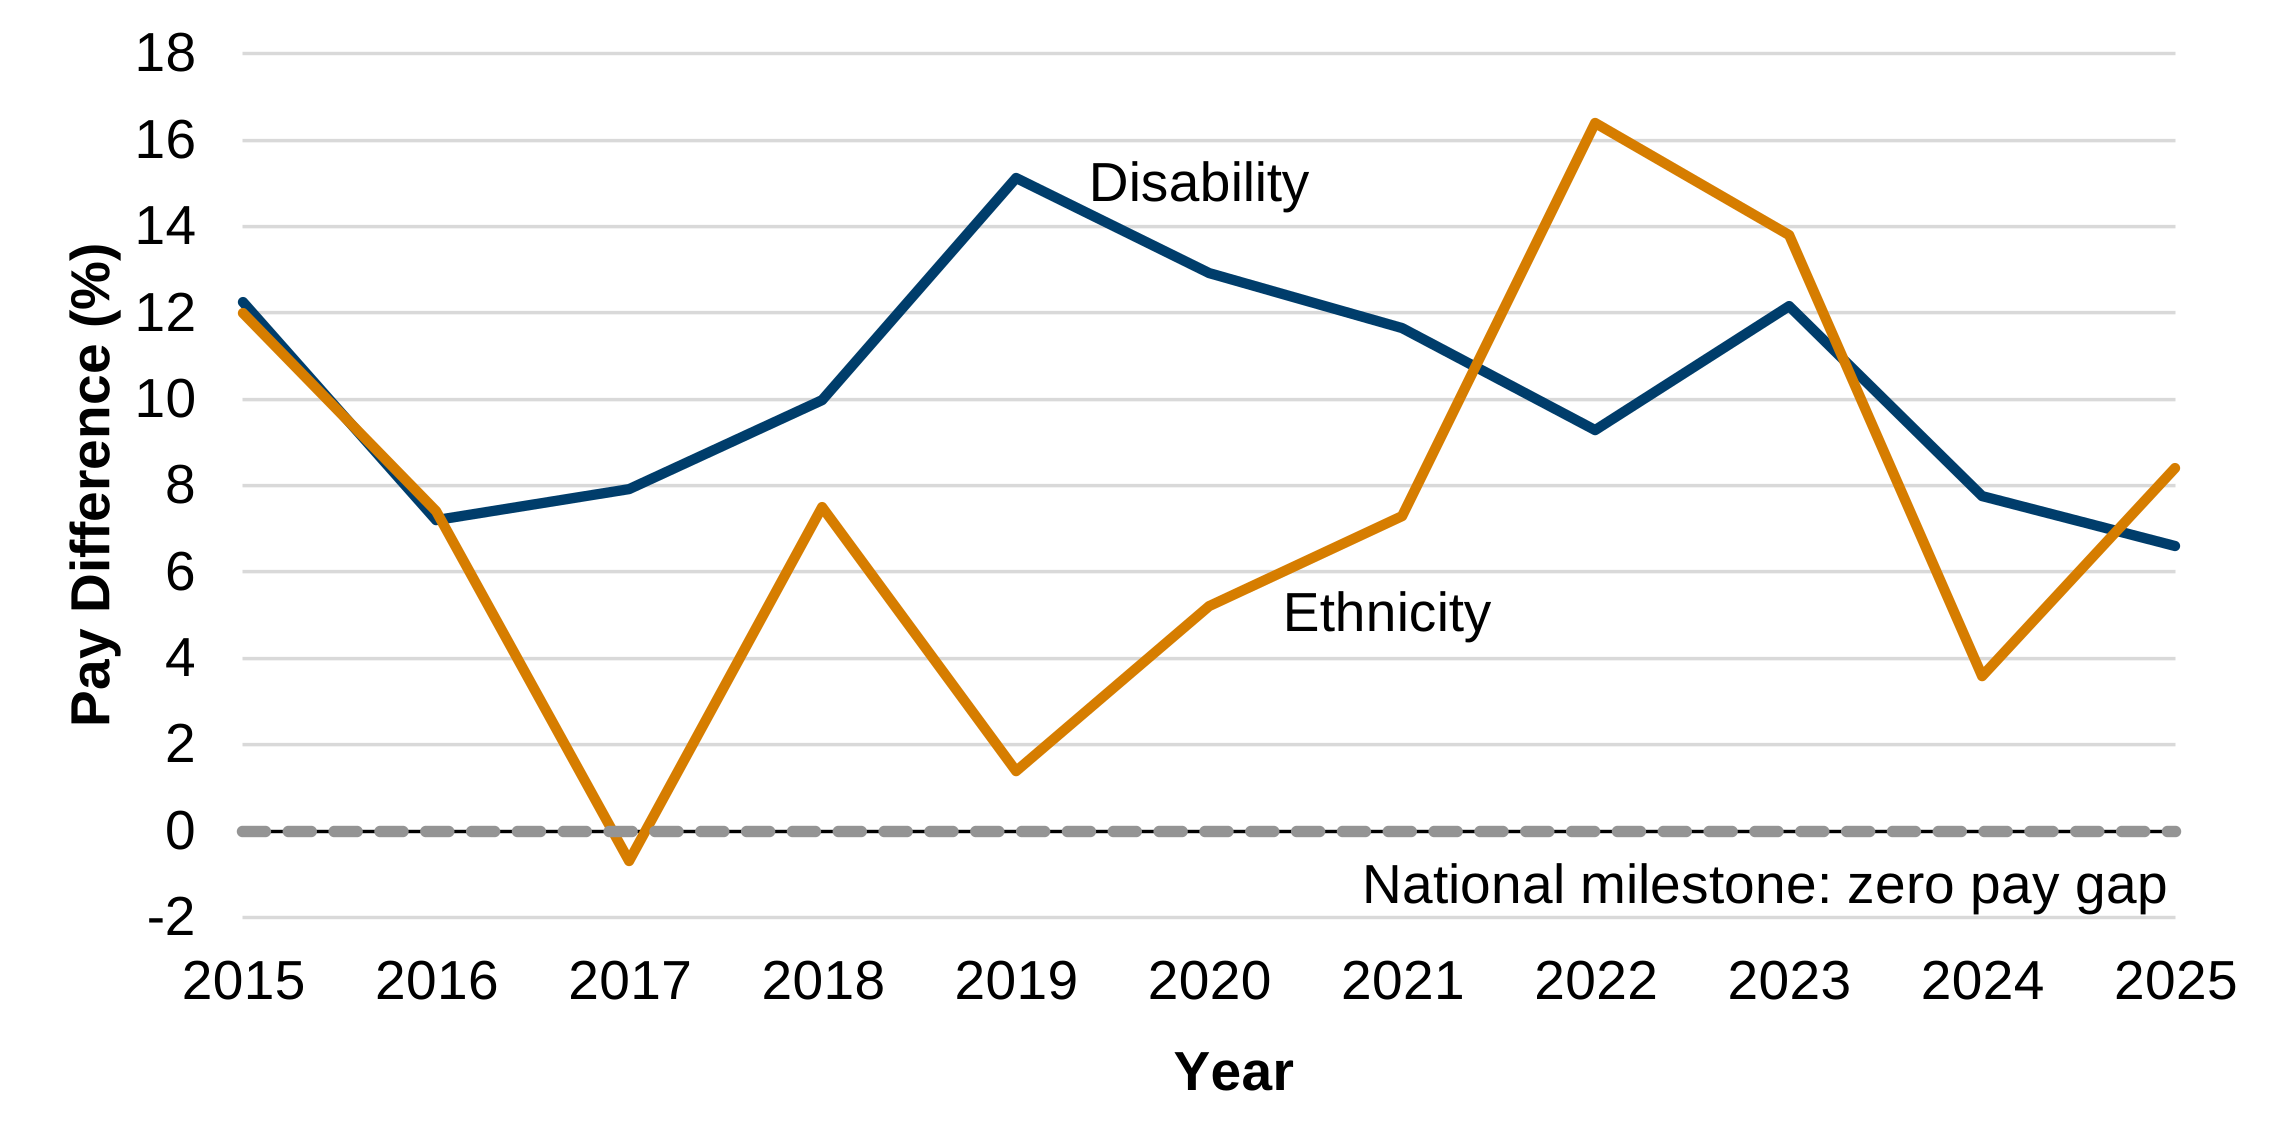
Description of figure 9: a line chart showing that ethnicity and disability pay gaps have been volatile over the period since 2015. The ethnicity pay gap decreased from 12.0% in 2015 to 1.4% in 2019 but then rose to 16.4% in 2022, it has since declined to 8.4% in 2025. The disability pay gap rose from 12.2% in 2015 to a high of 15.1% in 2019 but has decreased to 6.6% in 2025. The change between 2015 and 2025 is not statistically significant for ethnicity or disability.
Source: Welsh Government analysis of the Annual Population Survey.
Ethnicity pay difference estimates cover those aged 16+, whereas disability pay difference estimates cover those aged 16 to 64.
Poverty
Reduce the poverty gap between people in Wales with certain important and protected characteristics (which mean they are most likely to be in poverty) and those without those characteristics by 2035. Commit to setting a stretching target for 2050.
The characteristics included in the scope of this milestone have not yet been agreed. In the interim, this report concentrates on differences between broad age groups.
No change
Between the 3-year financial periods ending 2015 and 2025.
Figure 10: percentage of broad age groups living in relative income poverty (after housing costs), 3-financial-year averages, between 2013 to 2015 and 2023 to 2025 [Note 1]
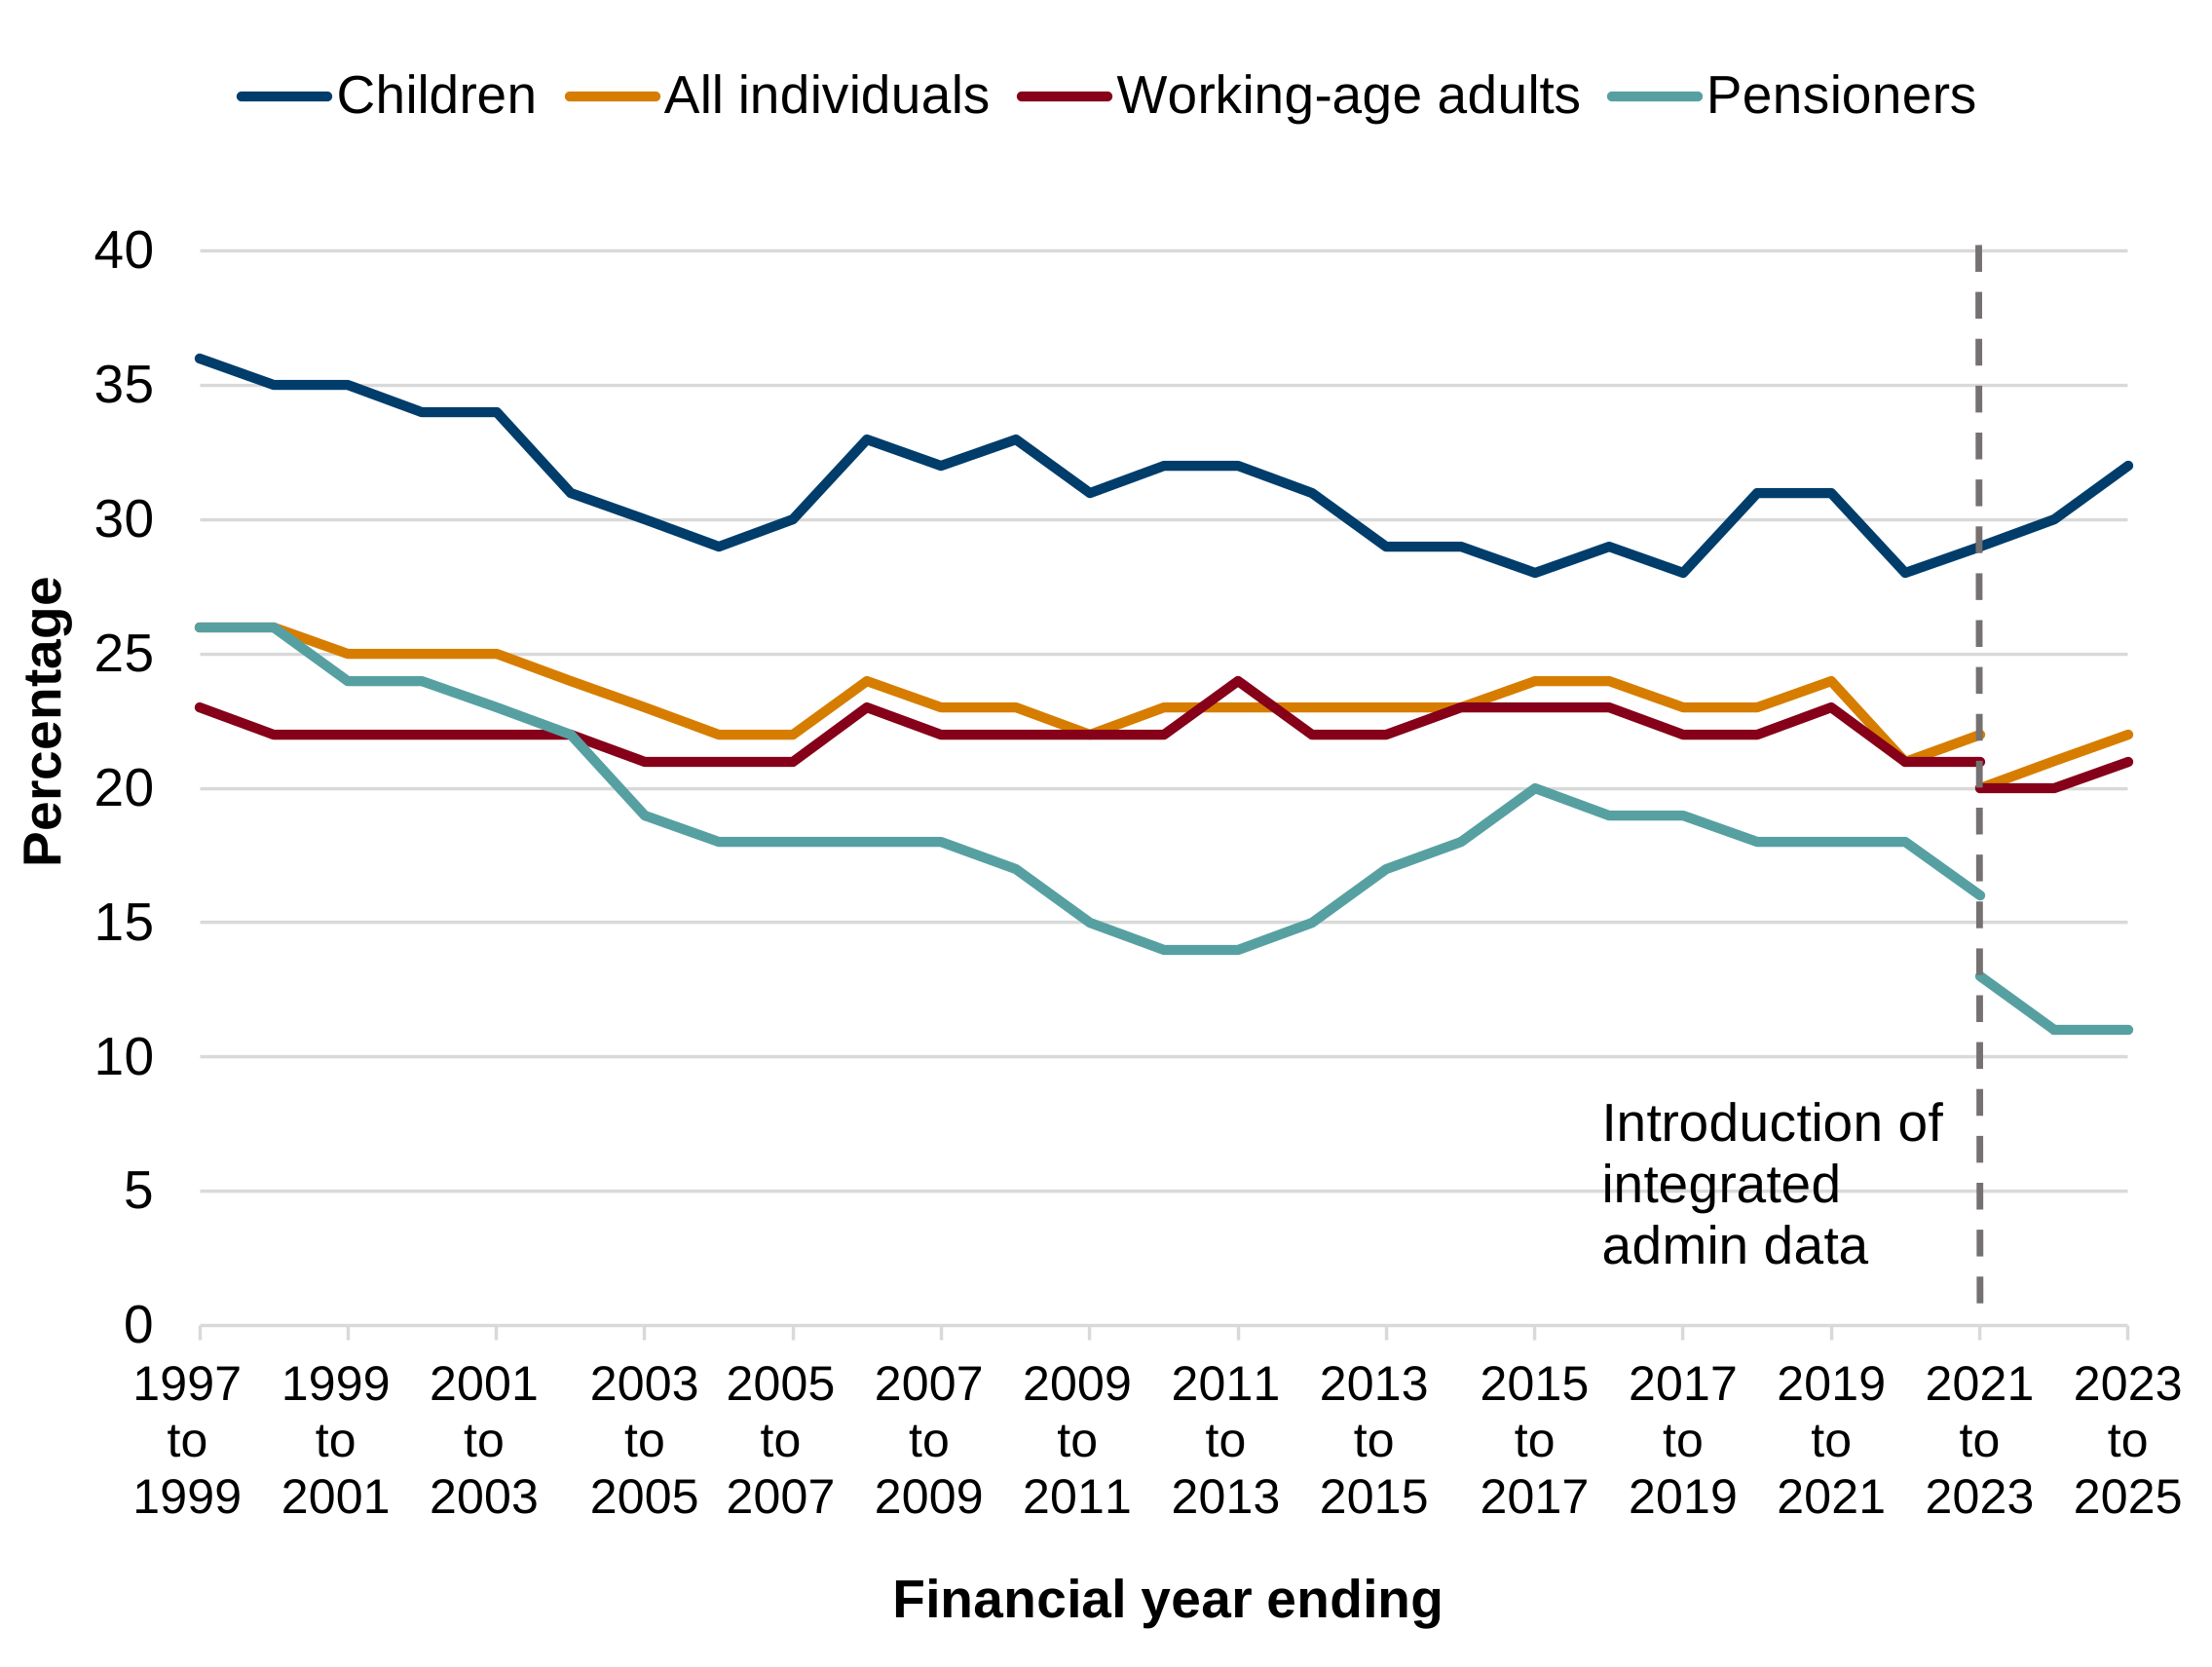
Description of figure 10: a line chart showing, children are consistently the age group most likely to be in relative income poverty. 32% of children were in relative income poverty in the three-year period to March 2025. The gap between the percentage of children in poverty and the whole population in the 3-year period to March 2025 was 10 percentage points, compared to 9 percentage points in the period to March 2023.
[Note 1] Some low income measures after 2021 to 2023 have changed, creating a break in the data series from 2022. As such users should not make direct comparisons with previous years.
Source: relative income poverty
Employment
Eradicate the gap between the employment rate in Wales and the UK by 2050, with a focus on fair work and raising labour market participation of under-represented groups.
Deteriorated
Between year ending March 2016 and year ending March 2026.
Figure 11: employment rate for people aged 16 to 64, UK and Wales, year ending March 2016 to March 2026
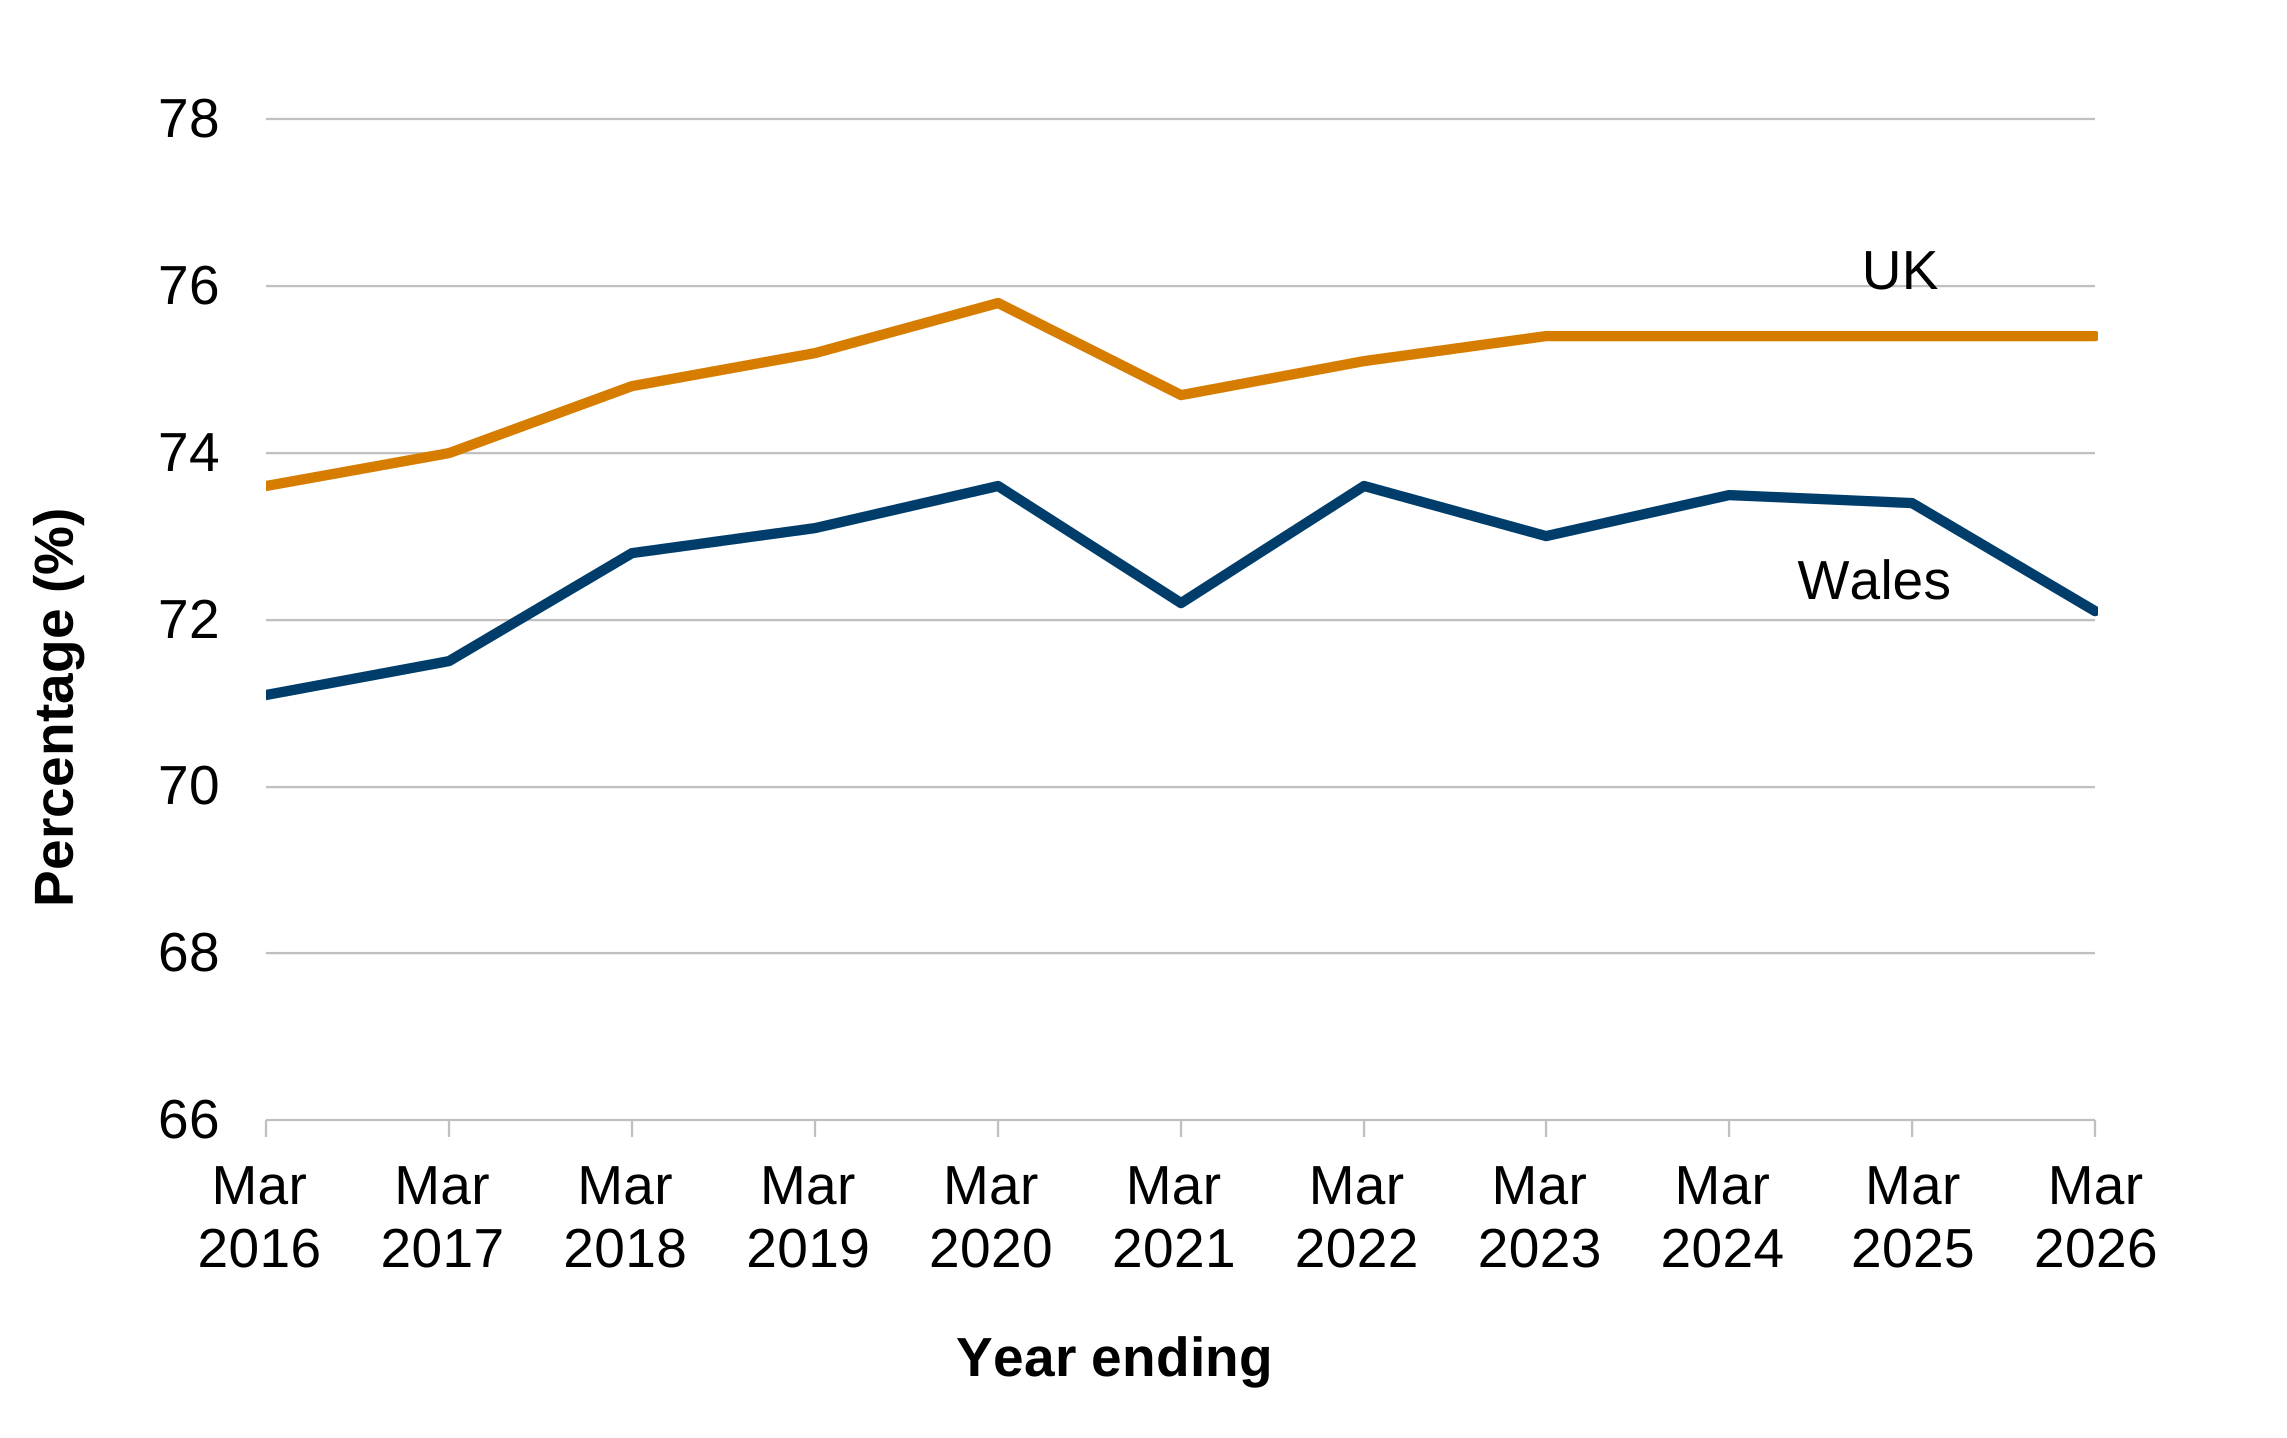
Description of figure 11: a line chart showing that the employment rate gap between Wales and the UK has fluctuated since the year ending March 2016, however the gap has increased overall.
The employment rate gap between Wales and the UK has fluctuated between the years ending March 2016 and March 2026, however has increased overall from 2.5 to 3.3 percentage points over this period.
Source: Welsh Government analysis of the APS.
Young people in education, employment or training
At least 90% of 16 to 24 year olds will be in education, employment, or training by 2050.
Improved
Between 2015 and 2024.
Figure 12: participation of young people in education and the labour market by age group, Wales, 2015 to 2024
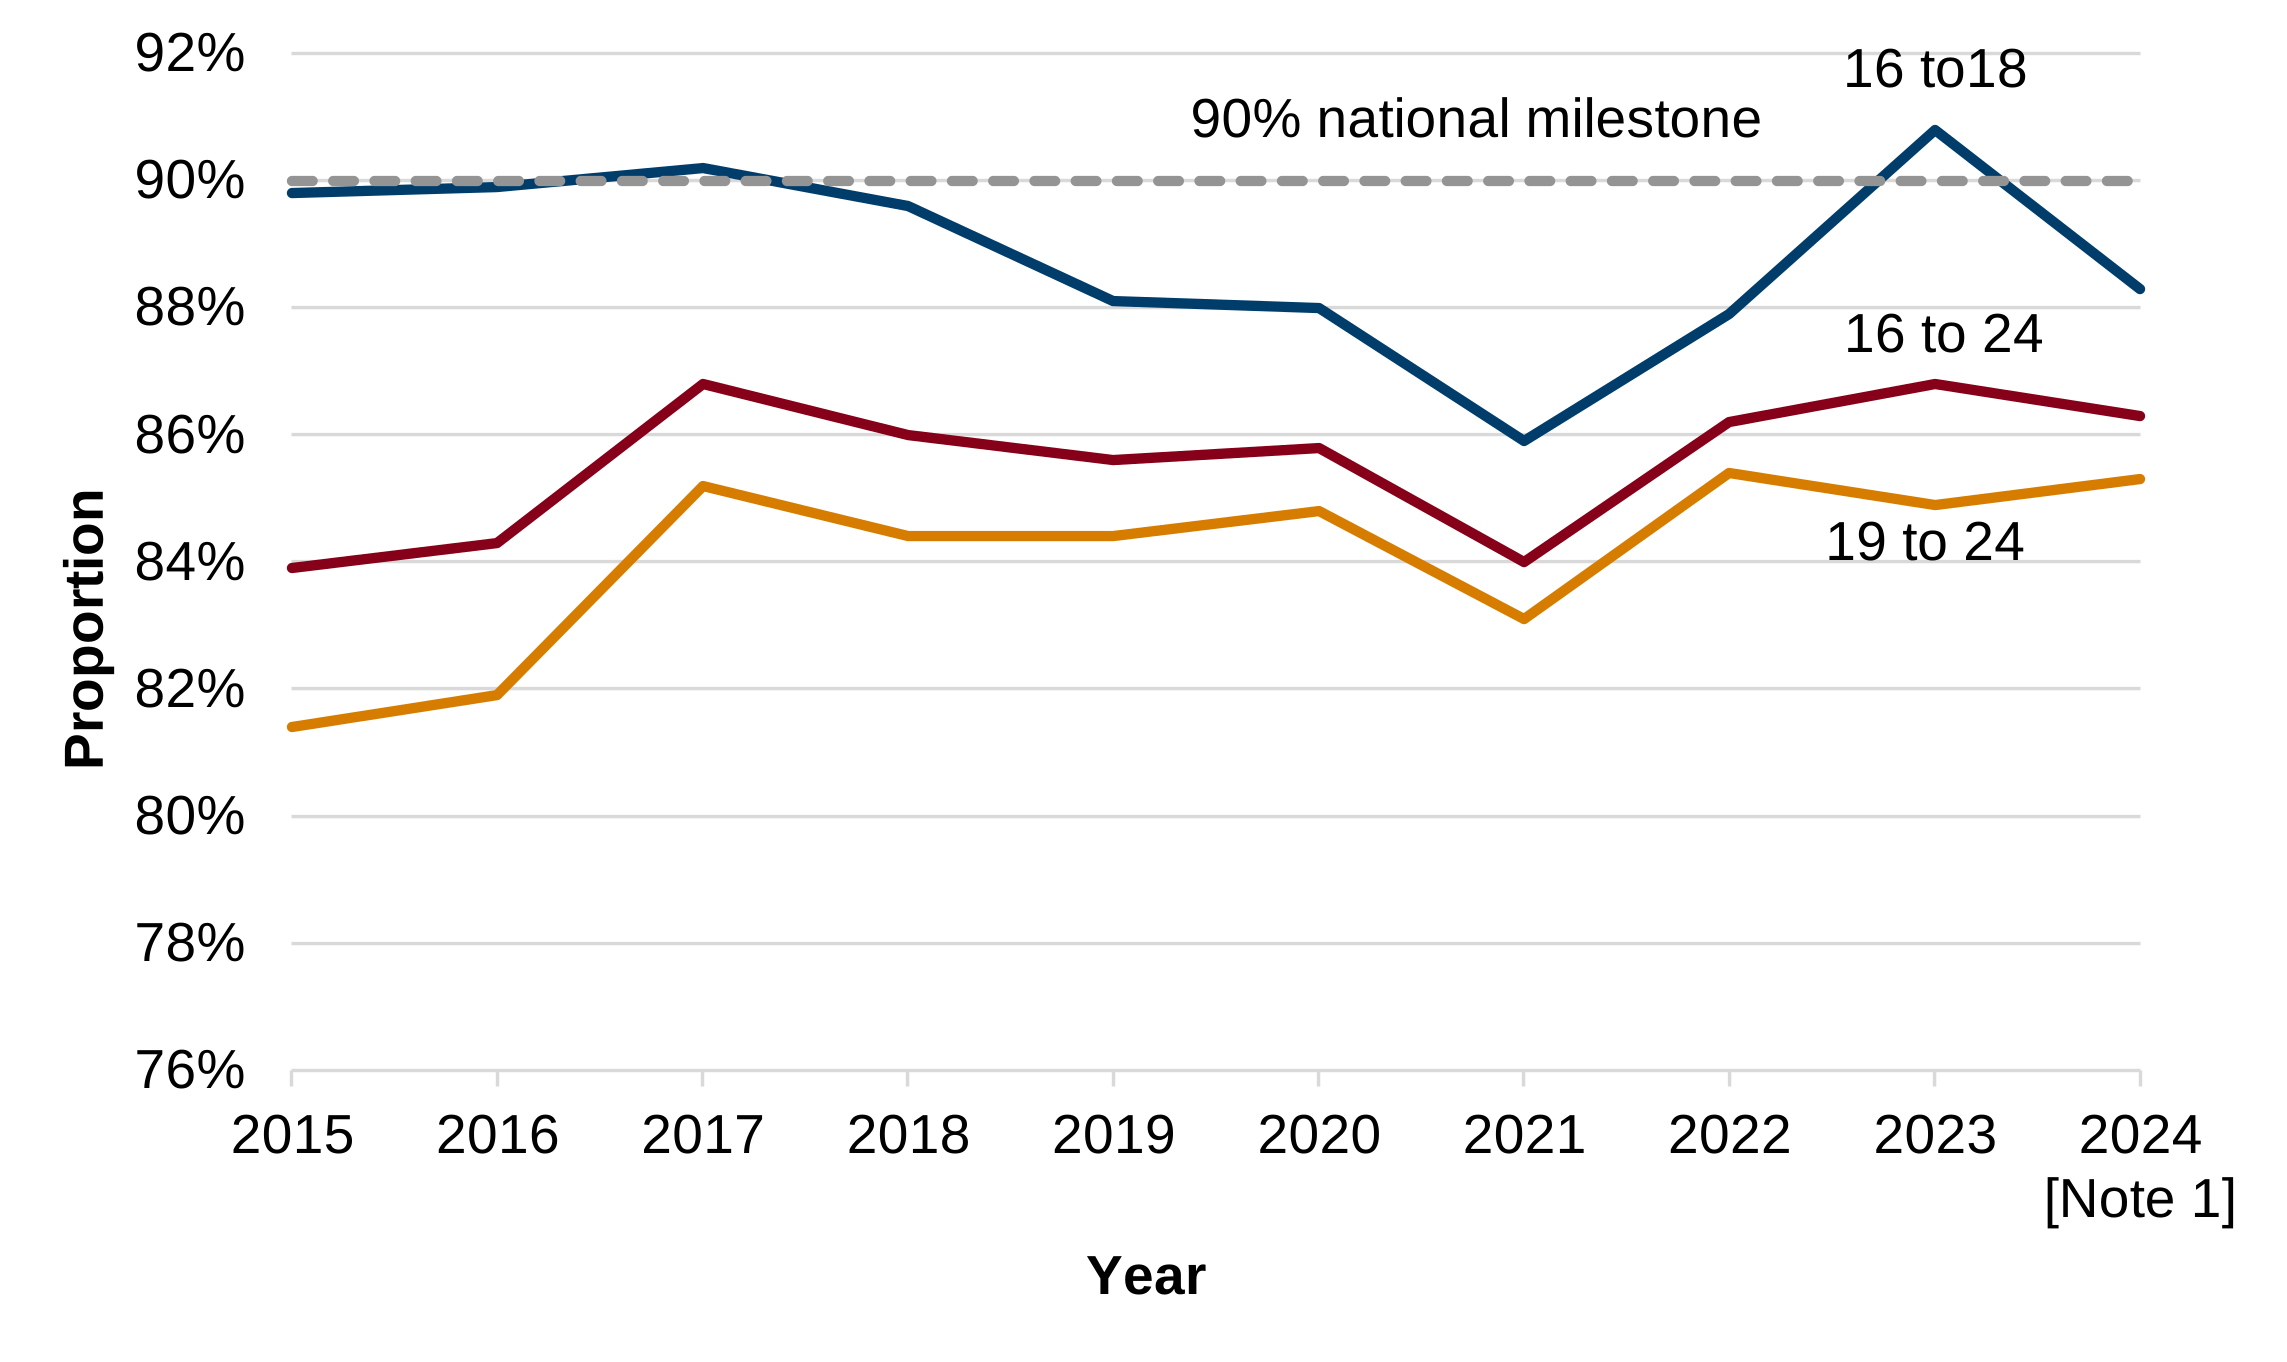
Description of figure 12: a line chart showing that the proportion of 16 to 24 year olds in employment, education or training has fluctuated between 2015 and 2024, however it has improved overall.
Provisional estimates show that 86.3% of 16 to 24 year olds were in education, employment or training in 2024, up from 83.9% in 2015. The proportion of young people in education, employment of training decreased for the 16 to 18 age group (from 89.8% to 88.3%) however increased for the 19 to 24 age group (from 81.4% to 85.3%).
Source: Welsh Government, Open University and HEFCW.
[Note 1]: figures for 2024 are provisional.
Volunteering
Increase the percentage of people who volunteer by 10% by 2050, demonstrating Wales’s status as a volunteering nation.
Improved
Between year ending March 2017 and year ending March 2025.
Figure 13: percentage of people volunteering, between financial year 2016 to 2017 and 2024 to 2025
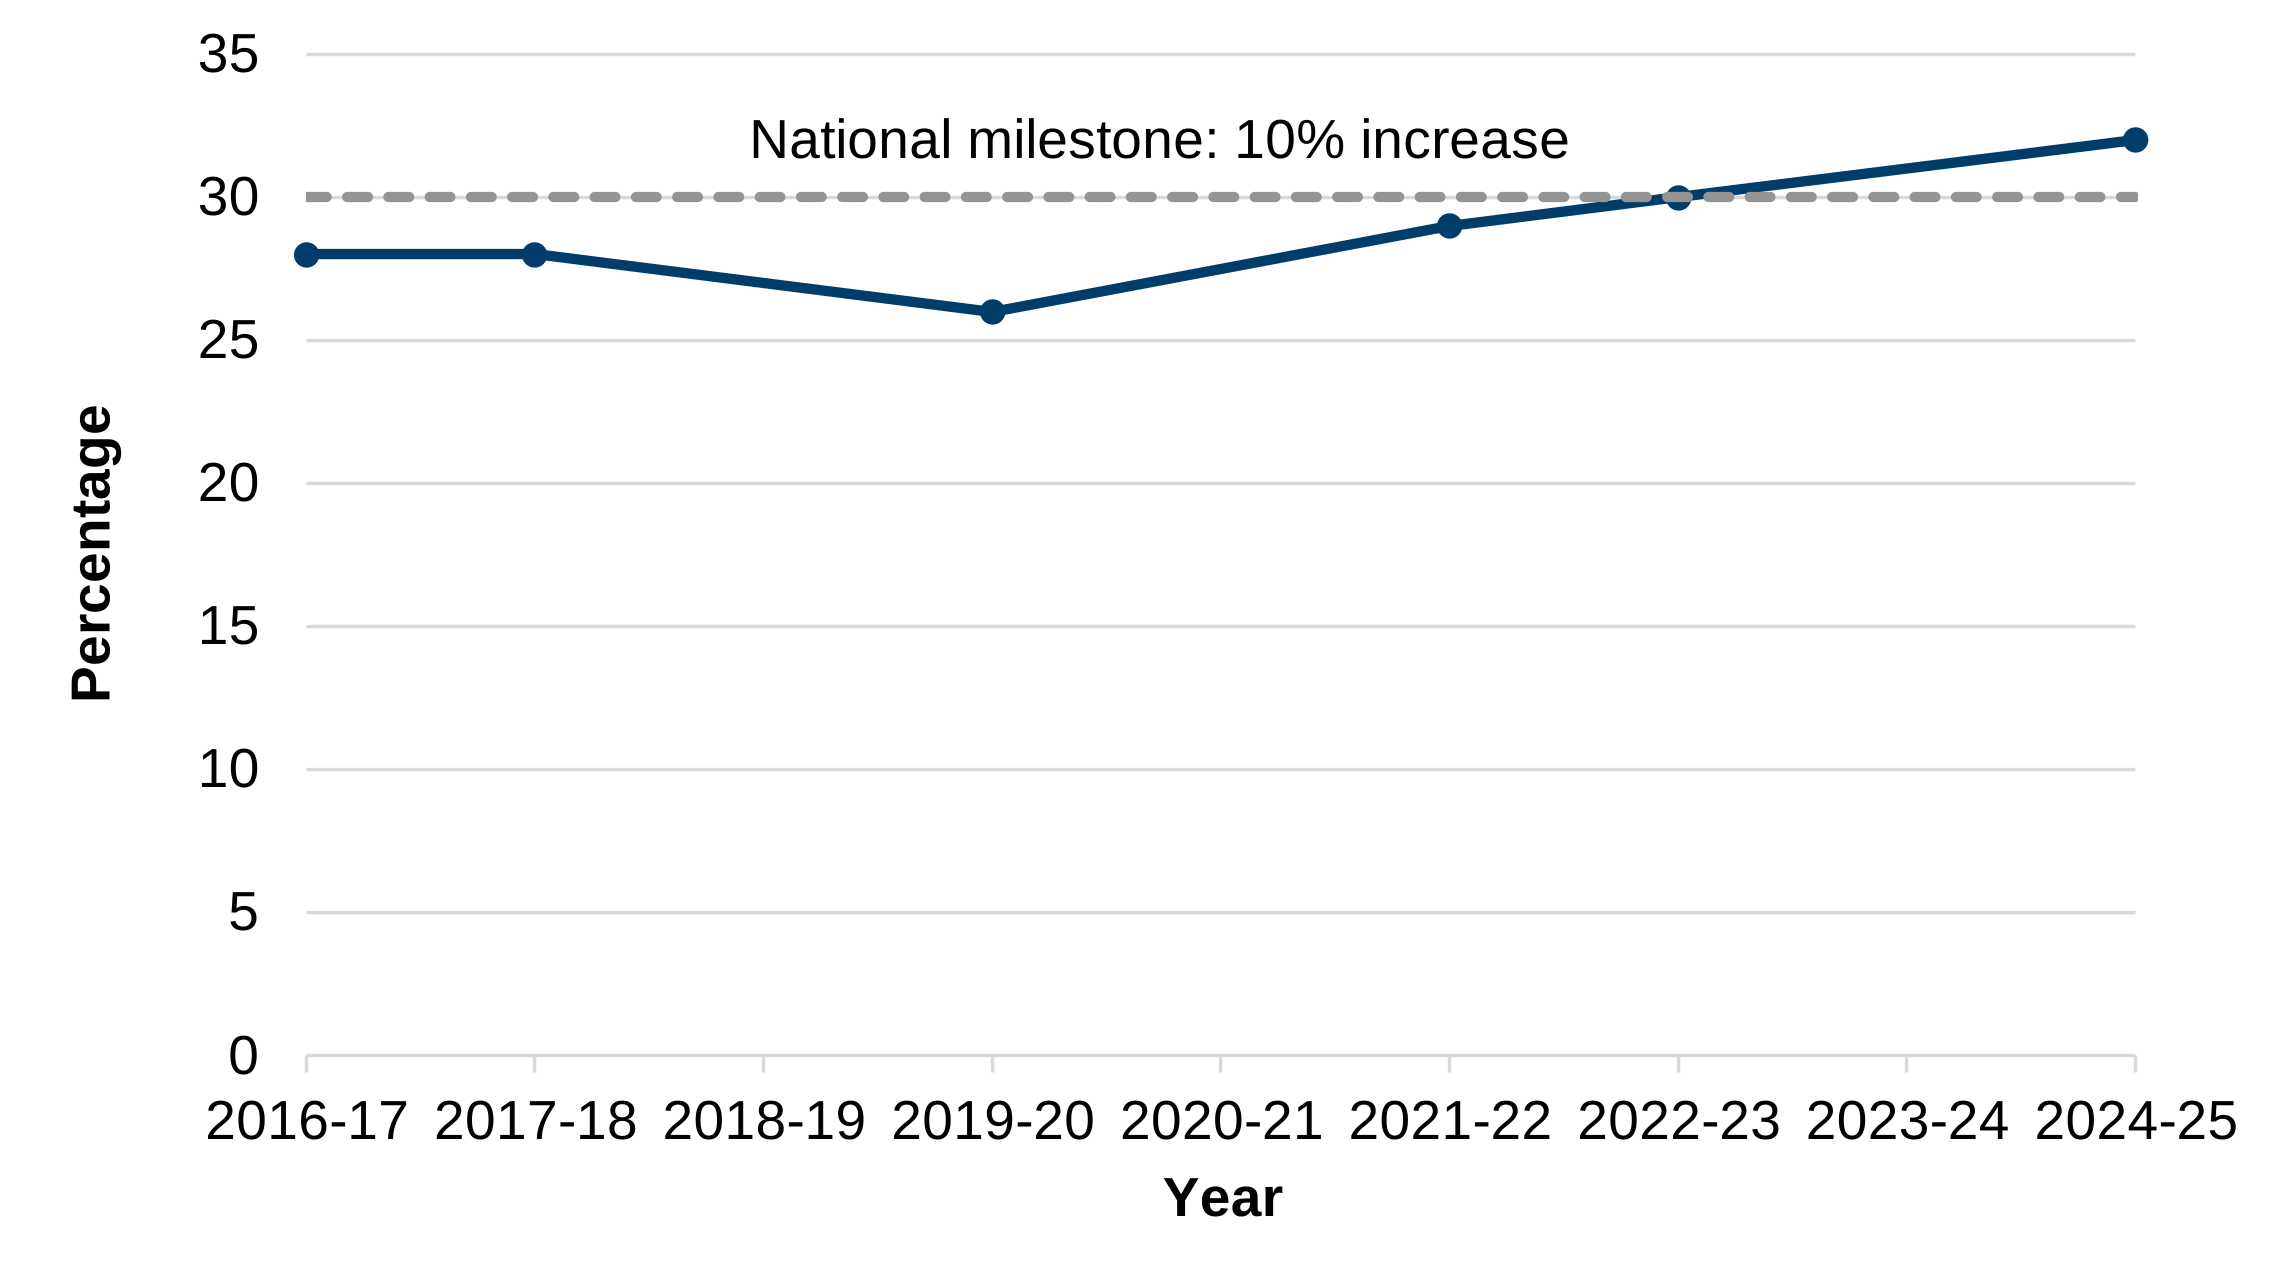
Description of figure 13: a line chart showing that the percentage of people who say they have volunteered increased overall, from 28% in 2016 to 2017 to 32% in 2024 to 2025, despite a slight dip in 2019 to 2020. The national milestone has been met.
Source: National Survey for Wales, Welsh Government.
Mental wellbeing
To improve adult and children’s mean mental wellbeing, and eliminate the gap in adult and children’s mean mental wellbeing between the most deprived and least deprived areas in Wales by 2050.
No change
For adults between financial year 2016 to 2017 and 2018 to 2019 or between 2021 to 2022 and 2024 to 2025.
Deteriorated
For children between 2017 and 2023.
Figure 14: average Warwick-Edinburgh mental well-being scale score for adults, by deprivation, financial year 2016 to 2017 to 2024 to 2025 [Note 1], [Note 2]
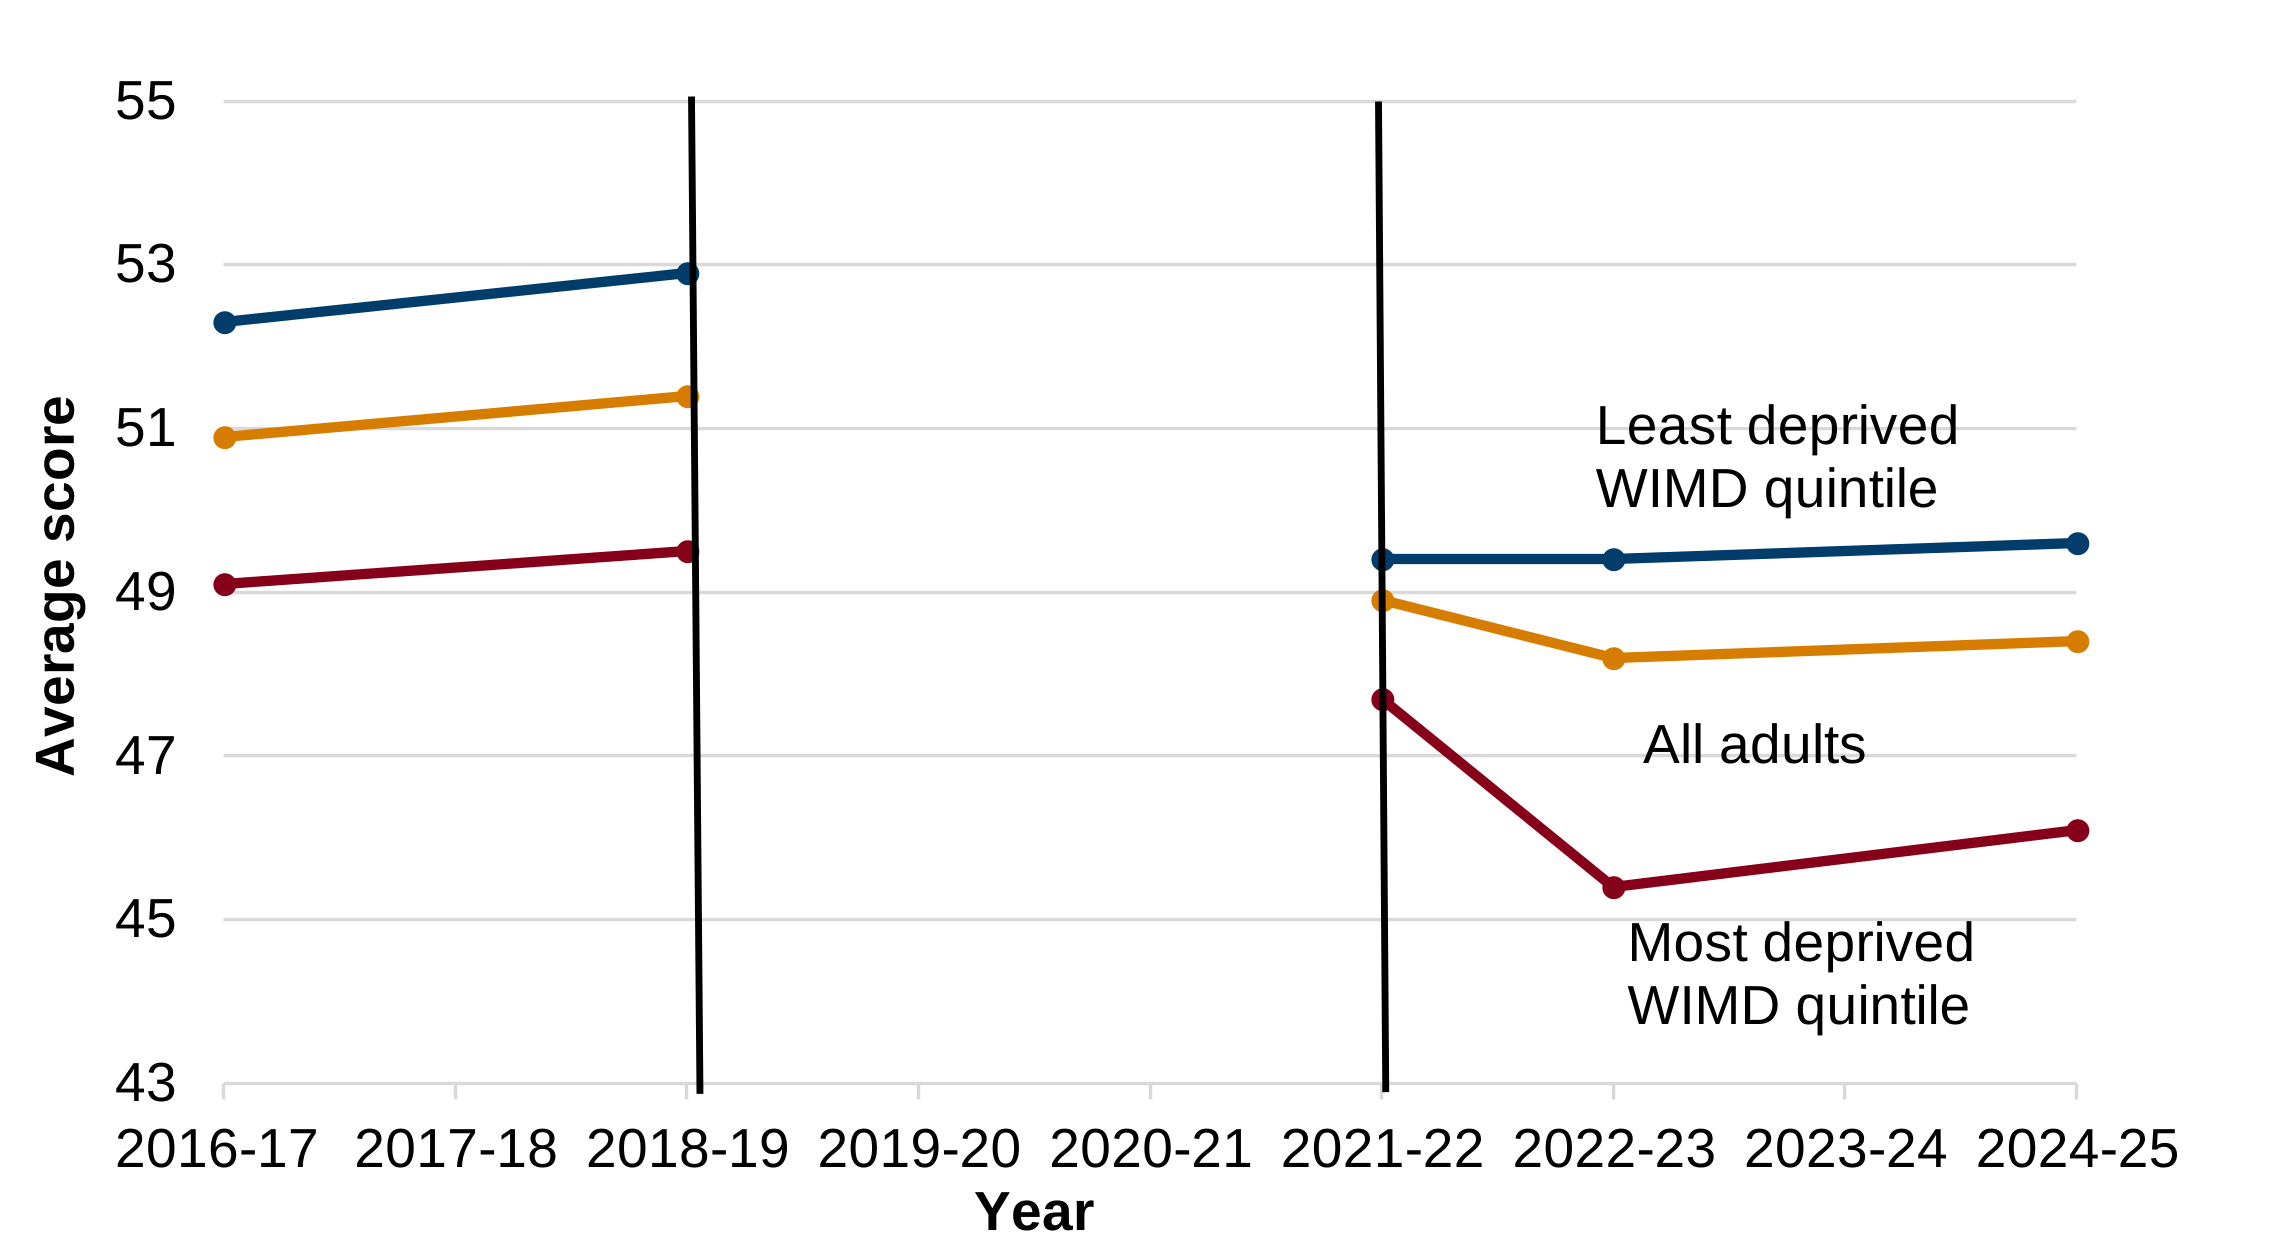
Description of figure 14: a line chart showing that the average Warwick-Edinburgh mental well-being scale (WEMWBS) score for adults did not show any significant change between financial year 2016 to 2017 and 2018 to 2019 or since 2021 to 2022. The gap in the average WEMWBS score between adults from the most and least deprived areas appears to have widened since 2021 to 2022.
Source: National Survey for Wales, Welsh Government.
[Note 1] Results from 2020 to 2021 are not comparable with previous years due to changes in the survey.
[Note 2] The y-axis does not start at zero.
Figure 15: average short Warwick-Edinburgh mental well-being scale score for young people aged 11 to 16, by affluence, 2017 to 2018 (academic year) to 2023 to 2024 [Note 1]
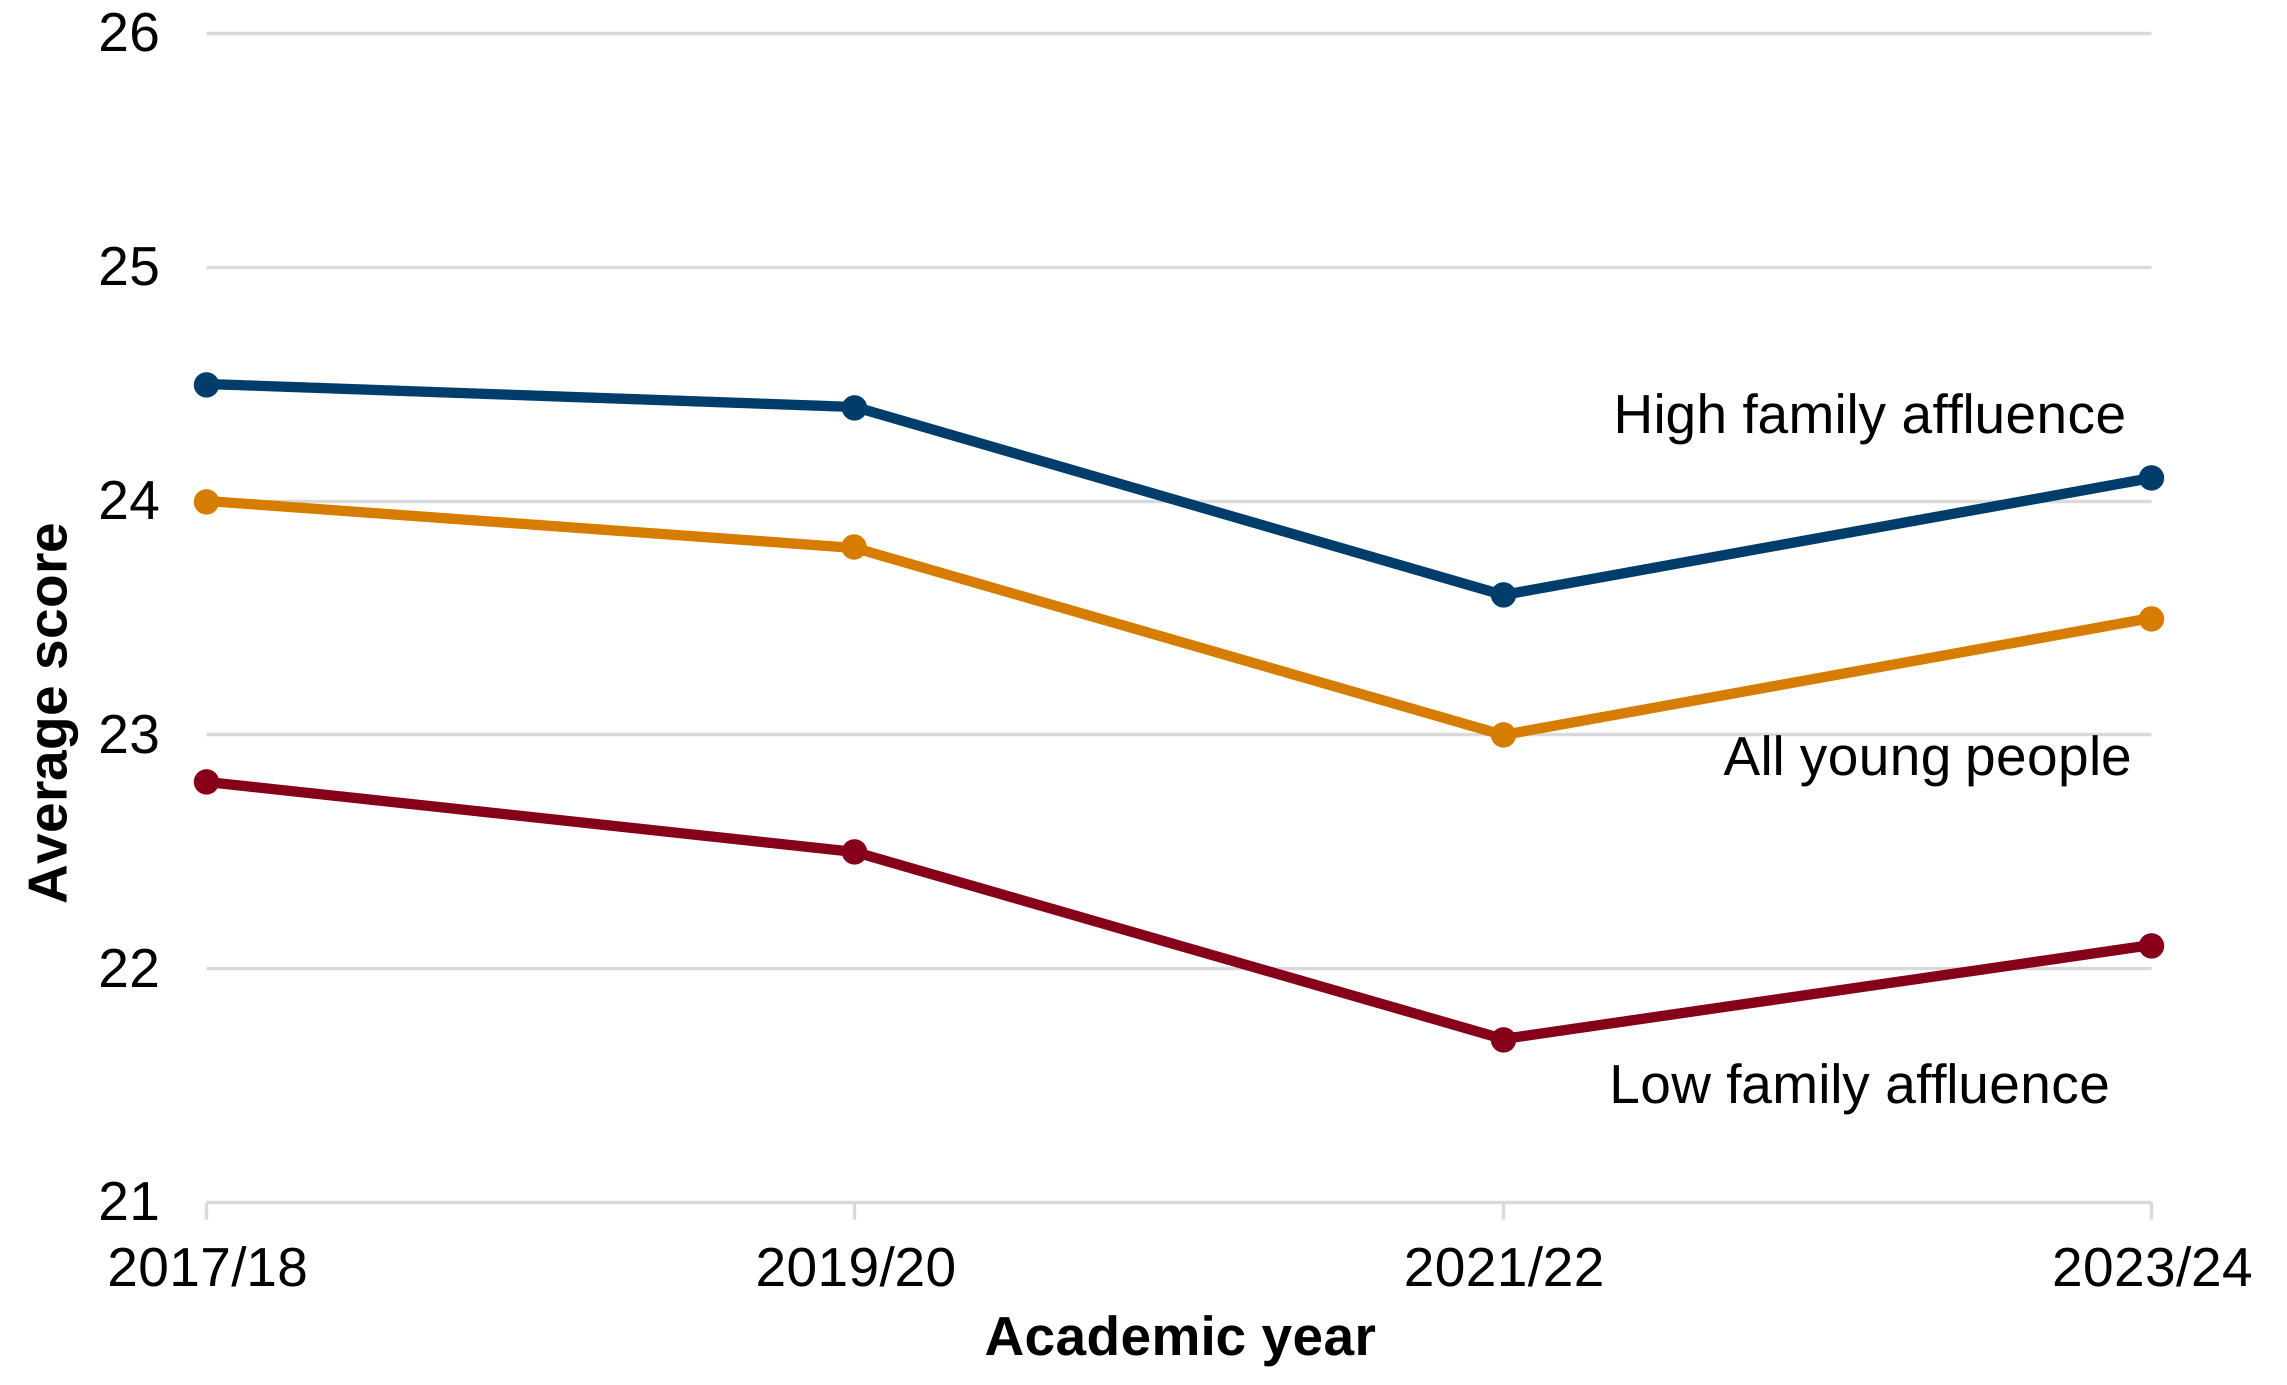
Description of figure 15: a line chart showing that the average short Warwick-Edinburgh mental well-being scale (SWEMWBS) score for young people aged 11 to 16 has declined from 24.0 in academic year 2017 to 2018 to 23.5 in 2023 to 2024. The gap in the average SWEMWBS score between young people from low and high family affluence has widened from 1.7 in 2017 to 2018 to 2.0 in 2023 to 2024.
Source: school health research network student health and wellbeing survey.
[Note 1] The y-axis does not start at zero.
Energy performance of homes
All homes in Wales will have adequate and cost-effective energy performance by 2050.
Change not assessed
According to the Welsh Housing Conditions Survey financial year 2017 to 2018, 47% of residential dwellings were considered to have adequate energy performance (a SAP rating of 65 or above). More recent data is not available.
Welsh speakers
A million Welsh speakers by 2050.
Deteriorated
Between 2011 and 2021.
Figure 16: number of people aged three years or older able to speak Welsh, 2011 to 2021
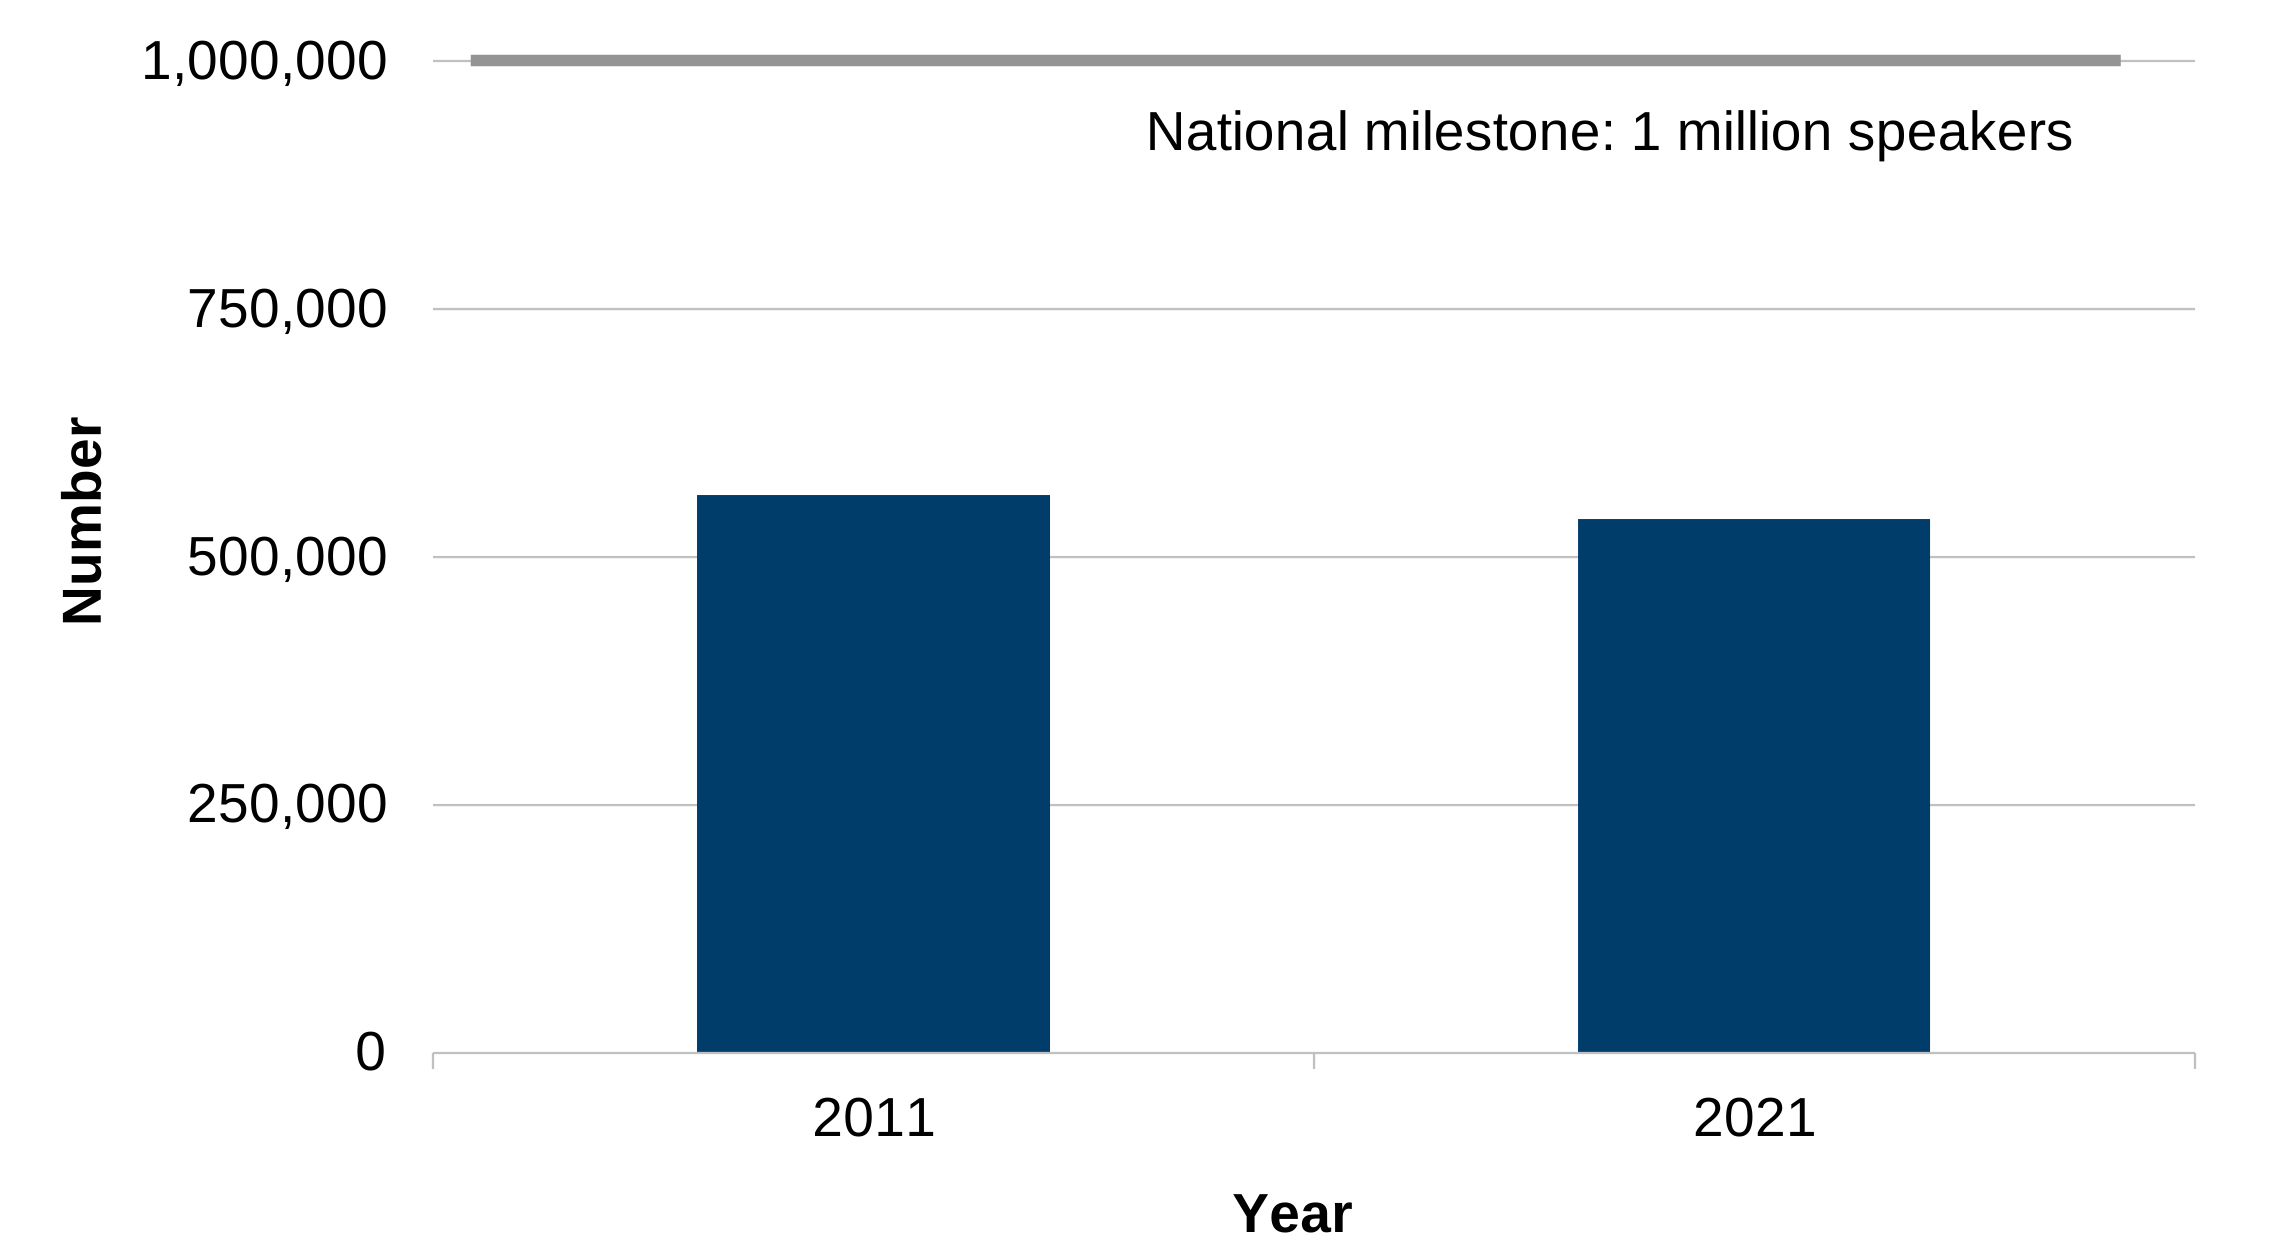
Description of figure 16: a column chart showing that the number of Welsh speakers fell from 562,000 in 2011 to 538,000 in 2021. Over the long term, the number of Welsh speakers has been falling, down from almost one million people in 1911 to 538,000 in the most recent census.
Source: census of population
Greenhouse gas emissions
Wales will achieve net-zero greenhouse gas emissions by 2050.
Improved
Between 2015 and 2024.
Figure 17: emissions of greenhouse gases, 2015 to 2024 [Note 1]
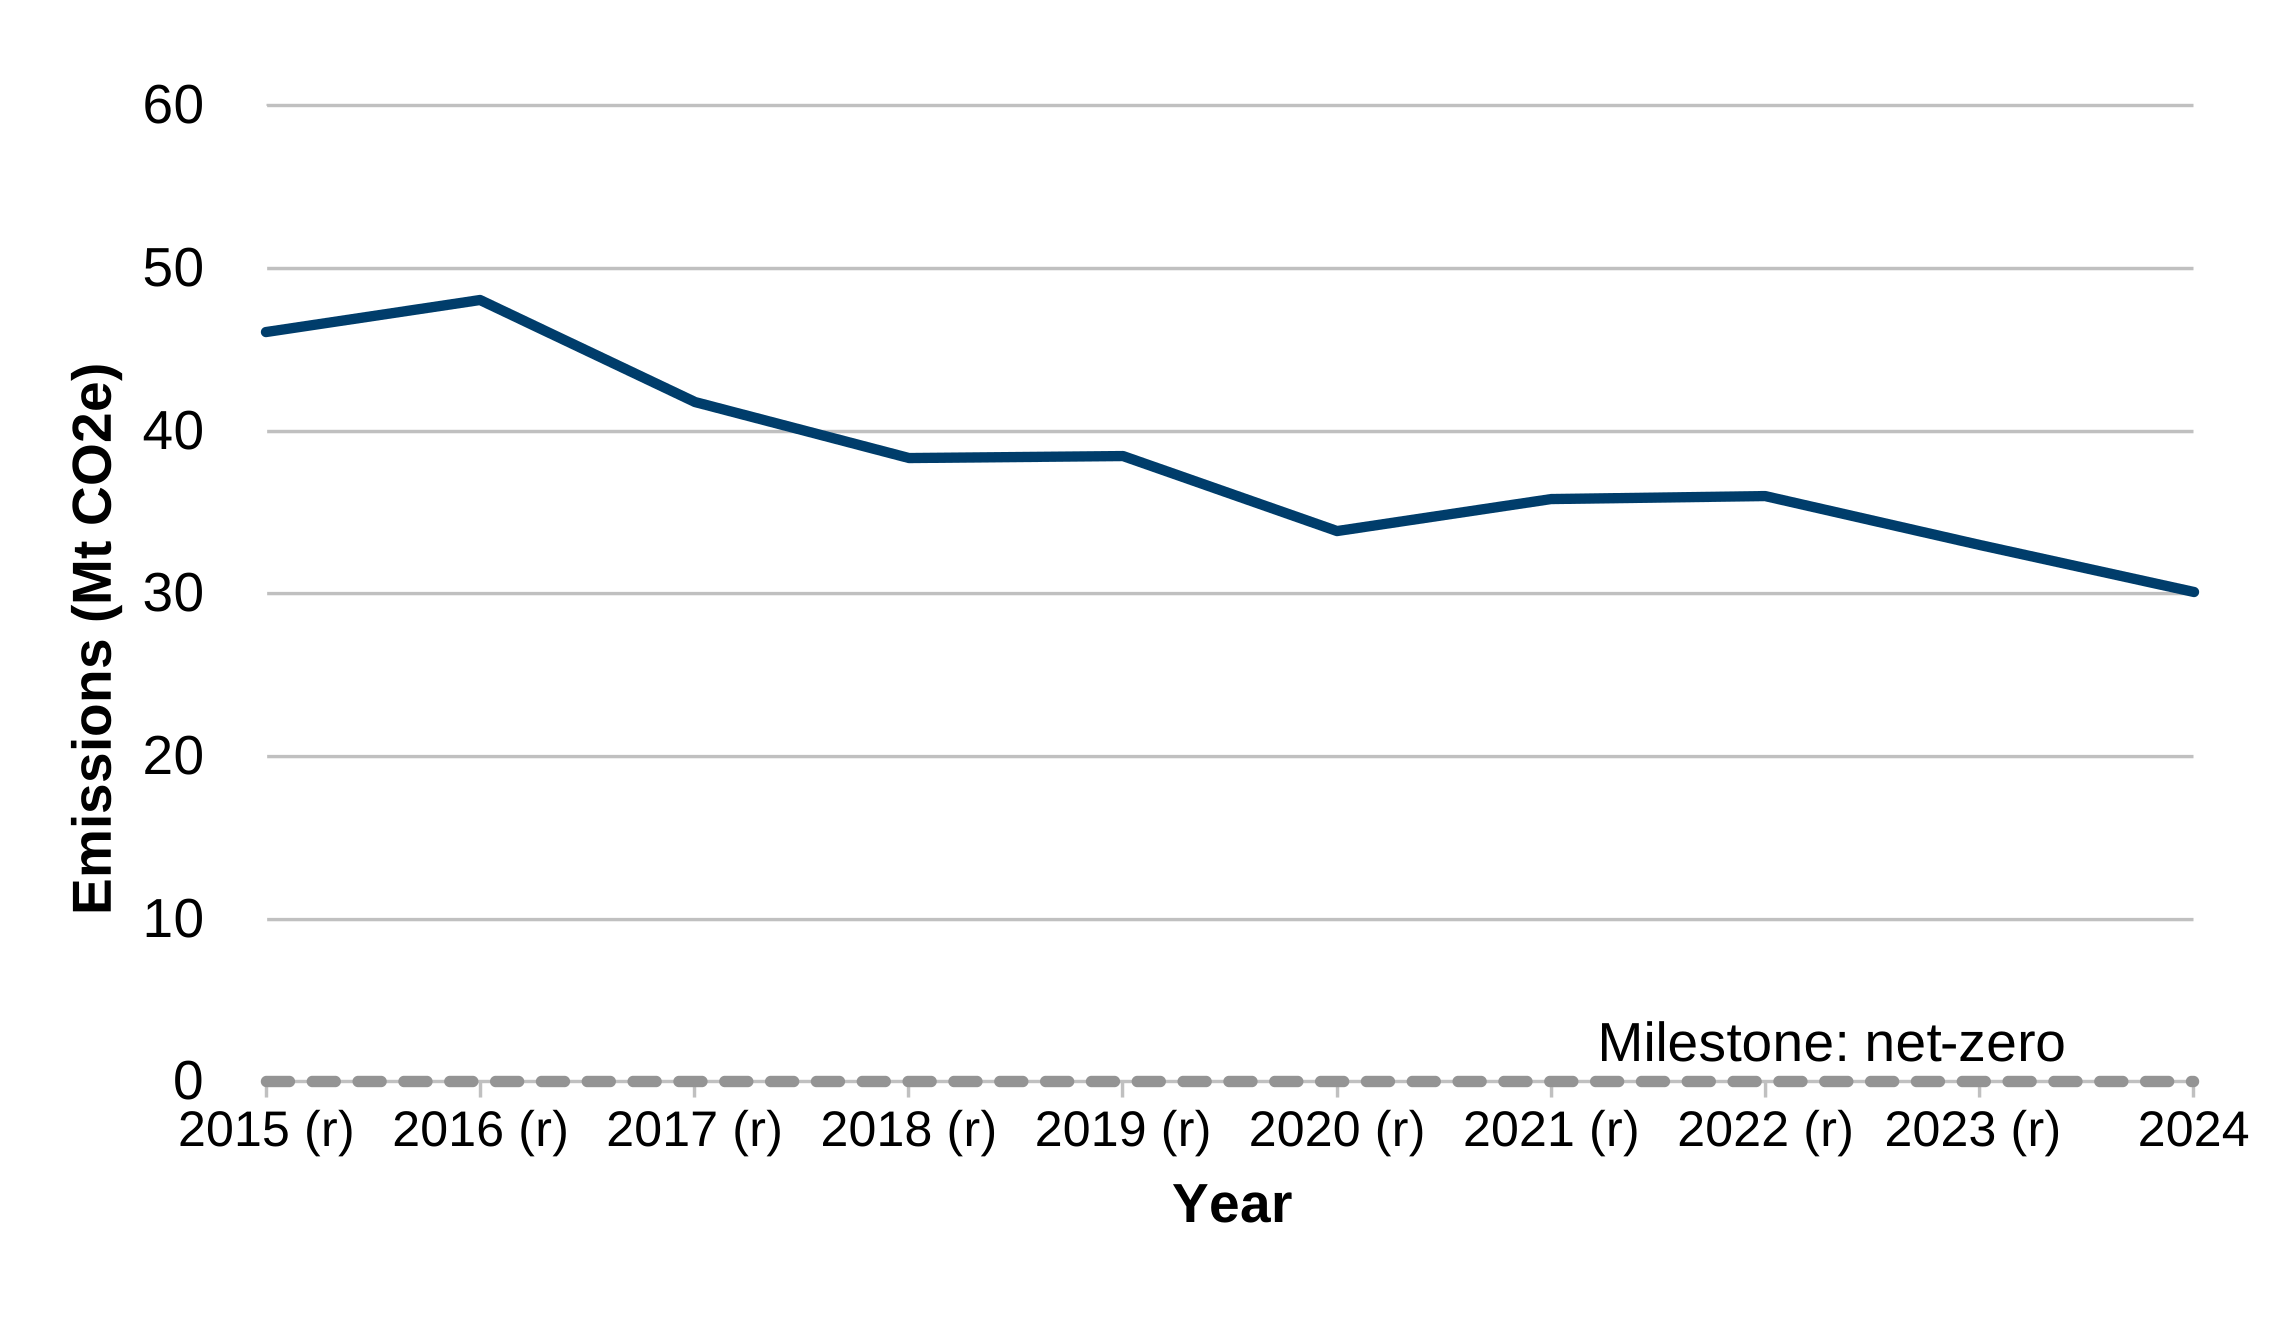
Description of figure 17: A line chart showing that in 2024, emissions released into the atmosphere directly from within Wales, known as territorial emissions, totalled 30.1 million tonnes of carbon dioxide equivalent, this was 46.1 in 2015. There has been a decrease of 35% between 2015 and 2024.
Source: National Atmospheric Emissions Inventory
[Note 1]: previously published figures have been revised and marked with (r)
Biodiversity
To reverse the decline in biodiversity with an improvement in the status of species and ecosystems by 2030 and their clear recovery by 2050.
No change
Between 2011 and 2016.
Source: Status of Biological Diversity in Wales (ERAMMP)
Over a long-term period (1970 to 2016), the index of distribution change for section 7 priority species in Wales had declined to 87% of its baseline value in 1970. Over the short-term period (2011 to 2016), the value of the indicator increased from 85 to 87 and was assessed as stable.