
Wellbeing of Wales 2026 - A globally responsible Wales
A summary of progress on improving our social, economic, environmental and cultural wellbeing.
In this page
A globally responsible Wales
A nation which, when doing anything to improve the economic, social, environmental and cultural wellbeing of Wales, takes account of whether doing such a thing may make a positive contribution to global wellbeing. This goal recognises that in an inter-connected world what we do to make Wales a sustainable nation can have positive and adverse impacts outside of Wales.
Progress towards the goal
Progress towards the globally responsible Wales goal has been gradual but sustained with the latest data showing further reductions in greenhouse gas emissions.
There is a national milestone for greenhouse gases which is for Wales to achieve net-zero greenhouse gas emissions by 2050. In 2024, it was estimated that greenhouse gas emissions released into the atmosphere directly from within Wales totalled 30.1 million tonnes of carbon dioxide equivalent (MtCO2e), a decrease of 9% from 2023, and a decrease of 44% from the base year.
Consumption emissions associated with goods and services consumed by Welsh households were estimated to be 34.0 MtCO2e in 2023, a decrease of 15% from 2001.
There is also a national milestone relating to global footprint which is for Wales to use only its fair share of the world’s resources by 2050. The latest estimates show that while the global footprint per person in Wales reduced by nearly a third between 2004 and 2018, it remains over twice the estimated biocapacity of Wales. If the entire world population lived like the citizens of Wales, humanity would require 2.08 Earths.
In academic year 2025 to 26, there were 19,074 entrants for the Global Citizenship Challenge at Key Stage 4. There were 13,318 entries for the new advanced global community project.
Global context: United Nations Sustainable Development Goals
On 1 January 2016, the world began implementation of the 2030 Agenda for Sustainable Development, the transformative plan of action based on 17 Sustainable Development Goals (SDGs), to address urgent global challenges over the next 15 years. The SDGs emphasise a universal agenda that requires all UN member states, both rich and poor alike, to take action to support sustainable development.
There are many factors which dictate whether Wales is becoming a more globally responsible nation.
The Well-being of Future Generations Act, with its Welsh specific wellbeing goals, provides a framework for Wales’s contribution to the achievement of the United Nations Sustainable Development Goals. For the most part, the other 6 narrative reports, through their assessment of our progress towards the national wellbeing goals, demonstrate our overall contribution as a nation to the international sustainable development agenda. For example, we report elsewhere on national trends on issues such as poverty, inequalities and fair work. This narrative on a globally responsible Wales focuses on areas that are most relevant to the global agenda.
The 50 national indicators for Wales have also been mapped for indicative purposes against the 17 Sustainable Development Goals to help you navigate between progress here in Wales, and the relationship to each of the SDGs.
National Indicators: mapping to Wellbeing and UN Sustainable Development Goals (interactive tool)
Whilst some of the narrative is drawn from national indicators and official statistics, some of the data presented in this section is contextual and uses data or factual statements related to specific policies or programmes, where we have considered it relevant to the overall narrative. These data are not collected through official statistics sources, and although reported here for context, we cannot provide full assurance about data quality. However, where possible, more information about the data can be found in the quality information for the Wellbeing of Wales report.
Climate change
Goal 13 of the UN SDGs is to “take urgent action to combat climate change and its impacts”.
People in Wales are concerned about climate change.
The National Survey results for financial year 2022 to 2023 show that the vast majority (97%) of people in Wales thought the world’s climate was changing. Around three quarters (74%) of adults were fairly concerned or very concerned about climate change, similar to recent years and most (94%) thought human activity was involved to some extent in the world’s climate changing.
Greenhouse gas emissions
There is a national milestone for greenhouse gases which is for Wales to achieve net-zero greenhouse gas emissions by 2050.
In 2024 it was estimated that emissions released into the atmosphere directly from within Wales (known as territorial emissions) totalled 30.1 million tonnes of carbon dioxide equivalent (MtCO2e). This is a decrease of 9% from 2023 and continues the recent trend of more substantial reductions.
Decreased gas and coal use in the industry sectors and electricity supply caused the largest emissions reductions in 2024. Industry sector emissions fell by 25%, largely due to blast furnace closures in the iron and steel industry and lower coal use across the sector. Electricity supply sector emissions fell by 9%, largely as a result of higher electricity imports, greater renewable generation, and the closure of the UK’s last coal powered station in September 2024.
Figure 7.1: estimated Welsh territorial emissions of greenhouse gases (Mt CO2e), 1990 to 2024 [Note 1]
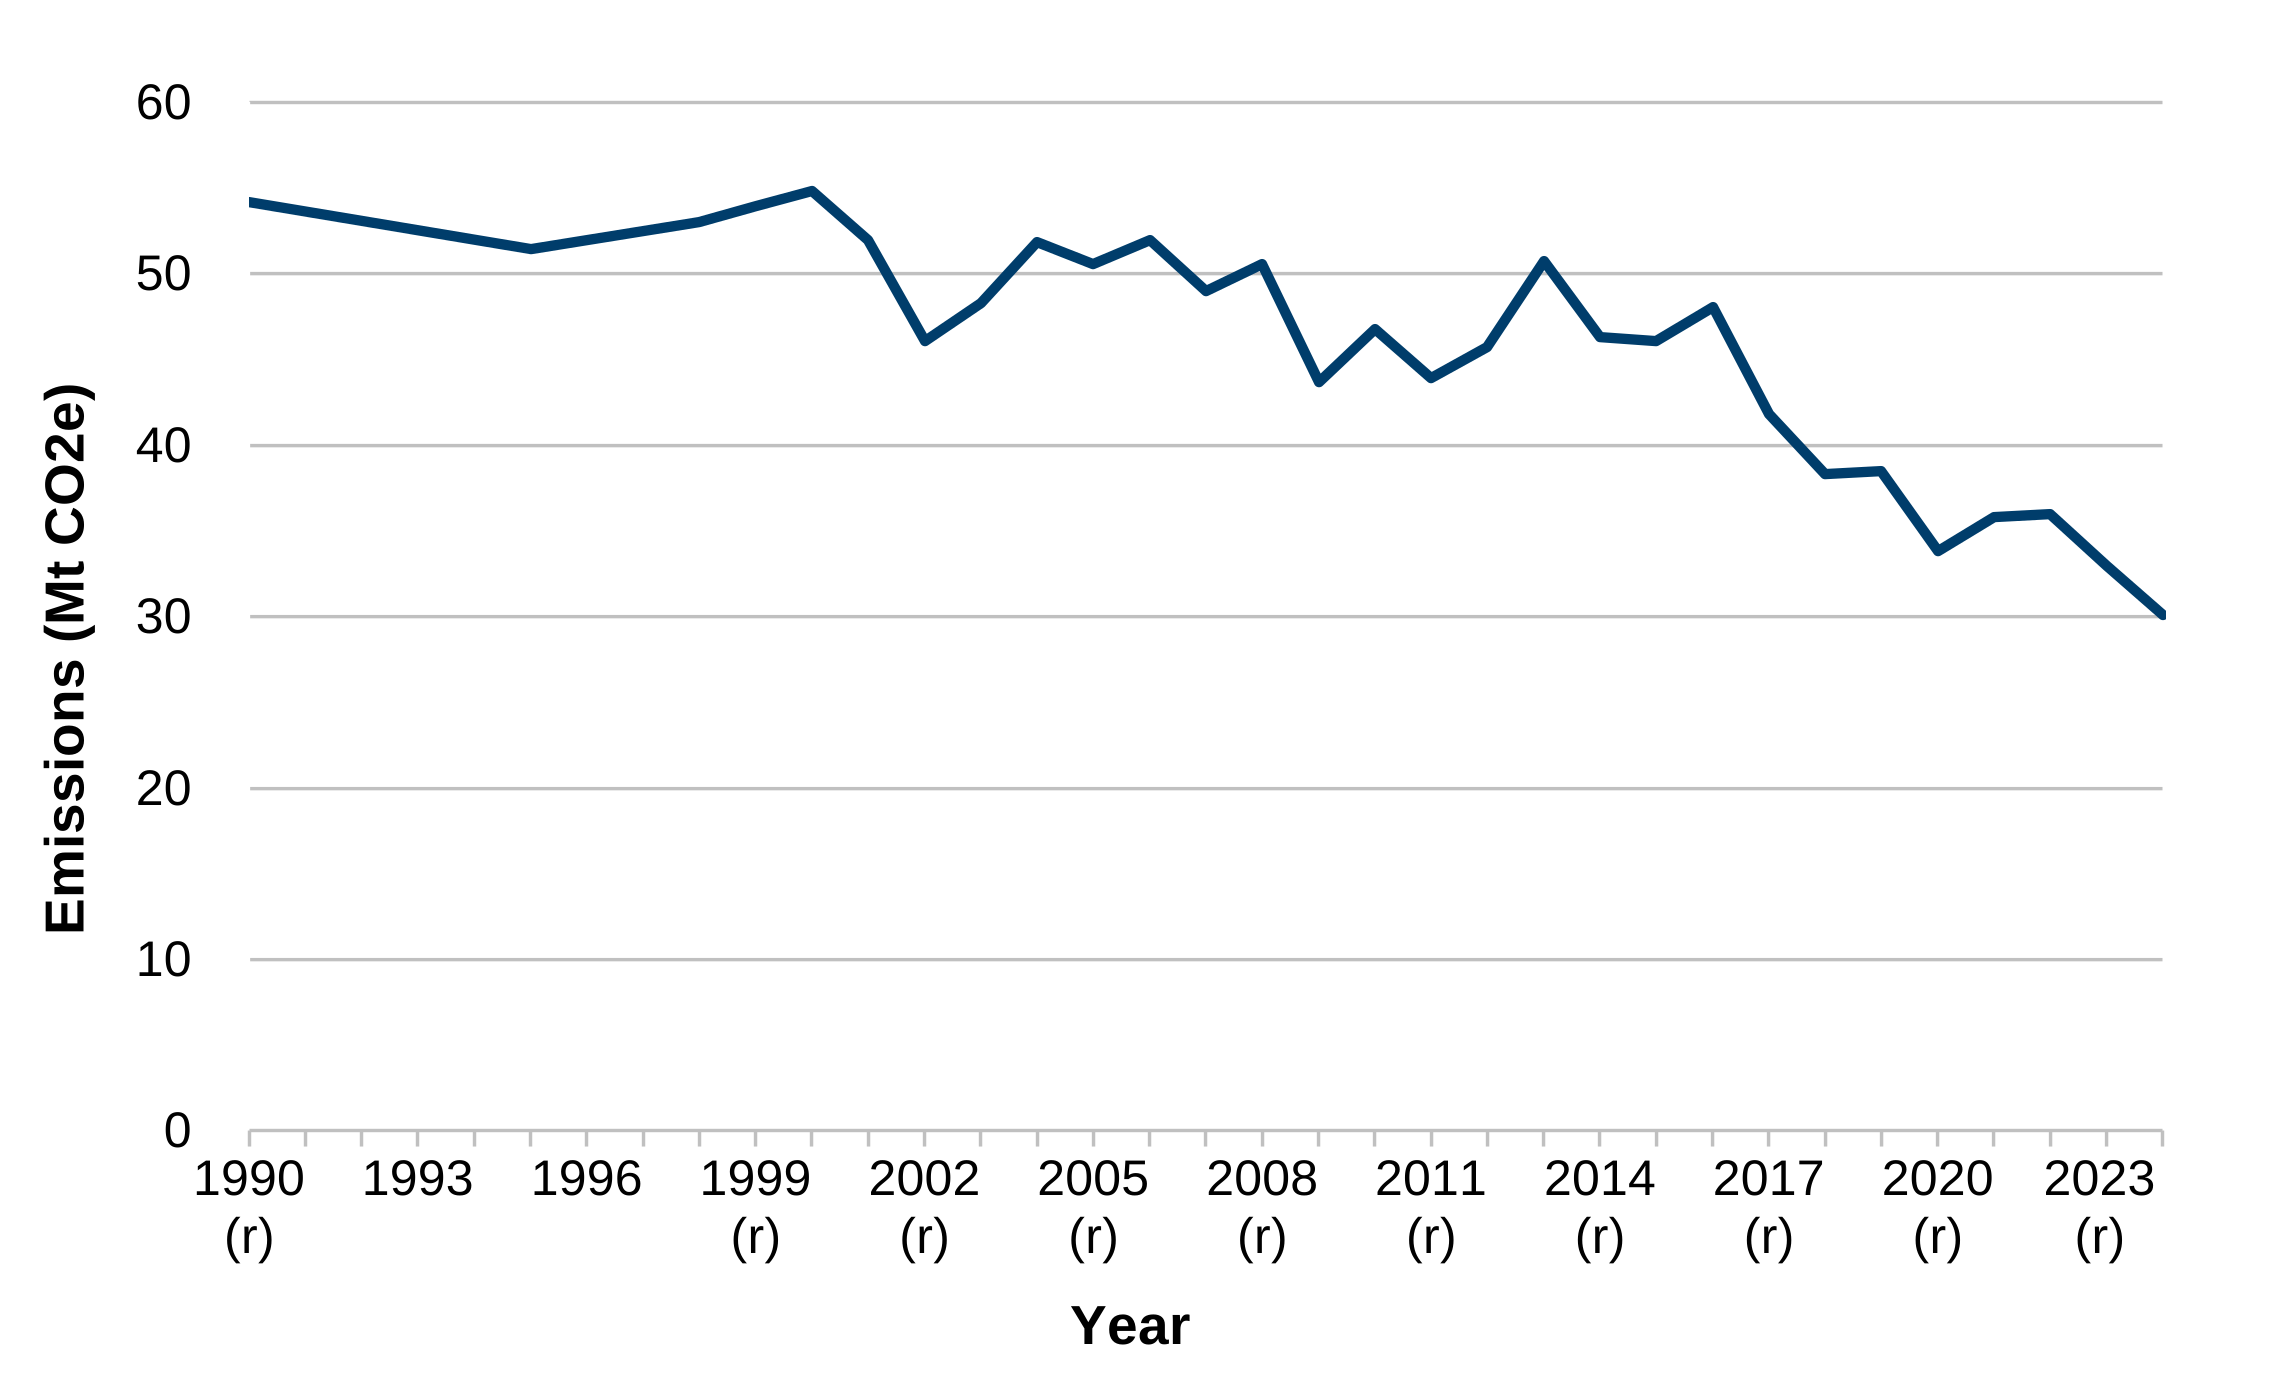
Description of figure 7.1: the line chart shows the volume of territorial greenhouse gas emissions (megatonnes) in Wales in between 1990 and 2024. Emissions in Wales have fallen by 44% since the base year. Emissions decreased by 9% between 2023 and 2024.
Source: National Atmospheric Emissions Inventory
[Note 1]: previously published figures for all years up to 2023 have been revised and marked with (r). No data is published for 1991 to 1994, 1996 and 1997.
There has been a fall of 44% since the base year emissions. The long-term emission reduction trend since the base year is mainly due to:
- efficiencies in energy generation and business sector heating (of buildings and for processes)
- the use of natural gas to replace some coal and other fuels as well as abatement in some chemical industries
- reductions in emissions from anaerobic waste management
- variations in manufacturing output (for example in iron and steel, bulk chemical production)
The largest emission sector in 2024 was the industry sector, which accounted for 22% of all greenhouse gas emissions in Wales. This sector is dominated by fuel combustion in the iron and steel production process, such as blast furnaces, coke production, flaring, and sinter production.
The domestic transport sector is the second largest sector making up 19% of Welsh emissions. This is followed by the agriculture sector (17%), the electricity supply sector (15%), the buildings and product uses sector (13%), the fuel supply sector (11%), with other sectors each making smaller contributions of 4% or less.
These figures on territorial greenhouse gas emissions only take account of emissions within Wales. This does not include emissions associated with the production of goods and services outside of Wales even if these are imported into Wales. Equally, emissions associated with the production of goods and services in Wales are counted as Welsh emissions even if these are exported for consumption elsewhere.
Emissions of greenhouse gases attributed to the consumption of global goods and services in Wales
Consumption emissions have generally decreased since 2001. They fell from 40MtCO2e in 2001 to 34MtCO2e in 2023, a decrease of 15%.
Most emissions (82%) came from the goods and services people use. More than half of all emissions (53%) came from imported goods and services. A further 28% came from goods and services produced in the UK.
The remaining 18% came from activities such as burning fuel for heating and transport.
Figure 7.2: estimated Welsh consumption emissions footprint (Mt CO2e), 2001 to 2023
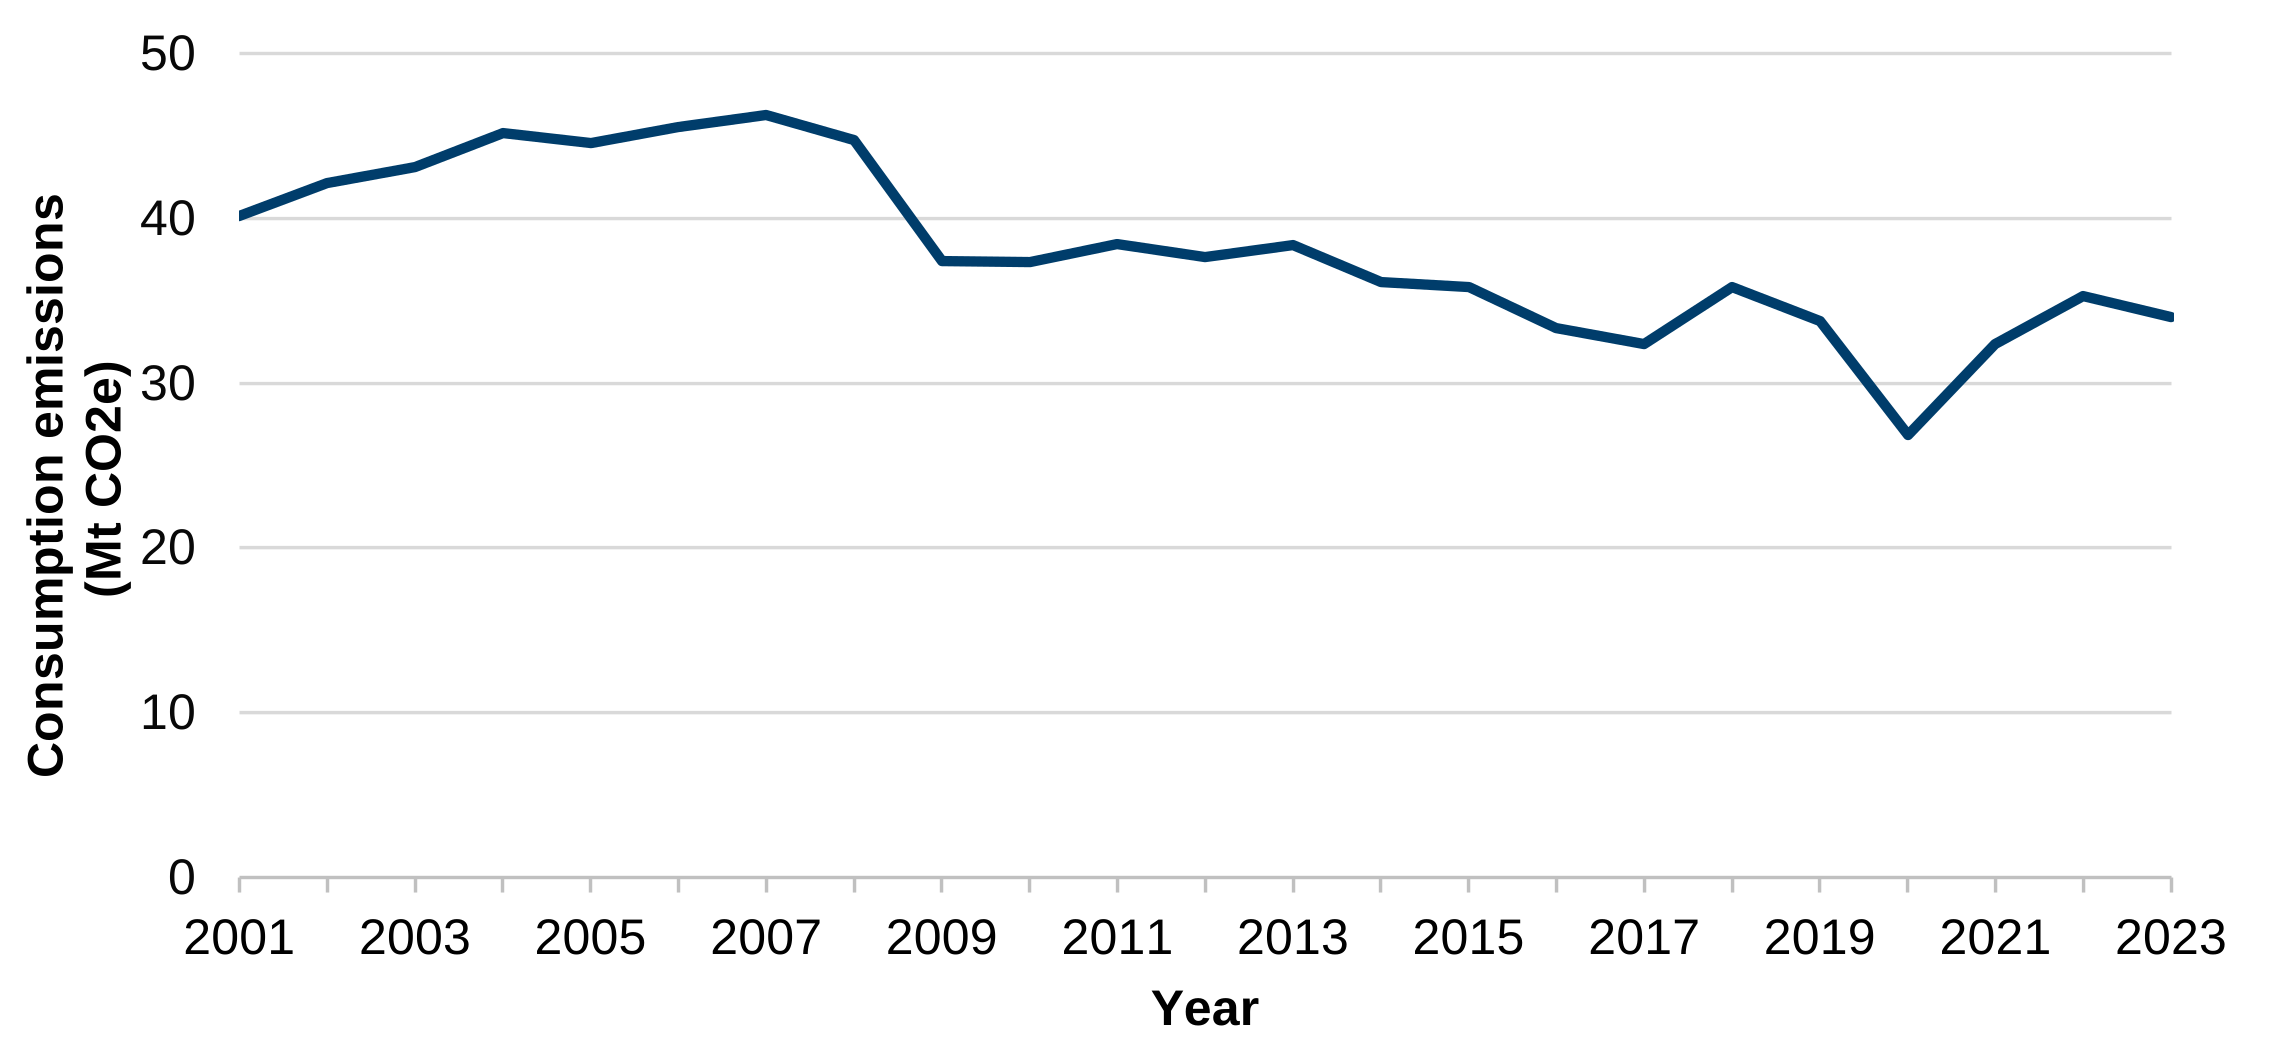
Description of figure 7.2: the line chart shows the volume of estimated consumption emissions (megatonnes) in Wales show a general downward trend since 2001. Between 2001 and 2023, Wales’ estimated consumption emissions footprint has decreased by 15%, from 40 MtCO2e to 34 MtCO2e.
Source: Consumption Emissions Footprint, Wales, 2001 to 2020 (MtCO2e), University of Leeds consumption based emissions estimate.
Mode of travel
Some forms of travel, including road traffic, make a substantial contribution to carbon emissions. Increasing the proportion of journeys made by walking, wheeling, cycling and public transport is an important part of reducing transport emissions and supporting wider well-being outcomes.
A national indicator on the percentage of journeys made by walking, cycling or public transport was added to the national indicator set in December 2021. In 2026, data became available for the first time from the Wales National Travel Survey (WNTS), a new large-scale survey of travel behaviours in Wales.
Provisional results from the first 6 months of the survey (March to August 2025) estimate that 17.7% of journeys were made by walking or wheeling and 2.0% by cycle. Together, active travel modes accounted for 19.6% of journeys in Wales.
WNTS is a new survey and these are official statistics in development based on the first 6 months of data collection. The estimates are derived from a 2 day travel diary completed by around 3,100 respondents and cover around 9,000 journeys recorded between March and August 2025. Travel patterns may differ at other times of the year, and methodological differences mean the results are not directly comparable with previous travel surveys or other transport data sources.
Full-year results from the WNTS are expected to be published in November 2026 and will provide the first annual baseline for monitoring this national indicator over time.
Prior to the introduction of the WNTS, information on travel behaviours in Wales was limited. Data from the Labour Force Survey showed that private road transport remained the dominant mode of commuting, with 81% of commuters in Wales usually travelling to work by car in 2023. There was little change in the proportion of people using different modes of transport to travel to work over the preceding decade.
Figure 7.3 share of journeys per person per year by main mode of travel, 2025 [Note 1]
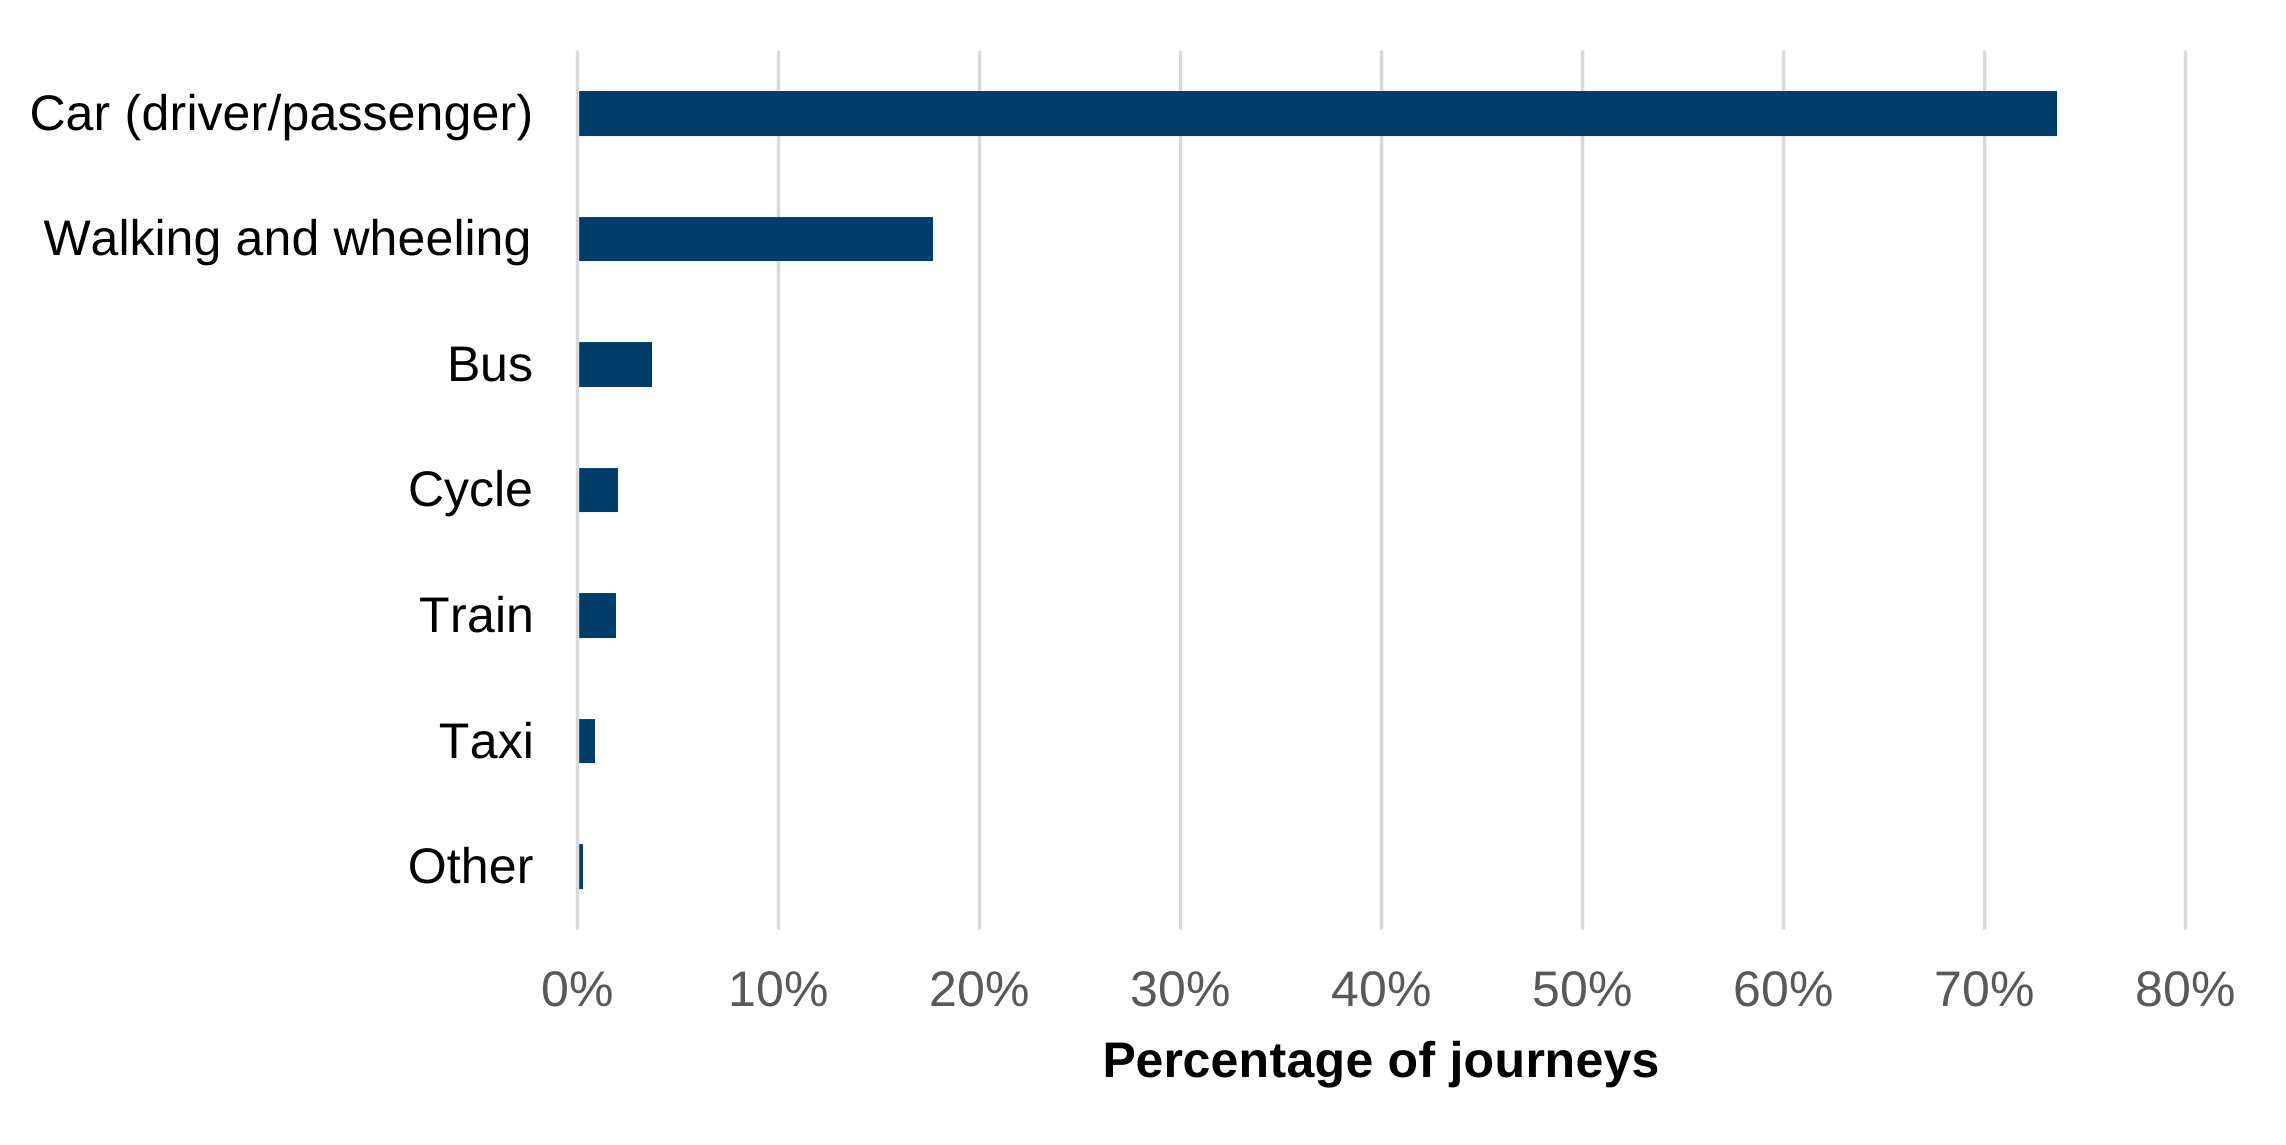
Description of figure 7.3: the bar chart shows the share of journeys in Wales made by their main mode of travel. 73.6% of journeys were made by car, either as a driver or a passenger. 17.7% of journeys were made by walking or wheeling and other modes were used less frequently.
[Note 1] percentages have been calculated excluding respondents who selected “Don’t know” or “Prefer not to say” when answering what mode of travel they used.
Source: Wales National Travel Survey headline results: preliminary, six-months results
Global footprint
Our global footprint is the total environmental burden that society places on the planet. Globally, we are consuming more natural resources than the world is able to replace.
The national milestone for this indicator is that Wales will only use its fair share of the world’s resources by 2050.
The latest estimates, based on the Ecological Footprint methodology show that Wales’s global footprint decreased from around 17.0 million global hectares (gha) in 2004 to 12.3 million gha in 2018. The global footprint per person has reduced by nearly a third over this time period, and stood at 3.9 gha per person in 2018. The latest estimates suggest that if everyone in the world lived as people in Wales do, humanity would require 2.08 Earths.
Figure 7.4: global footprint, global hectares (gha) per person, 2004 to 2018
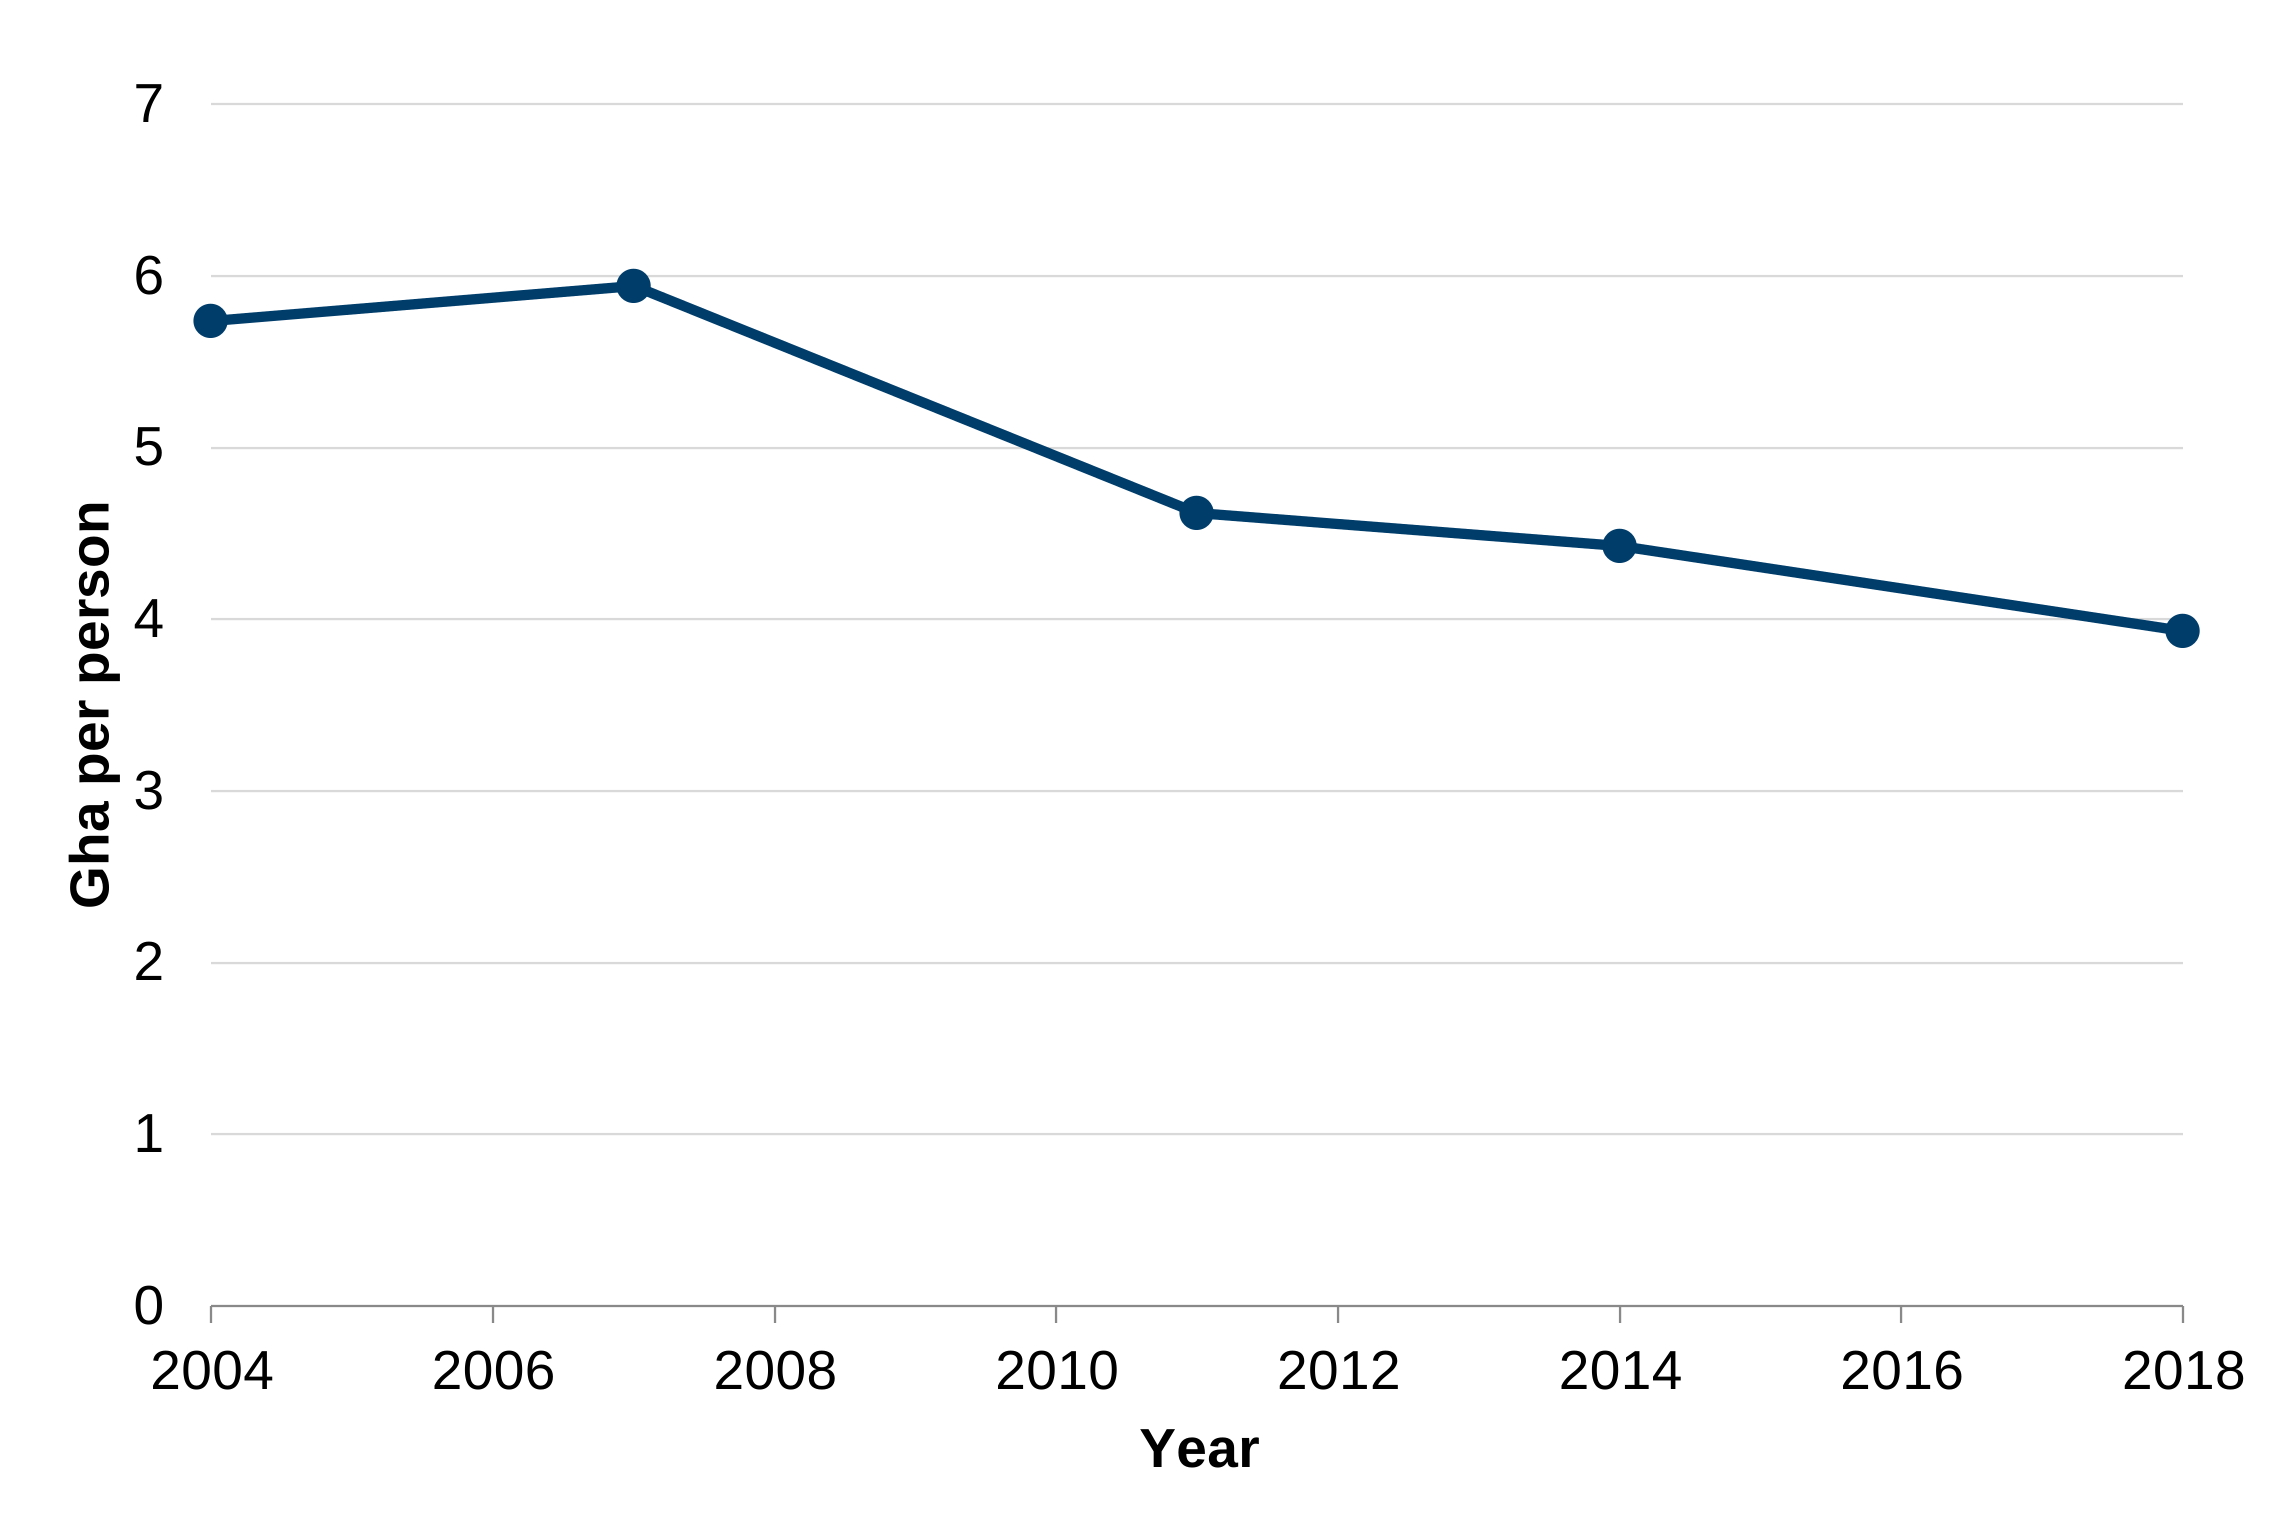
Description of figure 7.4: a line chart showing the global footprint (gha) per person in Wales, at three/four yearly intervals between 2004 and 2018. The global footprint per person has gradually decreased over the period.
Source: Understanding the Global Environmental Footprint and Impacts of Welsh Consumption, JNCC
An alternative measure of Wales’ Ecological Footprint uses slightly higher quality input data but does not allow for comparison over time. This footprint was around 10.7 million gha in 2019, equivalent to approximately 3.4 gha per person.
Active global citizenship
The National Survey for Wales asks people about what activities they have done to help with international issues such as poverty, human rights, war, refugees or climate change. The responses in financial year 2024 to 2025 are broadly consistent with those from the last time these questions were included in 2021 to 2022.
13% of those surveyed have done 3 or more actions to help with global issues. Half of people (50%) reported changing what they buy because of global issues, whilst 33% of people say they have donated or helped raised money.
Modern slavery
Referrals of potential victims of modern slavery in Wales continue to gradually rise.
The UN SDGs include a target on ‘Ending modern slavery and human trafficking’. Modern slavery is the term used within the UK and is defined within the Modern Slavery Act 2015. The Act categorises offences of Slavery, Servitude and Forced or Compulsory Labour and Human Trafficking.
According to the National Crime Agency (NCA), the recorded incidents of potential victims of slavery to the National Referral Mechanism (NRM) or via the Duty to Notify (DtN) process continue to increase each year in Wales.
In 2025, there were 578 referrals of potential victims of modern slavery received by police forces in Wales, a small increase compared to the previous year (563).
Figure 7.5: NRM referrals sent to police forces in Wales for investigation, 2018 to 2025
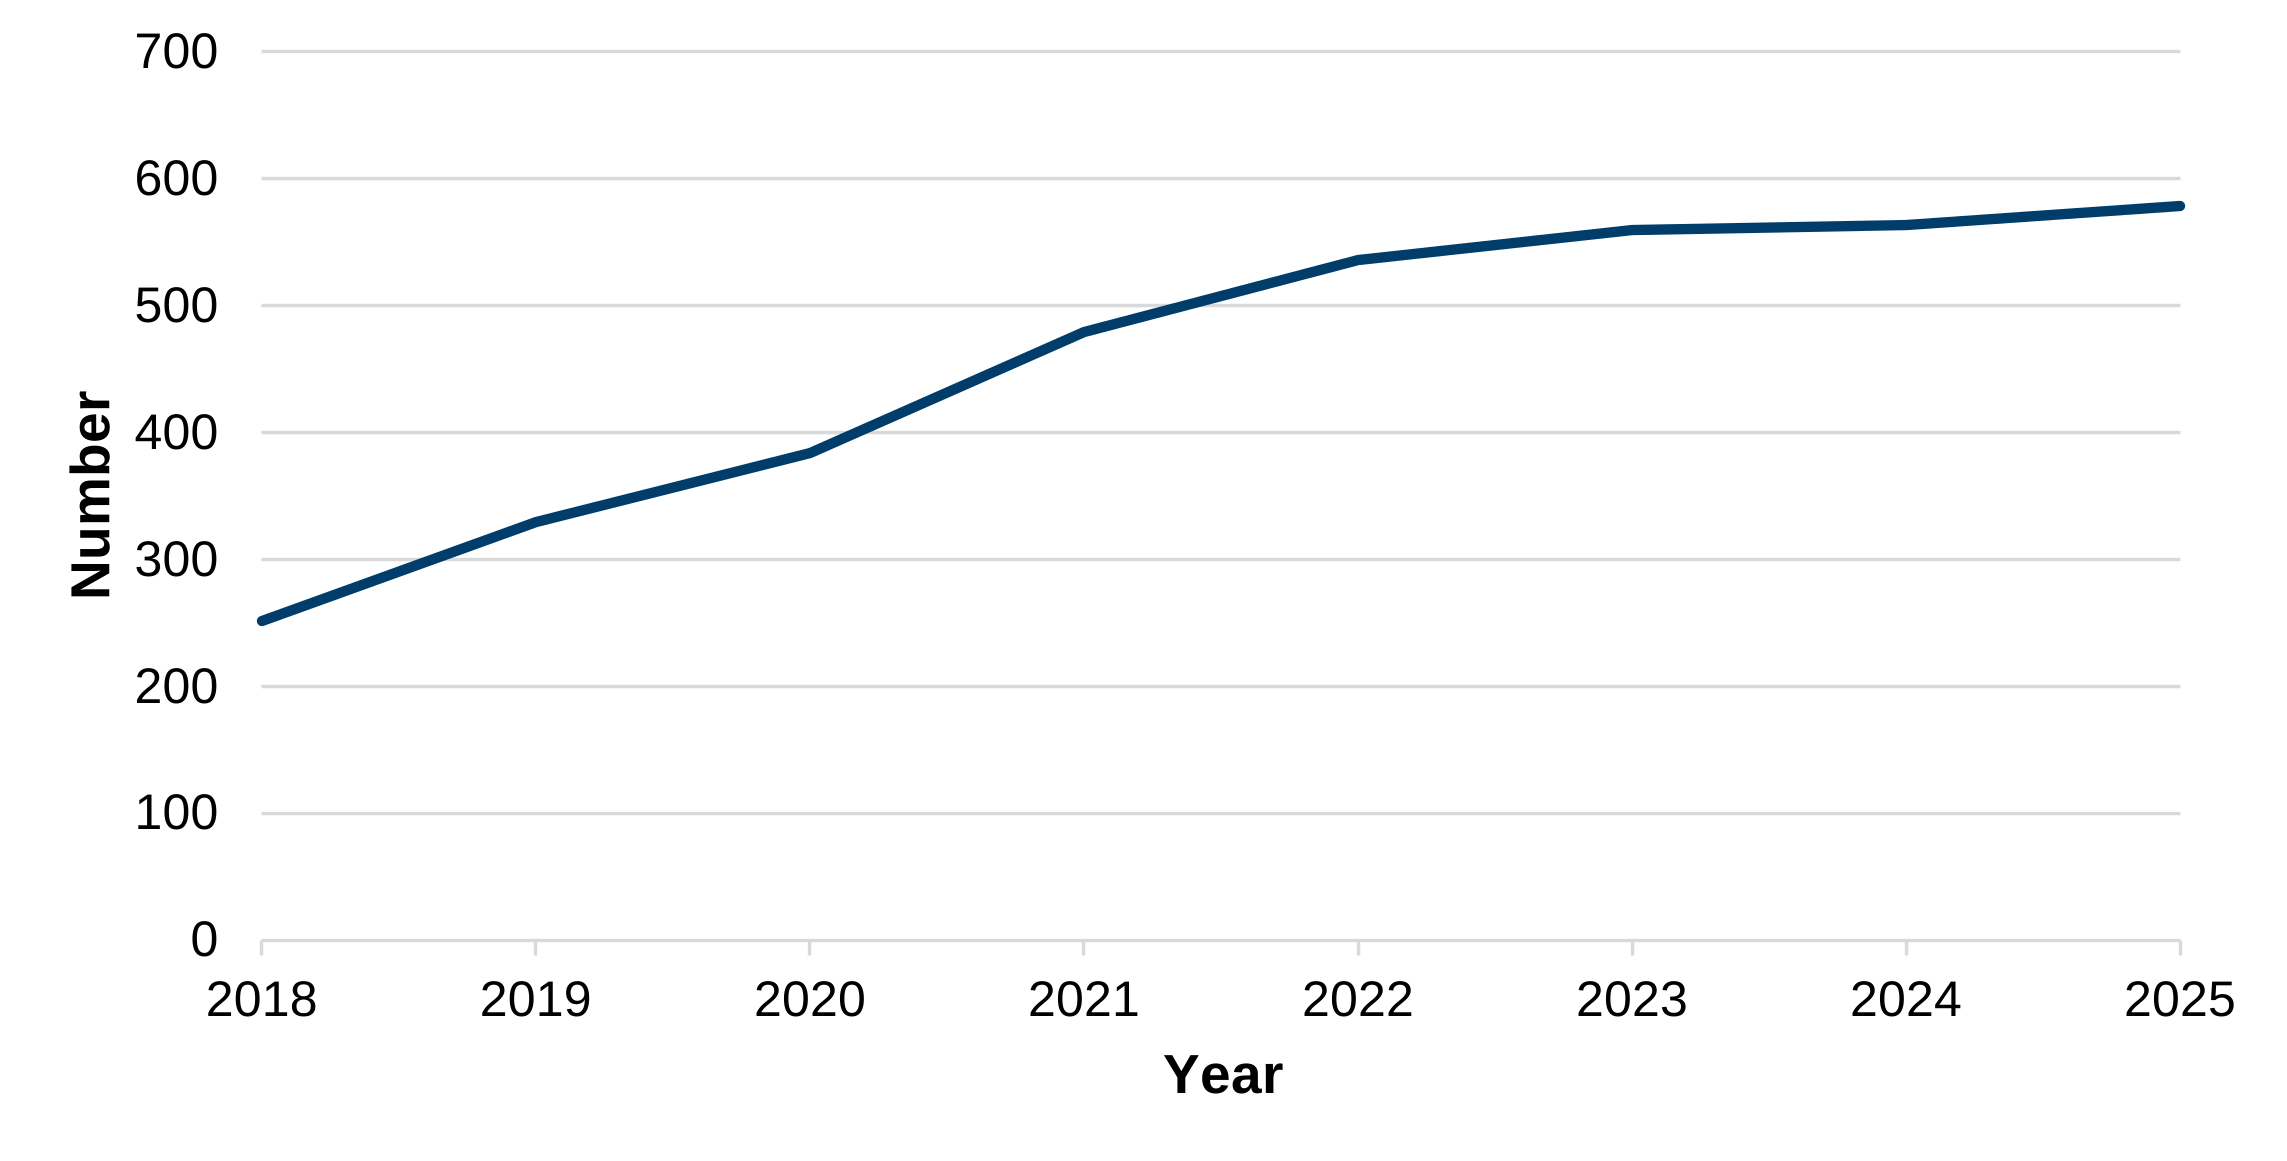
Description of figure 7.5: a line chart showing the number of referrals to the National Referral Mechanism for police forces in Wales between 2018 and 2025. The number of referrals has increased over the time period.
Source: National Referral Mechanism statistics, Home Office
In 2025 136 of the referrals were for females (24%) and 442 were for males (76%).
There were 200 (35%) individuals referred for adult exploitation categories and 378 (65%) referred for exploitation as a minor.
The most common type of exploitation for adults was ‘labour’ and for minors was ‘criminal’. For females (both adults and minors) the most common exploitation was ‘sexual’.
Forced marriage and female genital mutilation
Forced marriage or possible female genital mutilation has been identified in Wales. Goal 5 of the UN SDGs include a target to ‘eliminate all harmful practices, such as child, early and forced marriage and female genital mutilation’.
Data from the Forced Marriage Unit (FMU) show that the number of cases in which advice or support was provided in Wales has decreased substantially since a peak of 37 cases in 2019. Since then, the number of cases has generally decreased, with the figures for the most recent years remaining below 5 and therefore suppressed to protect confidentiality.
Due to the small number of cases in Wales, year to year figures can be volatile. Changes in patterns of reporting during the COVID-19 pandemic, as well as changes to recording practices, may also have affected trends over time.
| Year | Cases |
|---|---|
| 2015 | 25 |
| 2016 | 14 |
| 2017 | 17 |
| 2018 | 28 |
| 2019 | 37 |
| 2020 | 15 |
| 2021 | 8 |
| 2022 | 6 |
| 2023 | [c] |
| 2024 | [c] |
| 2025 | [c] |
Description of figure 7.6: a table of the number of cases where the Forced Marriage Unit (FMU) gave advice or support in Wales in relation to a possible forced marriage and/or possible female genital mutilation (FGM) in Wales. Due to low numbers relative to some other parts of the UK, the trend for Wales has been volatile since 2015.
Source: Foreign, Commonwealth & Development Office, Forced Marriage Unit statistics 2025
[Note 1] Owing to changes in recording practices the data from 2020 are not directly comparable with the data in previous years.
[Note 2] Some shorthand is used in this table, [c]= less than 5.
Global citizenship education
The UN SDG ‘Quality Education’ recognises the importance of obtaining a quality education and all learners acquiring the knowledge and skills needed to promote sustainable development, including sustainable lifestyles, human rights, gender equality and global citizenship.
In academic year 2025 to 2026, there were 19,074 entrants for the global citizenship challenge at Key Stage 4. There were 13,318 entries for the new advanced global community project. For Key Stage 4, provisional data shows 99.2% of entries achieved a level 1 pass or above. For the new advanced skills baccalaureate global community project, provisional data shows 74.5% achieved a C or above, and 97.7% achieved an E or above.
Food poverty
Some adults in Wales are facing food poverty and are concerned about affording food.
The UN SDG ‘Zero Hunger’ aims to end hunger and achieve food security and improve nutrition.
The financial year 2024 to 2025 National Survey for Wales reported that 4% of households had received food from a food bank in the last 12 months with a further 2% saying they hadn’t but had wanted to.
Asylum seekers
The number of asylum seekers receiving support has remained steady in the past few years but has increased since the start of the decade.
Goal 16 of the UN SDGs is to ‘promote peaceful and inclusive societies for sustainable development, provide access to justice for all and build effective, accountable and inclusive institutions at all levels’.
Complete figures for the numbers of asylum seekers and refugees who are resettled in Wales are not available. However, figures are published relating to the number of refugees resettled under the UK Resettlement Scheme (and formerly the Vulnerable Persons Resettlement Scheme), and the number of those currently receiving asylum support.
As at the end of March 2026, a total of 1,567 refugees have been resettled in Wales under the Vulnerable Persons Resettlement Scheme and the Vulnerable Children Resettlement Scheme (2016 to 2022) and UK Resettlement Scheme (2021 onwards).
Section 95 provides support for asylum seekers who have an asylum claim or appeal outstanding and failed asylum seekers who had children in their household when their appeal rights were exhausted, and includes those in receipt of:
- dispersed accommodation: those in receipt of accommodation only, or both accommodation and subsistence
- subsistence only: whereby the applicant receives cash to support themselves but who have found their own accommodation
At the end of March 2026, more than 3,100 asylum seekers were receiving support in Wales, a similar number to the previous year. The number rose sharply between 2012 and 2016, but has stayed broadly stable since then, with a dip in 2022 and 2023.
Figure 7.7: number of asylum seekers in receipt of Section 95 support, between financial years 2005 to 2006 and 2025 to 2026
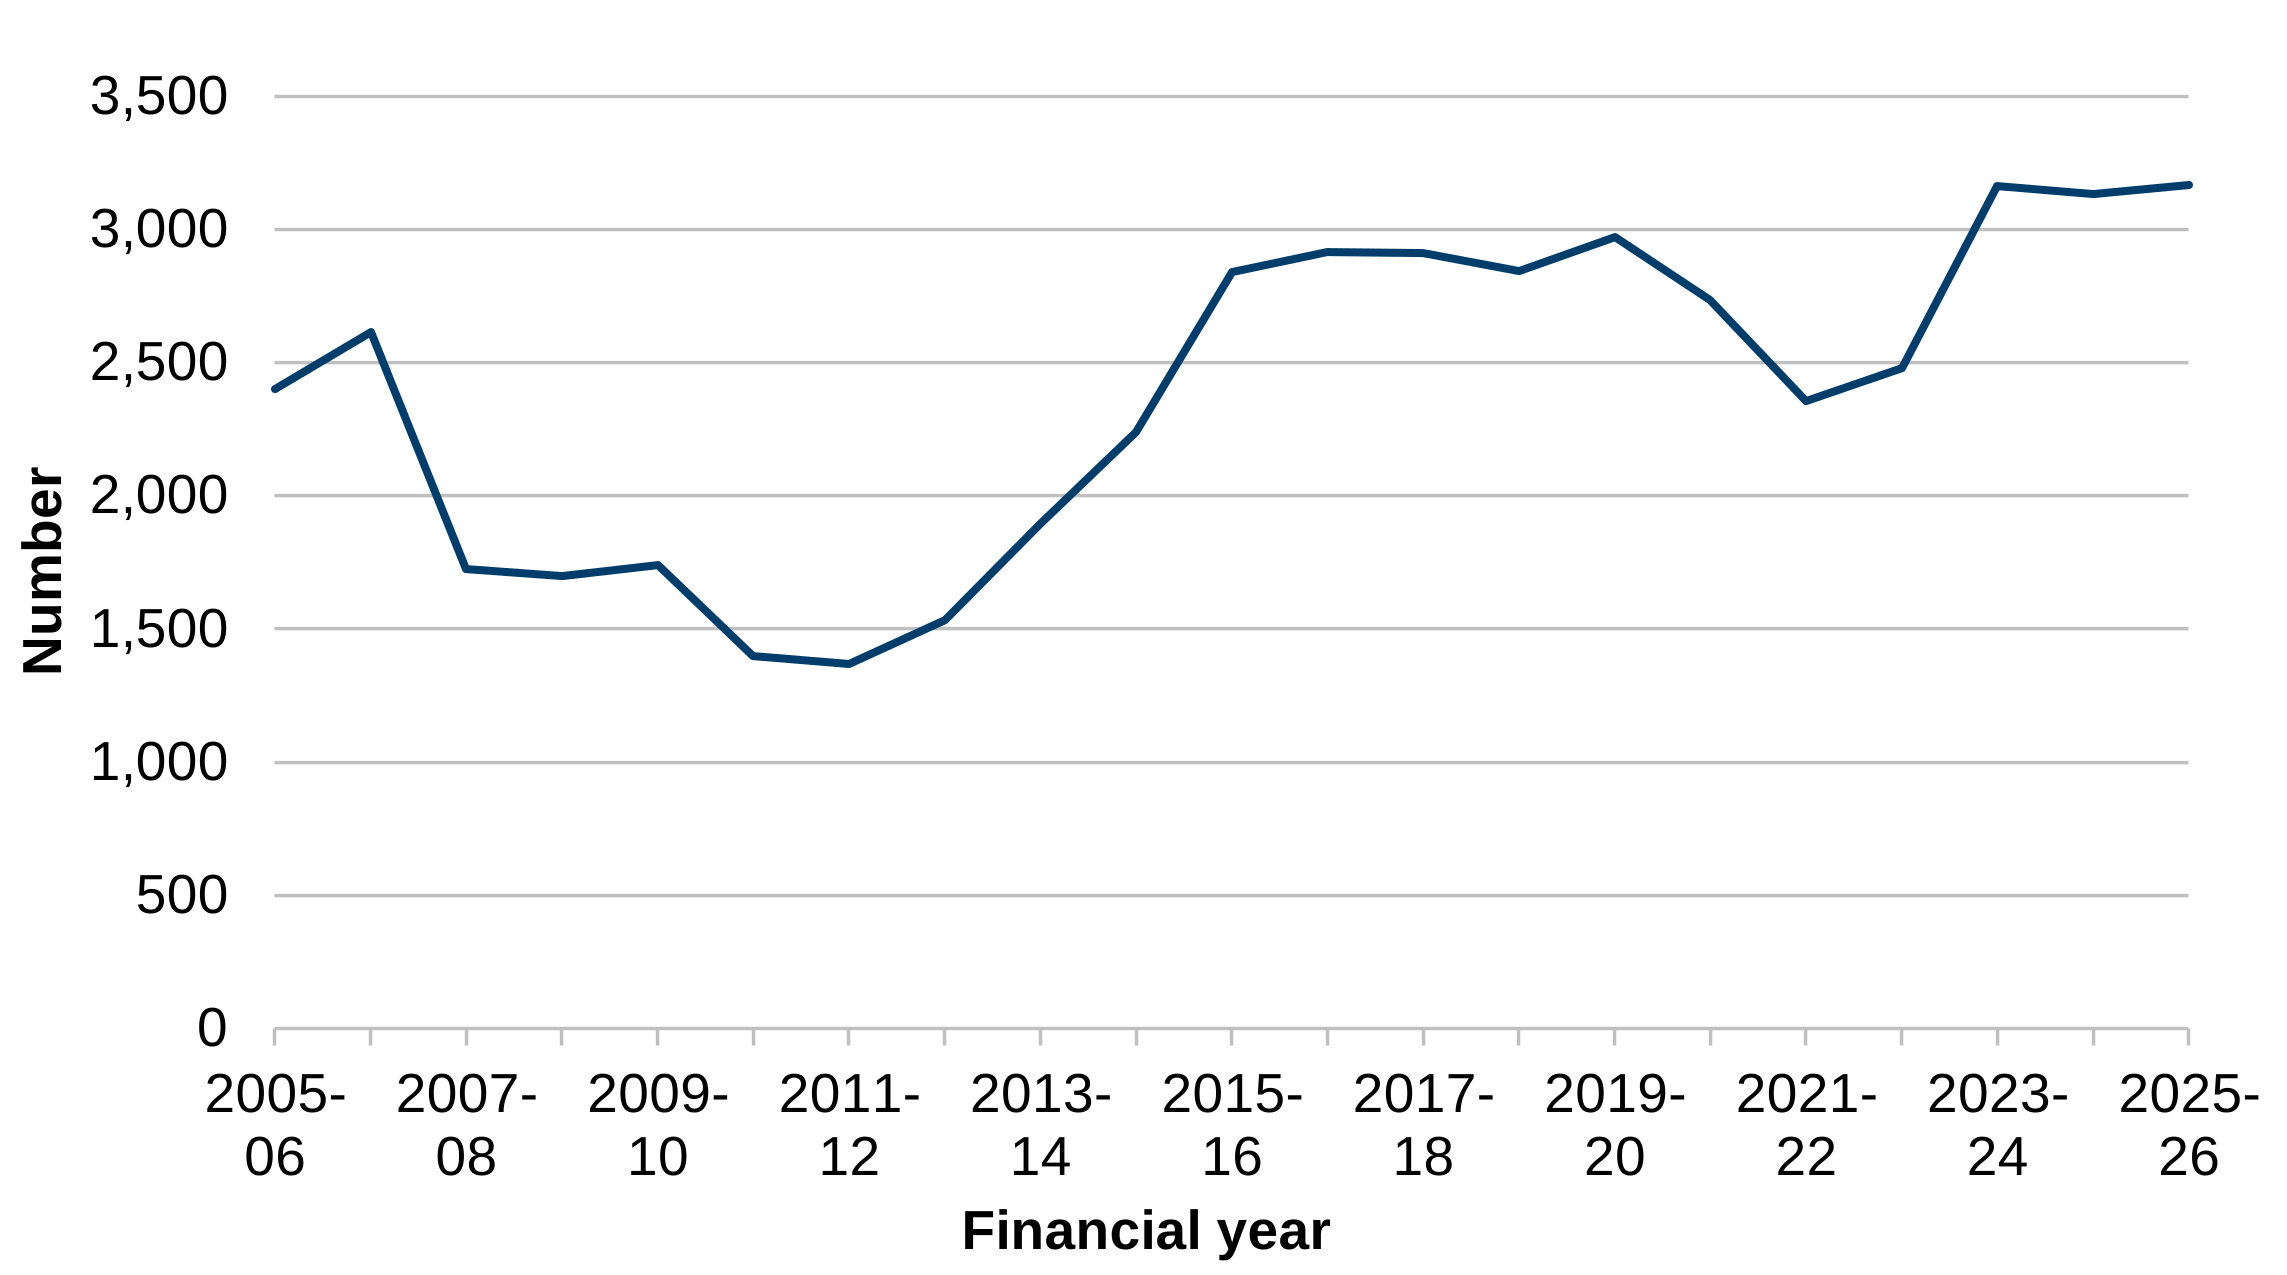
Description of figure 7.7: the line chart shows the number of asylum seekers receiving support remained steady in the financial year 2015 to 2016 to financial year 2019 to 2020, followed by decreases until 2021 to 2022, with increases in 2022 to 2023 and 2023 to 2024 and remaining similar in 2025 to 2026.
Source: Home Office Immigration statistics, financial year 2025 to 2026
Vaccination coverage
Vaccination uptake in young children remains high but has generally decreased since reaching its highest levels in financial year 2013 to 2014, for both ‘6 in 1’ DTaP/IPV/Hib/HepB1 for those reaching their first birthday, and MMR uptake of one dose by 2 years of age.
The UN SDG Sustainable Development goal ‘Good Health and Well-being’ states the importance of providing access to affordable and essential medicines and vaccines. The World Health Organisation has a vision for a world without measles, rubella and congenital rubella syndrome (CRS).
MMR uptake of one dose by age 2 was 92.5% in 2025 to 2026, down from 93.0% in the previous year. This remains below the 95% uptake level generally required to prevent outbreaks of measles.
Update of the ‘6 in 1’ DTaP/IPV/Hib/HepB1 vaccine (all 3 doses) in children reaching their first birthday was 93.1%, down from 94.1% in the previous year.
Figure 7.8: percentage uptake of childhood immunisations in Wales, financial years 2008-09 to 2025-26 [Note 1]
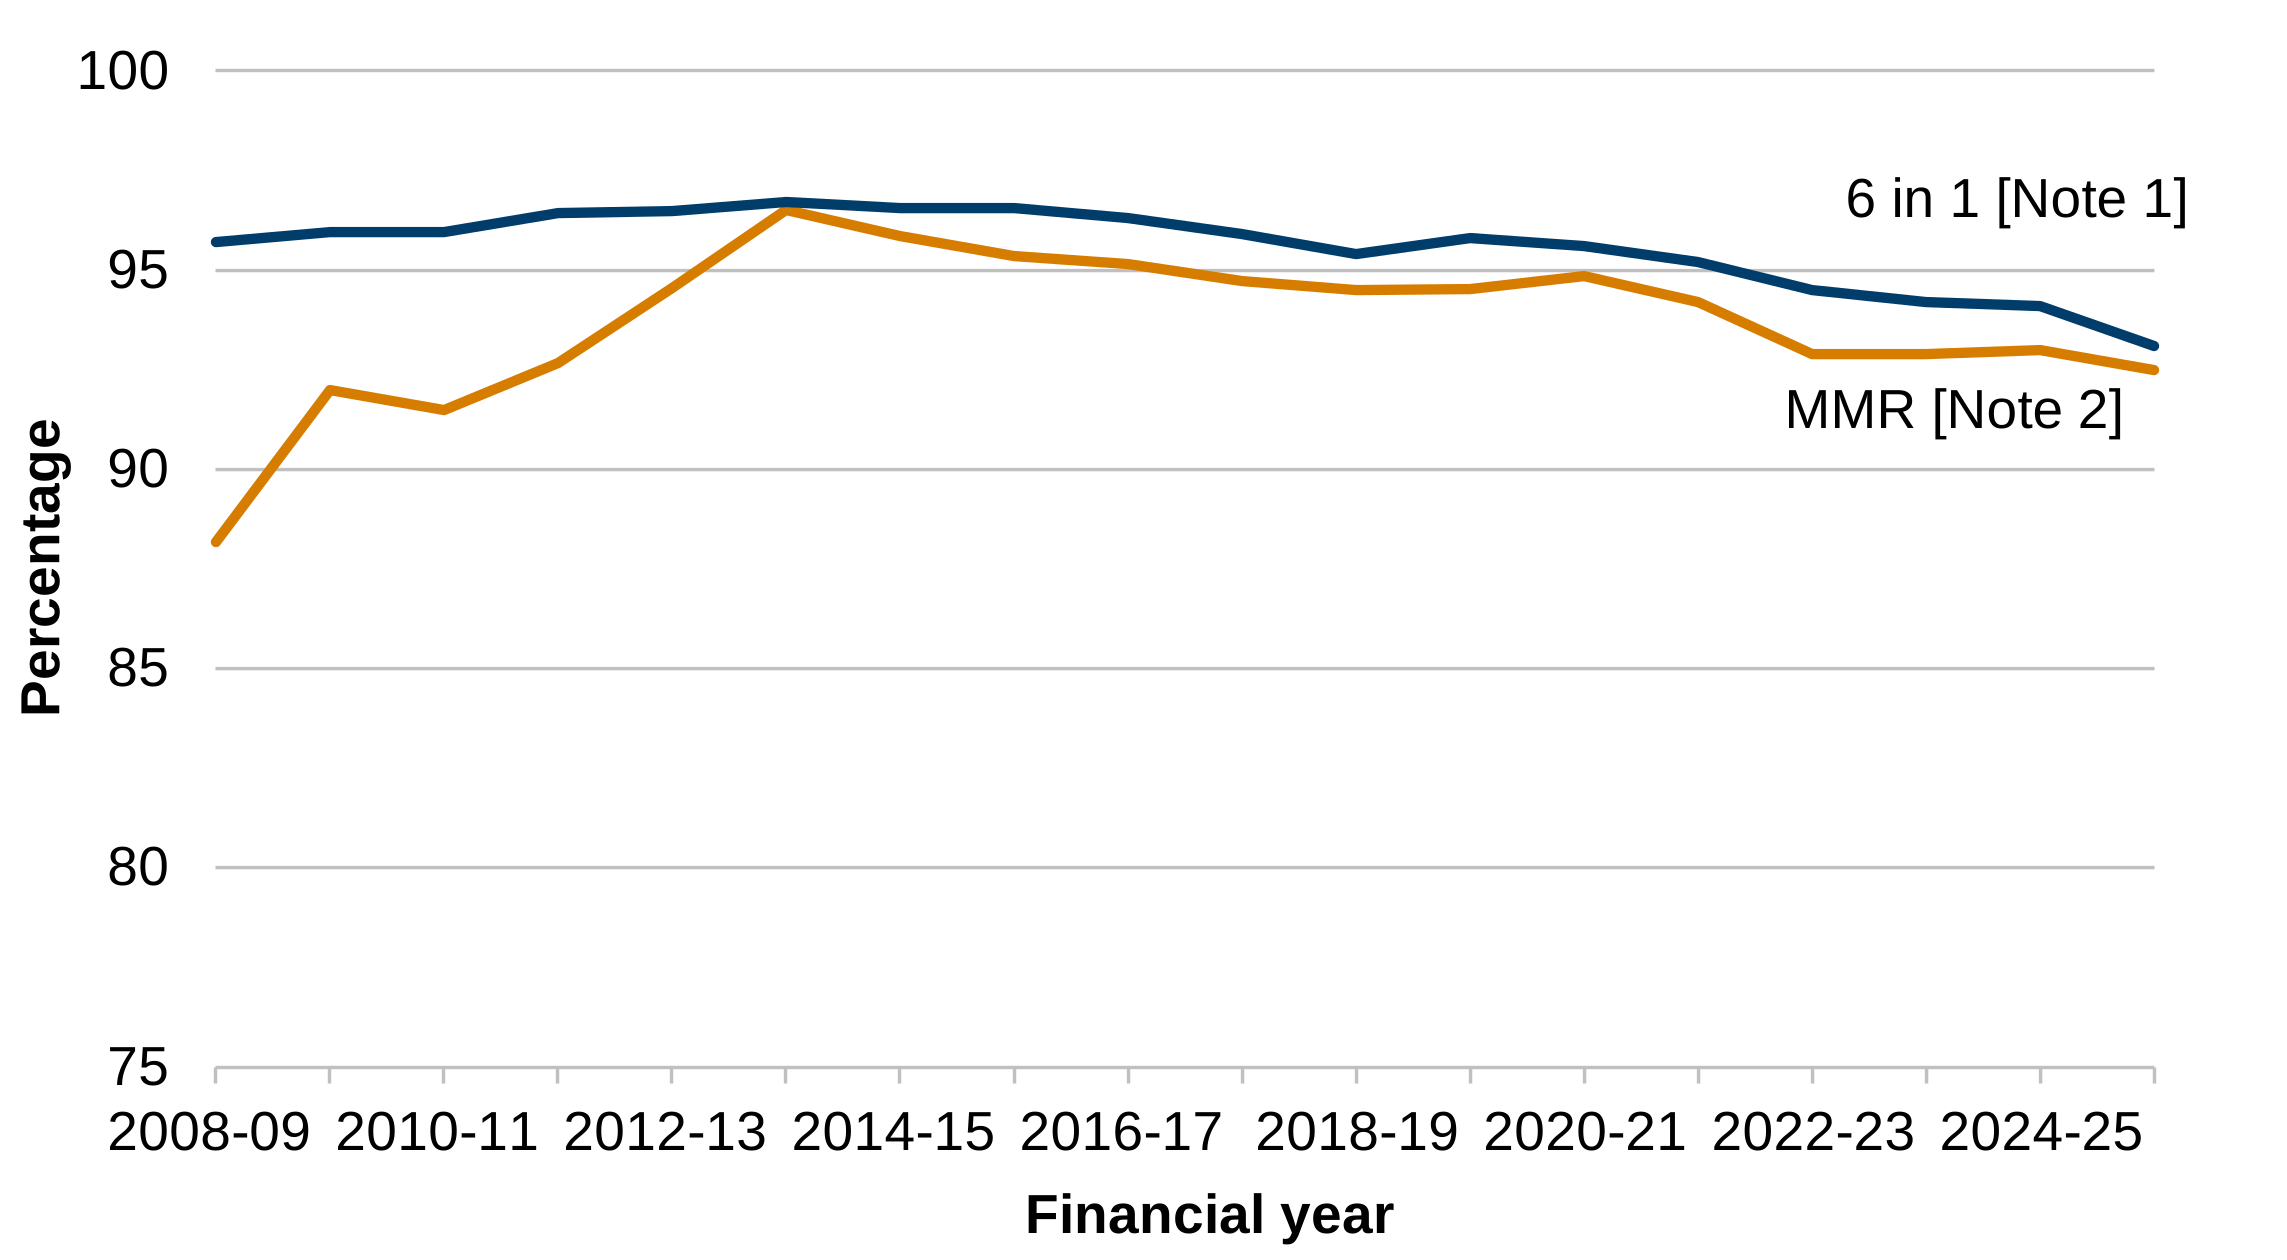
Description of figure 7.8: the line chart shows percentage uptake of MMR and the 6 in 1 vaccine from financial year 2008 to 2009 to financial year 2025 to 2026. Uptake for both the '6 in 1' and MMR have decreased since they reached their highest levels in 2013 to 2014. Uptake in 2025 to 2026 was 92.5% for MMR, and 93.1% for ‘6 in 1’.
Source: National immunisation uptake data, Public Health Wales
[Note 1] Chart axis does not start at zero.
[Note 2] The ‘6 in 1’ vaccine, protects against diphtheria, tetanus, pertussis (Whooping Cough), polio, Hib and Hepatitis B infection. The majority of one year olds referred to in this report would have been eligible for the ‘6 in 1’ vaccine, replacing the ‘5 in 1’ vaccine due at 4, 8 and 12 months.
[Note 3] MMR protects against measles, mumps and rubella. Data shows uptake for the first dose at 2 years of age.
Further reading
Previous Well-being of Wales reports, have included further analysis of:
- eco-schools
- physical punishment of children
- world heritage sites
This report covers a wide range of subjects, and therefore in this report it is only possible to consider high level measures of progress. Further reading can be found below.